EAST AFRICAN
JOURNAL OF
SCIENCE
1Volume 1 - Part 1 May 19981
An International Journal of Pure and Applied Science
East African Journal of Science 1(1): 2-10 (May 1998)
Analysis of soil for trace elements along two highways of Kenya
N.O. Hashim\ A.M. Kinyua', MJ.Mangala2 and I.V.S. Rathore" 'Department of Physics, Kenyatta University, P.O. Box 43844, Nairobi, Kenya. 2Institute of Nuclear Science, University of Nairobi, P.O. Box 30197, Nairobi, Kenya.
*Corresponding author.
Energy dispersive X-ray fluorescence technique has been used to study the levels oflead and other toxic trace elements in the soil samples collected along two major highways (Mombasa and Thika) of Kenya at the various distances off the road. The soil samples from Thika road are found to have higher concentration values of the trace elements: Cr, Zr; Mn, Fe, Y; Ni, Cu, Zn, Br and Sr than those from Mombasa road. The samples from Thika and Mombasa roads have maximum concentrations of Lead, 56 ug/g and 90 ug/g respectively at the distance of 100m off the roads, which is below the admissible value of 250 J..Lg/g for agricultural practices.
Key words: XRF analysis; pollution; trace elements; nuclear techniques; radiation; detection
INTRODUCTION
For a long time, the toxtcity of metals was considered as an occupational hazard. Industrialisation, urbanisation, increased vehicular traffic and use of fertilisers and pesticides in agriculture have resulted in increased contamination of environment by heavy metals. The toxicity of metals in the environment is becoming a matter of concern for the general population. It has been observed that the toxic metals, attributed to vehicular emissions, such as Lead, are deposited at relatively short distances from the road. Hay (1984) has reported that about 200,000 tons of lead is deposited on the earth annually due to the use of tetra-ethyl lead and tetra-methyl lead in fuel. Studies on the toxicity and essentiality of toxic trace elements have been carried out by several researchers (Nelson, 1991; Reichlnayr-Lais & Krichgebner, 1991; Mukhtar et al., 1991; Duane et aI., 1996; Hong & Ha, 1996; Oluwole et al., 1994; Ostachowicz et aI., 1995; Murti Krishna & Viswanathan, 1991; Heavy metal task force, 1991). At the same time, all mineral elements are essential to the environment, human beings and animals but their excess may lead to serious health hazards. Kinyua et al. (1991, 1993) have reported the concentrations of mercury, lead, cadmium, copper, manganese and iron in water and fish
samples from Nairobi-Athi river, and Naivasha area in Kenya, respectively. The study of the levels of mercury in water, fish, sediments and blood samples from different regions of Kenya have been done by Kamau et al. (1991).
The adjacent lands along most major highways of Kenya are left as open spaces, or used for small scale farming and grazing of cattle and livestock. Some grass and plants are expected to have high levels of lead and other toxic metals. So far, no study has been carried out to determine the concentrations of toxic metals in soil samples along Thika and Mombasa highways of Kenya. This work will be important and essential to study the impact of pollution on the health and environment.
EXPERIMENTAL
a. Sampling and sample preparation
The soil samples for the trace element analysis were collected at about 10 km intervals along the road and at 100 m intervals off the road. On Thika road at (a) Kasarani (b) Kenya Clay Products (KCP) (c) Juja and on Mombasa road at (a) Mombasa Penny Profit Store centre (MPPSC) (b) Caltex depot (c) Namanga junction, sampling was done at the top layer
«
activity (Barbara' Holynska, 1993). The soil samples collected were ground to fine particle size ofless than 50Jlm after oven drying at 105° C for 48 hours. For each sample, at least three pellets weighing between 100-20Omglcm2 were prepared for analysis.
b. EDXRF system
The energy dispersive X-ray fluorescence analysis system consists of an X-ray spectrometer and a radioisotope excitation source. The radiation from the radioactive source, CdlO9 (half life, TI/2 = 453 days and
activity = 10mCi) are incident on the sample which emits the characteristic rays. These X-rays are detected by Si(Li) detector (EG&G Ortec, 30mm2xl0mm sensitive volume, 25!J.m Be window) with a energy resolution of200 eV at 5.9keV Mn
K, -
line. The spectral data for analysis were collected using personal computer based Canberra S-100 multichannel analyser (MCA). The acquisition time applied in the EDXRF measurements was 1000seconds.c. Data analysis
X-ray spectrum analysis and quantification was done using IAEA QXAS software (QXAS, 1992) which is based on the fundamental parameters method (FPM) (Sparks, 1975; Giauque et aI., 1973, 1977). For each pellet sample, three intensity measurements were taken: sample alone, sample with multi-element target and target alone accordingly for absorption matrix effect corrections using the Emission - Transmission Technique (Sparks, 1975; Giauque et
al.,
1973, 1977). Consequently, elemental concentration values were calculated using the intensity equation developed for intermediate samples based on fundamental parameters method (FPM).Where:
Ij(Ej) is the measured fluorescent intensity of
element i:
Go
=
10
(Eo) Q1Q2 csc ~ I is the geometricalconstant:
K; is the relative excitation-detection efficiency for element i and is given by
K;~
cr
;
"
(E,)(1- )
J
r', "';, ---
(2)crr
(Eo) is the photoelectric cross section of an element i for the primary radiation of energy Eo:w!
is the fluorescence yield of an element i in the K-shell:f~
is the ratio of intensity of a given K or L line to the intensity of the whole series:p and d are the density and thickness of the sample:
E(Ej) is the relative efficiency of the detector at
energy Ej:
a·Iis the elemental concentration of element i in
gm
/
crrr':
a=!J.o(Eo)csc ~I
+
!J.I(E) csc ~2is the total massabsorption coefficient for primary and fluorescent radiation in the sample.
~Iand ~2 are the angles formed by the directions of the primary and fluorescent radiation with the sample surface respectively.
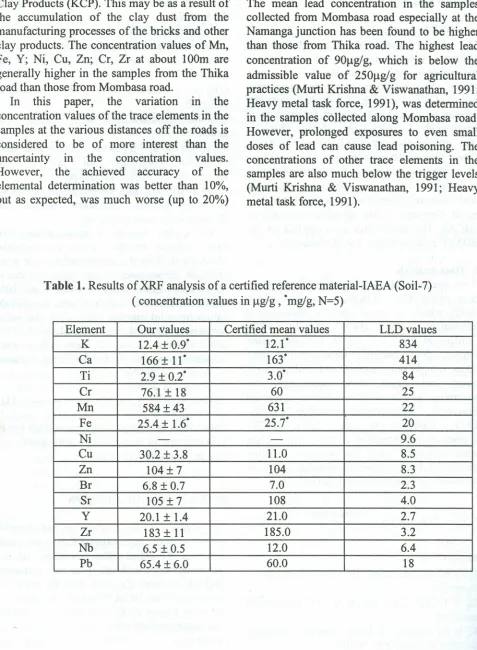
For quality control of measurements, we have analysed certified reference materials:
lAEA (Soil-7) by the same method. For most elements, the accuracy on concentration value is of the order in the range between 5 and 10% (Table 1). The lower limits of detection (LLD) values for solid samples prepared in the pellet forms were obtained from the analysis of lAEA soil-7 samples (Table 1). These values were calculated according to the following equation (Jenkins et
al
.
, 1995):
LLD ~ ~ ~( ~: ) ,--- (3)
Where
R,
is the background counting rate(c/s):Tbis the time for background counting rate:
m is the sensitivity in
cis
(ug/g)RESULTS AND DISCUSSION
of lead concentrations on Mombasa road may be due to heavy and more traffic on this road on compared to traffic on Thika road. The highest iron concentration of 237 mg /g is found at about 100m from Thika road near the Kenya Clay Products (KCP). This may be as a result of the accumulation of the clay dust from the manufacturing processes of the bricks and other clay products. The concentration values of Mn, Fe, Y; Ni, Cu, Zn; Cr, Zr at about 100m are generally higher in the samples from the Thika road than those from Mombasa road.
In this paper, the variation in the concentration values of the trace elements in the samples at the various distances off the roads is considered to be of more interest than the uncertainty in the concentration values. However, the achieved accuracy of the elemental determination was better than 10%, but as expected, was much worse (up to 20%)
for the trace elements whose concentrations were close to the detection limit.
CONCLUSION
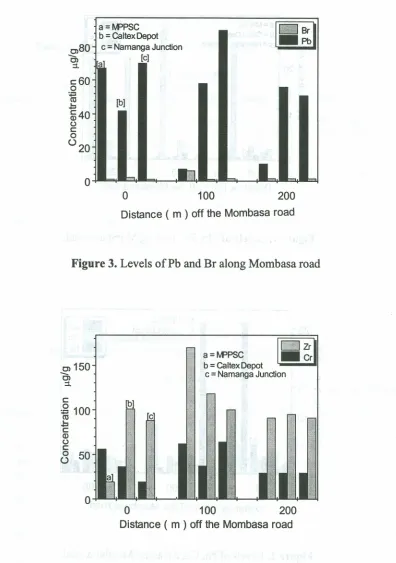
The mean lead concentration in the samples collected from Mombasa road especially at the Namanga junction has been found to be higher than those from Thika road. The highest lead concentration of 90J.lg/g, which is below the admissible value of 250J.lg/g for agricultural practices (Murti Krishna & Viswanathan, 1991; Heavy metal task force, 1991), was determined in the samples collected along Mombasa road. However, prolonged exposures to even small doses of lead can cause lead poisoning. The concentrations of other trace elements in the samples are also much below the trigger levels (Murti Krishna & Viswanathan, 1991; Heavy metal task force, 1991).
Table 1. Results of XRF analysis of a certified reference material- IAEA (Soil-7) ( concentration values in ug/g , 'mg/g, N=5)
Element Our values Certified mean values LLD values
K 12.4 ± 0.9" 12.1" 834
Ca 166 ± 11" 163" 414
Ti 2.9 ± 0.2" 3.0" 84
Cr 76.1±18 60 25
Mn 584 ± 43 631 22
Fe 25.4 ± i.s' 25.7" 20
Ni -
-
9.6Cu 30.2 ± 3.8 1l.0 8.5
Zn 104± 7 104 8.3
Br 6.8 ± 0.7 7.0 2.3
Sr 105 ± 7 108 4.0
Y 20.1 ± l.4 2l.0 2.7
Zr 183 ± 11 185.0 3.2
Nb 6.5 ±0.5 12.0 6.4
REFERENCES
)Iolynska,
B
.
1993. Sampling and sample
.
preparation in EDXRS.
X-ray Spectrometry22: 192
-
198.
Duane, M.J., Facchette, S.
&Pigozzi, G. 1996.
Site characterisation of polluted soils and
techniques for heavy metals.
Science of totalenvironment
177: 195-214.
Giauque, RD., Goulding, F.S., Jaklevic, lM.
&Pehl, RH.
1973. Trace Element
Determi-nation with Semiconductor Detector X-ray
Spectrometers.
Analytical Chemistry45:
671-682.
Giauque, R D., Garrett, R B.
&Goda, L
.
Y
.
1977
.
Determination of forty elements in
geochemical samples and coal fly ash by
x-ray fluorescence spectrometry
.
AnalyticalChemistry
49: 1012-1017.
~,
R
.
W. 1984.
Bio-Inorganic Chemistry.Ellis Horwood, Chichester
.
pp. 189-191
.
Hong, N
.
T.
&Ha, H
.
V. 1996. Applications of
.
EDXRF to the determination of lead and
other
elements
in
body
fluids
in
industrialisation workers in Vietnam.
X-raySpectroscopy
25: 314.
Heavy metals task force. 1991.
Aninter-disciplinary study of environmental pollution
of lead and other metals.
Progress report,
University of Illinois, USA
.
Jenkins, R
.
, Gould, RW. & Gedeke, D. 1995.
Quantitative X-ray spectrometry.
Marcel
Dekker, New York
.
Krishna Murti,
CR. &Puspa Viswanathan.
1991. Toxic metals in the Indian
Environment.
Tata
McGraw-Hill, Delhi,
India.
Kinyua, AM., Muigai, P.G.
&Kamau, G.N
.
1993. The analysis of cadmium, lead and
mercury in fish samples.
Proceedings of theKEMRl / KETRl. Annual Medical
Conference.
Nairobi, Kenya.
Kinyua, AM.
&N. Pacing, N. 1991
.
Impact
of pollution on the ecology of the Nairobi
ACTH river system in Kenya.
InternationalJournal of Biology, Chemistry & Physics 1:
5-7.
Kamau, G
.
N., Kinyuanjui, L
.
W., Thairu, P.A
&
J.C. Matasyoh, J.C. 1991
.
Levels of
mercury in water, fish, sediments and blood
samples from different regions of Kenya.
International Journal of Biology, Chemistry
& Physics
1: 9-13.
Mukhtar, S.,
Haswell,
s.r,
Ellis, AT.
&Hawke, D.T.
1991
.
Applications of TXRF
Spectrometry to elemental determination in
water, soil and sewage sludge samples.
Analyst
116: 333-338.
Nelson, F.H. 1991
.
Studies on the essentiality
of some elements ascribed as toxic- arsenic,
boron, lead, tin and vanadium
.
In B
.
Momcilovic
(ed.),
Seventh InternationalSymposium on trace elements in men and
animals.
Zagreb, Croatia. pp. 35-2
.
Oluwole, AF., Ajayi, O. Ojo,
r.o,
Obioh, I
.
B
.
,
Adejuma, J.A, Ogunsola, O
.
J
.
, Adepetu, A
,
Olaniyi, H.B
.
&Asubiojo,
0.1.1994
.
Characterisation of
pollutants around tin
mining
and
smelting
operations
using
EDXRF.
Nuclear Instruments and Methodsin Physics research,
Section A, 353:
499-502
.
Ostachowicz, J., Ostachowicz, B.
,
Holynska,
B
.
&Baran, W
.
1995
.
Applications of
EDXRF in a survey concentrations of lead,
zinc, and arsenic in soil from selected areas
in Krakow, Poland
.
X-ray Spectroscopy 24:81-83.
QXAS. 1992
.
Distributed by the International
Atomic Energy Agency, Vienna, Austria,
Reichlnayr-Lais, AM.
&Krichgebner
,
M
.
1991
.
Lead -
an essential trace element
,
In
B
.
Momcilovic (ed.),
Seventh InternationalSymposium on trace elements in men and
animals,
Zagreb, Croatia. pp.35-1
.
Sparks, C
.
J. 1975
.
Quantitative XRFA using
Fundamental Parameters.
Advances in X-rayTable 2. Elemental concentration values (ug/g, "mg/g , N= 3)
Thika road
Kasarani K.C.P. Juja
Element Om 100m 200m Om 100m 200m Om 100m 200m
Cr 210 104 76 429 856 162 563 382 497
Zr 265 423 431 661 842 658 702 1050 1140
Mn° 9 3 2 18 13 5 12 9 10
Fe• 227 81 137 106 237 36 148 98 22
Y
.
1 2 2 0.04 60 108 0.03 73 80Ni 9 5 5 19 77 7 24 18 27
Cu 25 23 17 17 33 19 21 18 29
Zn 19 14 10 111 127 90 25 22 29
Pb 16 26 21 46 55 22 56 44 49
Br 6 3 3 2 4 4 1 2 3
Sr 47 68 68 54 34 56 52 29 35
N= number of determinations.
Table 3. Elemental concentration values (ug/g, 'mg/g , N=3 )
Mombasa road
MPPSC Caltex Namanga junction
Element Om 100m 200m Om 100m 200m Om 100m 200m
Cr 56 62 29 36 37 29 19 64 29
Zr 19 170 91 101 118 95 88 100 91
Mn· 0.07 0.04 0.4 1 1.4 0.5 0.5 0.5 0.4
Fe
.
23 0.7 22 3 4 4 23 29 22Y• 0.7 0.004 0.6 0.7 0.7 0.6 0.7 0.7 0.4
Ni 2 26 2 3 3 2.5 26 1 2
Cu 1.3 1.5 2.5 2.4 2 3.5 5 9 3.5
Zn 2.4 3 3 5 3 4 10 3 4
Pb 67 7 10 42 58 56 70 90 51
Br 1 6 1.5 2 1 1.5 1 1.4 1.5
Sr 51 3 28 35 22 28 30 27 28
30 a=MlPSC
b = Caltex Depot c = Namanga Junction
o
100 200Distance ( m ) off the Mombasa road
Figure 1.Levels ofMn, Fe, Y along Mombasa road.
25
O'l
-
~20.
c:
~ 15
co
J;:. c:
Q) 10
o
c:
o
u
5[c
a =MJPSC
b=Caltex Depot - Zn
c=Namanga Junction
0
Cu _Nio
o
Distance ( m ) off the Mombasa road
100 200
0)150
-
0) ::1.c:
g
100co
J:J
c: Q)
o
c:
o 50
o
0)80
-
0) ::1.a =I'vPPSC
b=CaltexDepot e
=
Namanga Junction[el
I
_Pb-
Brl
ac:60
o
~
~ [b]
5540
oc:
o
U20
o
o
100 200Distance ( m ) off the Mombasa road
Figure 3. Levels of Ph and Br along Momhasa road
a = I'vPpsc
II
c,I
~I
b=CaltexDepot e=Namanga Junction
o
o
100 200Distance ( m ) off the Mombasa road
250
!?}200
en
E
g
150••
m~
55
100o
c::
o
o
50[e
i
-o •
LJI~'.III!I....,f----jAIIIi2I.""·E1.~IIIIt·--f---~ ••JL
••o
100 200Distance(m) off theThika road
a = Kasarani b=KCP
e=Juja
a
[b)
Figure 5. Levels ofMn, Fe, Y along Thika road.
_Zn
120 [b] Dcu
_Ni
!?}100
a = Kasarani
C>
::t b=KCP
c:: 80 e=Juja
0 :;:::;
m 60
L.. .•....
c:: Q)
o 40
c::
0 [a)
o
20
0
o
100 200Distance (m) off the Thika road
~ 50
::t
c::
40
o~
m
~ 30
Q)
o
§
20
o
60~---a-=~~-s-a-m~ni--~I
1
~~
~
~J=&=a
b=kcp _
c=Juja
Pb
10
o
o
100
~O
Distance ( m ) off the Thika road
Figure 7. Levels ofPb and Br along Thika road.
1200 a=Kasarani
b=KCP
~1000
c=Juja
::t
A~.
800
'Jjc::
0
~
m
600
.bc::
Q)
0
c::
400
0
o
200
0
o
100
200
Distance ( m ) off the Thika road