Available Online atwww.ijcsmc.com
International Journal of Computer Science and Mobile Computing
A Monthly Journal of Computer Science and Information Technology
ISSN 2320–088X
IJCSMC, Vol. 4, Issue. 8, August 2015, pg.195 – 208
RESEARCH ARTICLE
The Effect of Noise on the Clustering
Algorithm Results
Dr. Jassim T. Sarsouh, Dr. Kadhim M. Hashim, Huda Qassim
Department of computer science, College of Education for pure science, University of Thi-Qar, Iraq/ Thi-Qar
Abstract
The objective of this paper is to study the effect of noise on the performance of various clustering algorithms. Clustering is being widely used in many applications including medical, finance and etc. Clustering may be applied on database using various approaches, based upon distance, density, hierarchy, and partition. The data item which is not relevant to data mining is called noise. Noise is major problem in cluster analysis, which degrades the performance of various clustering algorithm in the term of efficiency and time. Our purpose is to study how a proposed algorithm is responsive to the noise in the efficiency. We have used K-mean algorithm and our proposed clustering algorithm which is based upon the partitioned or non-hierarchical clustering. We will introduce noise in our database and the same will be used for clustering algorithm. Then the percentage of noise will be varied, the efficiency and the time required for clustering will be calculated. The observation results will be used to compare algorithms efficiency and processed time.
Keywords: clustering, neighborhood, K-Means algorithm, Image Processing, noise.
1-Introduction
We can recognize different human beings by looking at their faces. To identify an individual, we look at the external faces characteristics. We recognize many faces after several years of separation by comparing their faces outlines characteristics [1,2].
The evolution in computer sciences aided the researchers to recognize human beings from their faces by using different techniques in the fields of image processing, face recognition, and clustering [3, 4, 5].
of losing certain fine details[6].For example, If we put many face images with different rotation angles for a certain person with hundreds face images of other persons, we can recognize these images from the other face images easily, that is because the face images of any person will still preserve his common characteristics in spite of the variation in these images which are caused from the horizontally and vertically rotation by a specific degree. This process caused the clustering of the images of any person in one cluster with small probability of an error ratio. [7]
2- Digital Image processing (DIP)
DIP is one of the important fields in computer science that is concerned with the computer processing of images. These images come from many different sources such as digital cameras, scanners and satellite sensors. They are stored as a file of a specific format. In general, the purpose of digital image processing is to enhance or improve the image in some ways, or to extract information from it [8].
Different approaches are used to represent the image on computer systems such as binary images, gray-level images or color images; we will apply the gray-level images in this paper. The 2-D continuous image may be divided in N rows, and M columns. The intersection of a row and column is called a pixel. The value assigned to every pixel is the average of the brightness in that pixel rounded to the nearest value. The process of representing the amplitude of 2-D signal at a given pixel determines the gray-level of that pixel[7].
3- Clustering Techniques
Clustering is a popular unsupervised pattern recognition technique which partition the input population of size N into M clusters ( regions) based on some similarity or dissimilarity metrics [9,10,11] .
The Clustering technique had been applied for the first time in 1753 by Adnsion [12] in the biological field in order to classify the animals and plants. In 1963 Sokal and Sneath [13] had studied this technique in the field of the numerical taxonomy.
After the evolution in the hardware and software of the computer sciences, the clustering analysis has been applied in different fields such as image classification, pattern recognition, image segmentation and classification of animals and plants [14-18].
The following subsections describe the principle ideas of automatic and none-automatic clustering techniques.
3-1 Automatic clusteringtechniques
while choosing a very small value R led to get clusters such that each individual on the studied population will construct one cluster with one element. Therefore choosing an optimal value of R will give an optimal classification. The optimal value of R can be determined either experimentally or by using some approaches of computation. We proposed an automatic clustering algorithm by using the adaptive neighborhood concept, where the results of our algorithm depend on the chosen values of K and R.
3-2Non-Automatic clusteringtechniques
In this type of clustering, the number of clusters must be given a priori by the programmer. The K-means clustering algorithm is a sample of this type. The accuracy of the obtained results depends on the predicted number of clusters chosen by the user when this algorithm is implemented on real dataset.
The following steps are represent the K-Means clustering algorithm steps [21].
Step[1]: Choose K cluster centers to coincide with K randomly chosen parameters. Step[2]: Assign each pattern of the studied dataset to the closet cluster center. Step[3]: Recompute the cluster centers using the current cluster memberships. Step[4]: If a convergence criterion is not met, go to step [2].
4- Neighborhoods
Neighborhood operation plays a key role in modern digital image processing and clustering techniques. In this paper we have used different types of neighborhoods for given images such as the K_nearest, the R and the adaptive neighbors.
4-1 The K-nearest neighbors
We can recognize the 4_ connected neighbors and the 8_connected neighbors in the rectangular sampling and the 6_connected neighbors in the hexagonal sampling [22]. In general, the K_nearest neighbors means that for each individual in the studied population we must determine the K individuals that must be the nearest with respect to the tested individual [23]. In the K_nearest neighbors, the number of neighborhood elements for each individual in the studied space is an integer constant.
4-2 The R-neighbors
From the literature review, we found that there exists another type of neighborhood which has not always constant number of neighbors [24,25].
whose center is X and radius is R. Therefore the neighborhoods of X in R_level will contain all the individuals in that population that are laying only in the interior region of that circle
(sphere), we usually call this type of neighboring is R_neighborhood.
Mathematically, let R be the value of the threshold, and X be any individual in the studied population, we can define the R_neighborhood of X as follows:
R_neighborhood (X)={Y∈POP | d (X,Y) <R } where d is a distance measure.
4-3 The adaptive-neighborhood
From our experiments, we notice that if we take a constant threshold for all the studied individuals, we may get good results, but these results may not be the best. This is especially in the case where the real structure of the studied data contains many groups, where the individuals of some groups are distributed in small region while the individuals of the other groups are located in a large region.
In order to solve this problem, we proposed an adaptive threshold such that each individual of the studied population has its special threshold value. We applied hybrid technique which uses the notions of K_nearest neighbors and R_neighborhood.
5- Data preparation
5-1 Samples of the processed images:
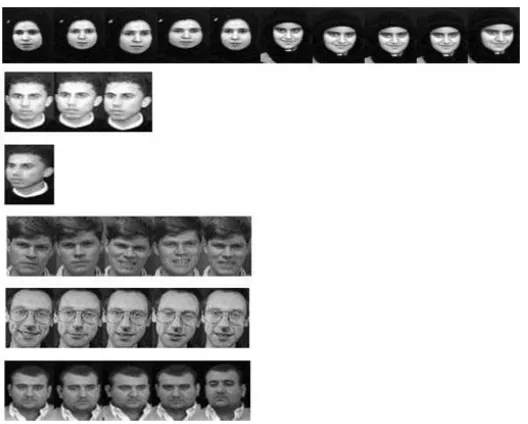
In this paper we apply the proposed algorithm on the following face images:-
1-Human face images which are taken from the ORL (Olivetti ResearchLaboratory) database for 25 persons and each one has (5) images with different orientations and with different simple facial expressions [26].
2- Human face images which are taken from the Iraqi persons for 15 persons and for each one we took 5 face images with different rotation angles.
3-Merging the images of (1) and (2), and process them by using our algorithm. The following algorithm is used for the preparation human face images of Iraqi persons.
5-2 Algorithm-1 :The pre-processingsteps
The following steps are used to prepare data (face images) which are taken from Iraqi population to be in same conditions. We take (25) persons in different ages and we take (5) image for each one with different rotation angles. The rotation angles are (-10o, - 5o, 0o, 5o, 10o).The steps are:
Step [1]: Use the same camera with the same resolution and zooming, the samefixed distancebetween the camera and the person, and the same fixedlocation level (height ) for the camera with the respect to the person face.
Step [2]: Use the same format. In this research the studied images are of typeJPEG. Step[3]: Convert each studied face image into the Gray-level.
Step [4]: Normalize each studied face image by using the program ACDSee [22].
6-The proposed clustering algorithm
We propose the following automatic clustering algorithm in which we apply the techniques of template matching of images. This algorithm is improve of the previous algorithm that have been proposed source [27] to handle imbalance that got in the previous algorithm. It consists of the following steps:
Algorithm-2: Automatic clustering algorithm
Input :
- Number of images N .
-Perfect clusters for calculating the efficiency.
Output :
-Clusters matrix C .
-Threshold for higher efficiency . -Higher efficiency .
Algorithm steps :
Step[1] : Apply pre- processing steps on the input data.
Step[2] : Find a distance matrix between all the images by calculating the Euclidean distance between each two images If the number of images N then the distance matrix will be N ×N.
Step[3] :find a neighbors matrix as a primary value for the distance threshold. They are selected threshold according to a medium value reduces the overlap of clusters and prevent the dispersion per cluster. Where is the value of the distance test with the multiplication rate in the distances and threshold values shall take only the smallest distance and given the value of one of the neighbors matrix In the event that greater value is given a value of zero neighbors matrix. Thus, the neighbors matrix will be as well as the N × N.
Step[4] : establishment of clusters matrix from neighbors’ matrix for each picture and in this case, the number of clusters is equal to the number of images. Through the guide rows or columns that are valued only 1.
Step[5] : Find intersecting groups and integrate them into a single group and delete the other group. Where is the comparison between each two clusters If the result of the intersection of two clusters is empty set, two clusters are merged in one cluster.
Step[6] : calculate efficiency of this threshold . Where these clusters are compared with the perfect threshold clusters and the difference between them represent the error rate and from it the efficiency is calculated.
Step[7] : Repeat steps(2) to (5) for new threshold. Find new neighbors matrix according to the new threshold and the establishment clusters and then merged the joint clusters and calculate the efficiency of these clusters with perfect clusters. For each threshold value and efficiency associated with them are stored then finding the higher value to the efficiency and finding the threshold value associated with them.
7- Add noise
After creating our database that contain the processing human face images, we
apply the K-means algorithm and the proposed algorithm on it and extract the results,
then we add noise to the images and created the new database. We added two types of
noise (Gaussian, Salt and pepper) noises and each type of these types have been added in
two ratios. These ratios are (2%and 8%).After created the new database that contains
the noise we will again apply the K-mean algorithm and proposed algorithm on it and
extract the results. After that we will compare and analysis the performance of the
clustering algorithms based on the efficiency and the time required. Then we will
conclude which algorithm is more realistic to noise.
8- Practical results and discussions
This section contains three experiments and the discussion of their results.
8-1 Experiments
Experiment_1:
In this experiment, we applied our proposed clustering algorithm on the standard face images taken from the ORL database. We randomly chose (20) persons, and for each one there are (5) face images with different rotation angles and facial expressions. The following figure shows a sample of the results of this experiment:
Experiment_2:
In this experiment we randomly chose (20) persons from the Iraqi population. We took five face images for each person, and apply the processing steps in order to decrease the percentage error which may occurred as a result of bad preparation. The studied data contains face images of females and males with different orientation and simple facial expressions. Some of them are with glasses.
The following figure shows a sample of the results of this experiment:
Figure (2): Samples of results obtained from exprement_2.
Experiment_3:
In this experiment, we merge the data of experiment_1 with the data of the experiment_2. Figure (3) shows a sample of the results obtained from this experiment.
Experiment_4:
Firstly, we add Gaussian noise to our database with (2%) and apply the K-means algorithm
andthe proposed clustering algorithm on noisy images. Table (1) shows the results of
application of twoclustering algorithms (K-means algorithm andthe proposed clustering
algorithm).The algorithms are applied on database with different sizes and number of
clusters.Table (2) shows the results of application of two clustering algorithms after adding
Gaussian noise with (8%).
Table (1): The comparisons between the result of the two algorithms
with Gaussian noise by (2%)
The algorithm Datasets size Number of cluster Execution
time threshold
Efficiency ratio
The proposed algorithm
50 01 0.251159 0.6360 011%
100 01 0.489761 0.6020 79%
150 01 0.680703 0.6260 79%
200 01 1.047561 0.6190 79.9%
Non-Automatic
K-means clustering algorithm
50 01 2.532670 - 011%
100 01 5.663851 - 99%
150 01 14.787453 - 91%
200 01 25.613771 - 99%
Table (2): The comparisons between the result of the two algorithms
with Gaussian noise by (8%)
The algorithm Datasets size Number of cluster Execution
time threshold
Efficiency ratio
The proposed algorithm
50 01 0.264292 0.6360 011%
100 10 0.503107 0.6010 86%
150 21 0.710335 0.6250 87%
200 31 1.003489 0.6200 8454%
Non-Automatic
K-means clustering algorithm
50 01 2.422705 - 31%
100 11 6.908963 - 61%
150 21 12.619742 - 703.%
Experiment_5:
Secondly, we add Salt & pepper noise to our database with (2%) and apply the K-means
algorithm andthe proposed clustering algorithm on noisy images. Table (3) shows the
results of application of two clustering algorithms (K-means algorithm andthe proposed
clustering algorithm).The algorithms are applied on database with different sizes and
number of clusters. Table (4) shows the results of application of two clustering algorithms
after adding Salt & pepper noise with (8%).
Table (3): The comparisons between the result of the two algorithms
with Salt & pepper noise by (2%)
The algorithm Datasets size Number of cluster Execution
time threshold
Efficiency ratio
The proposed algorithm
50 01 0.267112 0.6170 011%
100 11 0.522920 0.5880 88%
150 21 0.699789 0.6200 87%
200 30 1.007727 155111 8454%
Non-Automatic
K-means clustering algorithm
50 01 1.843770 - 51%
100 11 6.071592 - 61%
150 21 9.413613 - 5555%
200 31 19.164856 - 68%
Table (4): The comparisons between the result of the two algorithms
with Salt & pepper noise by (8%)
The algorithm Datasets size Number of cluster Execution
time threshold
Efficiency ratio
The proposed algorithm
50 01 0.265253 0.7360 011%
100 11 0.556009 0.7040 86%
150 20 0.678916 0.7090 8652%
200 33 0.987175 0.7150 8154%
Non-Automatic
K-means clustering
algorithm
50 01 2.638923 - 71%
100 11 5.834061 - 41%
150 21 15.560551 - 66%
8.2. Discussions and Conclusions
1. For the automatic clustering, the number of the clusters is determinated automatically by this algorithm, while for the K-means clustering algorithm, the number of the clusters is given a priori by the user. As consequence, the automatic clustering algorithm is better than the K-means clustering algorithm because the first algorithm gives clustering results which simulate the real structure of the studied dataset.
2. We notice that the quality of the obtained results depends on the chosen values for the threshold in the automatic clustering algorithm, and on the chosen value for (K) in the K-means algorithm. In fact, choosing large value for threshold in automatic algorithm will cause to put the face images of two persons or more in the same cluster, while choosing small value for this threshold, will cause to put the face images of one person in two clusters, or more. Conversely, for the K-means algorithm, choosing small value to K will merge the face images of more than one person in the same cluster, while choosing large value to K, will divide the face image for one person into many clusters.
3. Regarding the execution time criterion, the automatic clustering algorithm is usually better than K-mean algorithm.
4. Concerning the success percentage criterion, the automatic clustering algorithm gives always better results.
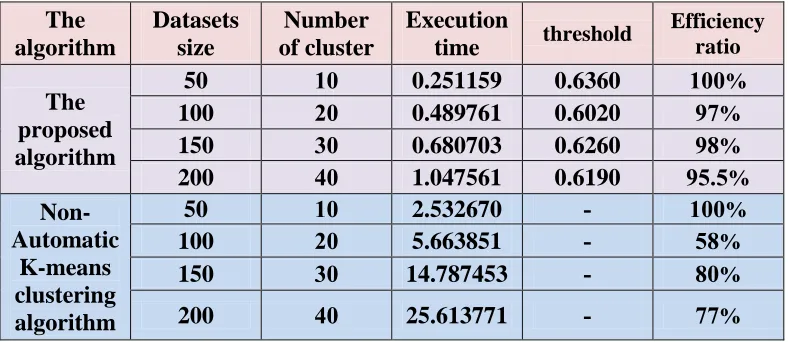
5. Table (5) shows thecomparative results for the two algorithms, where each algorithm is firstly implemented on (50) face images concerned (10) personsfrom the ORL database, secondly each of the two algorithms is implemented on (100) face images concerned (20) personsfrom the ORL database, and thirdly each of the two algorithms is implemented on (200) face images concerned (40) persons from the ORL database.
Table (5): The comparisons between the result of the two algorithms for experiment 1:
The
algorithm Datasets size
Number of cluster
Execution
time threshold
Efficiency ratio
The proposed algorithm
50 00 0.267281 0.6830 85%
100 11 0.532441 0.7110 82%
111 31 1.073735 155701 74%
Non-Automatic K-means clustering algorithm
50 01 1.472165 - 31%
100 11 3.584567 - 51%
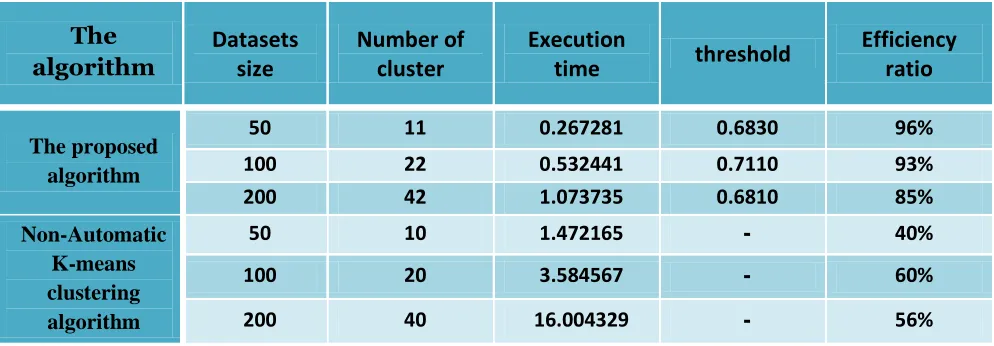
6. Table (6) shows the comparative results for the two algorithms, where each algorithm is firstly implemented on (50) face images concerned (10) personsfrom the Iraqi population, secondly each of the two algorithms is implementedon (100) face images concerned (20) personsfrom the Iraqi population, and thirdly each of the two algorithms is implemented on (400) face images concerned (80) personsfrom the Iraqi population.
Table (6): The comparisons between the result of the two algorithms for experiment 2:
The
algorithm Datasets size
Number of cluster
Execution
time threshold
Efficiency ratio
The proposed algorithm
50 01 0.244867 0.6130 011%
100 07 0.464675 0.6000 77%
Non-Automatic K-means clustering
algorithm
50 01 1.548849 - 51%
100 11 5.845803 - 34%
7. Table (7) shows the comparative results for the two algorithms, where each algorithm is firstly implemented on (50) face images concerned (10) persons from the Iraqi population and the ORL database, secondly each of the two algorithms is implemented on (100) face images concerned (20) persons from the Iraqi population and the ORL database , thirdly each of the two algorithms is implemented on (150) face images concerned (30) persons from the Iraqi population and the ORL database ,fourthly each of the two algorithms is implemented on (200) face images concerned (40) persons from the Iraqi population and the ORL database,and fifthly each of the two algorithms is implemented on (600) face images concerned (120) persons from the Iraqi population and the ORL database.
Table (7): The comparisons between the result of the two algorithms for experiment 3:
The
algorithm Datasets size Number of cluster
Execution
time threshold
Efficiency ratio
The proposed algorithm
50 10 0.257048 0.5720 100%
100 21 0.504499 0.5320 99%
150 .3 0.738374 0.5720 89%
200 40 1.024322 0.5410 97%
Non-Automatic
K-means clustering algorithm
50 03 2.297606 - 93%
100 03 6.648932 - 93%
150 .3 9.824124 - 93%
8. From the three experiments, we noticed that the different face images of any studied person are often belonging to the same cluster. This means that the face preserves common features in spite of the variation which is caused by different rotation and different facial expressions.
9. Finally, for the dataset size criterion, the proposed clustering algorithm is better than the K-means algorithm for the processing of the huge datasets.
References
[1]
V. Starovoitov, Samal, and Sankur, "Matching of Face in a Camera Image andDocumenPhotographs",InstituteofEngineering Cybernetic Suraganora, Min, Belarus, (1997) .
[2]
I. Craw, D. tock, and A. beautt,"Finding Face Features ", in proc.2nd Europ Conf. on ComputerVision,pp 92-96,(1992).
[3]
T. kande ,"Computer Recognition of Human Face",Based and Styttgrat, Birkhausar,(1977)
[4
R.C. Gonzalez, and Wintz, "Digital ImageProcessing", Addision–WeselyPublishingcompany, (2002).
[5]
A. K .Jain, M. N. Murty, and P. J. Flynn,"Data Clustering Review", ACM ComputingSurvey,3, 31,264, (1999).
[6]
Osama Abu Abbas, "Comparison Between Data Clustering Algorithms ", InternationalArabJournal of Information TechnologyVol(5), No.(3), (2008).
[7]
Jassim T. Sarsoh, and Kadhem M. Hashem, "Clsutering of Human Face Image withDifferentRotation Angles",Thi-Qar Journal, Vol.(3), No.(3), (2007).
[8]
W. Niblack"An introduction to Digital Image Processing ",Strandbers publishingcompanyBinkeroadDenmark, Prentice Hall Inc. (1987).
[9]
S. Hussien Al-janabi" The use of soft computing to classify objects for Airphotosatellite image", M.SC. thesis, university of Babylon , (2005).
[10]
B. Sanghamitra , and M. Ujjwal"Genetic Clustering For AutomaticEvolution of[11]
G. Nizar ,C. Michel , and B. Nazha" Unsupervised and Semi –Supervised Clustering : A Brief survey " ,France,October, (2004).[12]
M. Adanson"Histoire naturelle du Sènègal" ,coquillages , avec la relationabrègèe d'un voyagefait dance pays de 1749 ă 1753 , Bauche , paris, (1757)
[13]
R. sokal and P.H.A. Sneath" principles of numerical taxonomy ", san Francisco, W. H. Freemanand Co., (1963) .
[14]
J. I .Tou and R.C .Gonzalez " pattern Recognition principles " , Addison – Wesley,Massachusetts, (1974) .
[15]
S. Ray , R. H. Turi" Determination of number of clusters in K-mean clustering andApplication In color Image Segmentation ", proceeding of the4th International Conferenceon Advances In pattern Recognition and DigitalTechniques, (ICAPRDT,99), Calcutta, 137,(1999).
[16]
A. K. Jain , M. N. Murty and P. J. Flynn " Data clustering " , A review , ACM computing Survey, 3, 31, 264, (1999)
[19]
K. Ahmad " Genetic Clustering For Image segmentation ", M. SC. thesis , Babylon University,(2002).
[18]
R. V. Jarvis, E. W. partrick" Clustering using a similarity measure basedon sharednear neighbors" , IEEE ,Tran . Computer, Vol. C-22, no. 11 ,pp 1025-1034 (1973)..
[19]
R. M. CORMACK " A review of classification",J.Royal. Statist Soc., SerieA, No. 134,par2 , pp 321 -367, (1971).
[20]
J. Mac Qveen" Some methods for classification and analysis of multivariate observations", 5th Berkely symposium of mathematical statistics and probability , Vol. 1,No.1,Berkely University of California press,(1967)
[21]
Jain A. K., Murty M. N., and Flyun P. J., “Data Clustering: A Review”, ACM, Computing Surveys, Vol.31, No.31, 1995.[22]
Ian. T. Young , Jan J.gerbards , and Lucas J.VanVliet" Fundemantalofimage processing",Netherlands at Delft university of technology , Ver. 2.2 ,ISBN 90-75691-01-7 , (1998).
[24]
Z. Chen "Clustering with k-nearest neighbor threshold of edge detection", 4oI. J. C. P. R , Kyoto,(1978)[25]
J. F. O'CALLAGHAN "An alternative definition for neighborhood of a point" , IEEE . Trans.Computer , Vol. C-24, (1975).