TABLE OF CONTENTS: Vol. 39, No. 6, November 1966 ARTICLES
Grazing Systems and Effects of Grazing 482
486
491
496
500
505
509
513
514
518
C&e Responses <& Continuous aid Seasonal Grazing of California Annual Grassland by Raymond D. Ratliff
Effects of Season and Stage of Rotation Cycle on Hydrologic Condition of Rangeland under Intensive Rotation Grazing by S.D. Warren, W.H. Blackburn, and C.A. Taylor, Jr.
The Influence of Livestock Trampling under Intensive Rotation Grazing on Soil Hydrologic Characteristics by S.D. Warren, T.L. Thurow, W.H. Blackburn, and N.E. Garza
Disappearance of Forage under Short Duration and Seasonlong Grazing by Donald R. Kirby, Mark F. Pessin, and Gary K. Clambey
Soil Hydrologic Response to Number of Pastures and Stocking Density under Intensive Rotation Grazing by SD. Warren, W.H. Blackburn, and C.A. Taylor, Jr.
Hydrologic Characteristics of Vegetation Types as Affected by Livestock Grazing Systems, Edwards Plateau, Texas by T.L. Thurow, W.H. Blackburn, and CA. Taylor, Jr.
Botanical Composition and Diet Quality of Cattle under a Short Duration Grazing System by Donald R. Kirby and Mark Parman
Effect of Time of Grazing in First Crop Year on Subsequent Productivity of Russian Wildrye by N.W. Holt, T. Lawrence, and M.R. Kilcher
Vegetal Change in the Absence of Livestock Grazing, Mountain Brush Zone, Utah by Dennis D. Austin, Philip J. Urness, and Robert A. Riggs
Effect of Season and Regrazing on Diet Quality of Burned Florida Range by K.R. Long, R.S. Kalmbacher, and F.G. Martin
Forage Quality and Production and Animal Nutrition
521 Nutritive Quality of Ceanothus Shrubs in California Mixed Conifer Forest by John G. Kie
527 Nutrition of Sheep Grazing Crested Wheatgrass Versus Crested Wheatgrass-Shrub Pastures during Winter by A.E. Gade and F.D. Provenza
531 Nitrate Reductase Activity of Kleingrass (Panicum coloratum L.) during Drought in the Northern Chihuahuan Desert by Ian M. Ray and William B. Sisson
536 Herbage Production Following Litter Removal on Alberta Native Grasslands by W .D. Willms, S. Smoliak, and A.W. Bailey
Plant Establishment and Revegetation
540 Establishment of Range Grasses on Various Seedbeds at Creosotebush [Larrea triden- tata] Sites in Arizona, U.S.A., and Chihuahua, Mexico by Jerry R. Cox, Martha H. Martin-R., Fernando A. Ibarra-F., and Howard L. Morton
547 Effect of Herbicides and Handweeding on Establishment of Kleingrass and Buffelgrass by B. W. Bovey, R.E. Meyer, and M.G. Merkle, and E.C. Bashaw
552 Enhancing Germination of Spiny Hackberry Seeds by Timothy E. Fulbright, Kay S. Flenniken, and Gary L. Waggerman
Published bimonthly-January, March, May, July, Gullies
September, November
558
Gully Migration on II Southwest Rangeland Watershed by H.B. Osborn and J.R.Simanton Copyright 1966 by the Society for Range Manage-
ment
Range Condition
561 Determining Range Condition from Frequency Data in Mountain Meadows of Central INDIVIDUAL SUBSCRIPTION IS by membership in Idaho by Jeffrey C. Mosley, Stephen C. Bunting, and M. Hironaka
the Society for Range Management.
LIBRARY or other INSTITUTIONAL SUBSCRIP-
TIONS on a calendar year basis are $56.00 ior the TECHNICAL NOTES
United States postpaid and $66.00 for other coun- 565 Use of a Metal Detector to Locate Permanent Plots by Jeffrey Weigel and Carlton M. tries, postpard. Payment from outside the United Britton
States should be remitted in US dollars by rnterna- tional money order or draft on a New York bank.
BUSINESS CORRESPONDENCE, concermng sub- BOOK REVIEWS
scriptions, advertisrng. reprints, back issues, and 566 Flora of the Great Plains. Coordinator Ronald L. McGregor; Ecosystems of the World, related matters. should be addressed to the Manao- Hot Deserts and Arid Shrublands. Editors, M. Evenari, I. Noy-Meir, and D.W. ing Editor, 2760 West Fifth Avenue, Denver, Colo. Goodall; Improvement of Desert Ranges in Soviet Central Asia. Editor, Nina T.
60204. Nechaeva; Game Harvest Management. Editors, Samuel L. Beasom and Sheila F.
ED~TOR~ALCORRESPONDENCE.~~~~~~~I~~~~~~- Roberson
scripts orothereditorial matters, should be addressed to the Editor, 2760 West Fifth Avenue, Denver, Colo.
60204. MISCELLANEOUS
INSTRUCTIONS FOR AUTHORS appear on the 495
Student Papers at 1987 Annual Meeting
inside back Cover
of each issue. A
Style Manual isalso available from the Society for Range Manage
504 International Rangeland congress Information
ment at the above address @$I 25 for single copies: 512
Announcement Deadline Schedule for 1987
$1.00 each for 2 or more.THE JOURNAL OF RANGE MANAGEMENT (ISSN 568 Index* ““grne 39 0022-409X) iS published Six times yearly for $56.60
per year by the Sooety for Range Management,
574 Table of Contents, ~~~~~~ 39 2760 West Fifth Avenue, Denver, Colo 80204.
SECOND CLASS POSTAGE paid at Denver, Colo. POSTMASTER: Return entlre Journal wlth address change-RETURN POSTAGE GUARANTEED-to Society for Range Management, 2760 West Fifth Avenue, Denver, Colo. 60204.
The Journal of Range Management serves as a forum for the presentation and discussion of facts, ideas, and philosophies pertaining to the study, management, and use of range- lands and their several resources. Accord- ingly. all material published herein is signed and reflects the individual views of the authors and is not necessarily an official position of the Society. Manuscripts from any source- nonmembers as well as members-are wel- come and will be given every consideration by the editors. Submissions need not be of a technical nature, but should be germane to the broad field of range management. Editor- ial comment by an individual is also welcome and subject to acceptance by the editor, will be published as a “Viewpoint.”
Managlng Edltor Ed&or Book Revlaw Edltor
PETER V JACKSON Ill PATRICIA G. SMITH GRANT A HARRIS
2760 West Fifth Avenue Society for Range Management Forestry and Range Management Denver, Colorado 60204 2768 West Fifth Avenue Washmgton State Unlverslty
Denver, Colorado 60204 Pullman, Washrngton 99164-6410
ASSOCIATE EDITORS E TOM BARTLETT
Dept. of Range Scrence Colorado State Unrversity Fort Collrns. Colorado 80523
LYMAN MCDONALD Statrshcs Department
College of Commerce and Industry Unrversrty of Wyomrng
Laramre. Wyomrng 82071 G. FRED GIFFORD
Dept of Range Wrldlife. and Forestry Universrty of Nevada
Rena. Nev. 89506
HOWARD MORTON 2000 E Allen Road Tucson, Arizona 85719
THOMAS A. HANLEY forestry Sciences Lab. Box 909
ROBERT MURRAY
US Sheep Expenment Statron Dubors. Idaho 83423
Juneau, Alaska 99802 DARRELL UECKERT
RICHARD H HART USDA-ARS 8408 Hildreth Rd. Cheyenne, Wyoming 82009
Texas Agncultural Experiment Statron 7887 N. Hrghway 87
San Angelo, Texas 76901
LARRY M WHITE N. THOMPSON HOBBS
Colorado Div. of Wildlife 317 W. Prospect
Fort Collins, Colorado 80526
W.K LAUENROTH
Department of Range Scrence Colorado State University Fort Collins, Colorado 80523
USDA ARS
S. Plarns Range Research Statron 2000 18th St
Woodward. Oklahoma 73801
JAMES YOUNG USDA ARS
Cattle Responses to Continuous and Seasonal Grazing of
California Annual Grassland
RAYMOND D. RATLIFF
Abstract
An 8-year (1961-1968) study at the San Joaquin Experimental Range, in the Sierra Nevada foothills in central California, com- pared continuous, repeated seasonal, and rotated seasonal grazing on native range, and continuous grazing on sulfur-fertilized range. Cow and calf weight responses showed continuous grazing of annual grassland range to be most productive for cow-calfproduc- tion. At birth, no advantage of one grazing treatment over another was found among calf weights. At the start of the adequate green forage season, calves under both continuous grazing treatments (native and fertilized) averaged 15 kg heavier than calves under rotated seasonal grazing; calves on continuously grazed fertilized range averaged 12 kg heavier than calves under repeated seasonal grazing. At weaning, calves under continuous grazing treatments averaged 25 kg heavier than calves under seasonal grazing treat- ments. No advantage of one grazing treatment over another was found amona mature cow weiahts.
Overstocking their rangeland was the reason Abram and Lot parted ways (Genesis 132-l 1). The concept of periodically resting the land was set forth by Moses (Exodus 23: IO-1 I, Leviticus 25: l- 7). Centuries later specialized grazing management or grazing systems (Range Term Glossary Committee 1974) were set forth to maintain and improve rangeland.
Most current grazing systems are designed for managing peren- nial grasslands. Their purpose is to improve range condition through better livestock distribution, improved plant vigor, greater seed production and seedling establishment, and breaks in habitual
residue amounts and cow reproductive performance are also discussed.
Methods Experimental Area
The San Joaquin Experimental Range occupies about 1,862 ha of annual grass-oak woodland in the Sierra Nevada foothills. Elevations range from 213 to 5 18 m. Winters are relatively cool and wet. Summers are hot and dry.
Average (1934 to 1978) annual precipitation is 48.3 cm. December, January, and February are the wettest months with 8.6,8.3, and 8.6 cm, respectively. July and August are the driest months with 2.5 mm. January is the coldest month with maximum and minimum temperatures averaging 11.8’ C and 0.7O C, respectively. July is the hottest month with maximum and minimum temperatures avera- ing 36.7” C and 16.2“ C, respectively.
Weather produces 3 characteristic forage seasons (Bentley and Talbot 195 1). The “inadequate green” season begins after fall rains stimulate seed germination. During that forage season, environ- mental conditions usually limit plant growth. As a result, green forage is not of sufficient volume for cattle needs. Protein and energy supplements are usually necessary. The “adequate green” season begins in January or February when major grass species are 5 to 8 cm high. During that forage season, growth so accelerates that livestock cannot use all the herbage produced. The “dry” season begins when soil water becomes depleted in May or June. The annual plants produce seed and die. If it has cured well, dry use patterns.
Such grazing systems may be of little value in managing annual season herdage rniy supply cattle with adequate protein and grasslands. Annual plants grow, produce seed, and die in a single
energy for several weeks
year. They need not accumulate food reserves or maintain vigor. Nevertheless, annual plants do respond to factors of seed germina- tion and seedling establishment. And grazing management can affect annual grassland species composition, herbage yield, and livestock production.
Can better cow and calf production be obtained on annual grassland under continuous yearling grazing or under some form of grazing system? Cows kept all year in a single range unit at the San Joaquin Experimental Range, Madera County, California, had lower pregnancy and weaning percentages than cows moved to ungrazed units in August (Wagnon et al. 1959). Both groups received supplemental feeding. A third group of cows (moved but unsupplemented) had fewer stillbirths and otherwise did as well as the cows not moved. Interpreting responses of the cows not moved was, however, complicated by possible and unusual trace-element deficiencies. Their responses, therefore, were not attributed solely to grazing the same range unit yearlong. The question remained.
This paper reports cow and calf weight responses from an 8-year (1961-1968) study intended to answer that question. Herbage
Grazing Treatments
Historically, factors such as family tradition, ranch size, and available alternate forage have determined local practices. About half the operators (usually the larger ones) practiced a form of seasonal grazing. Cattle were taken to the higher mountains during the dry forage season. The home ranch was grazed continuously during the inadequate and adequate green forage seasons. Year- long grazing, with some attempts at rotation, was the usual prac- tice of small and part-time operators (Voorhies et al. 1942). Practi- ces have changed little over the years.
This study compared continuous, repeated seasonal, and rotated seasonal grazing of native (unfertilized) range and continuous grazing of fertilized range. Elemental sulfur at 67 kg/ ha was ap- plied to fertilized areas every third year.
Under continuous grazing, cattle have access to all of their range all year. In this paper, the continuous grazing treatments are abbreviated to “‘cant-N” and “cant-F” for continuous grazing of native and fertilized range, respectively.
Under repeated seasonal grazing, cattle are on annual grassland - -
Author is range scientist, Pacific Southwest Forest and Range Experiment Station, range yearlong, but graze specifically restricted portions of their Forest Service, U.S. Department of Agriculture, 2081 E. Sierra Ave., Fresno, Calif.
93710.
range during given forage seasons each year. Repeated seasonal
Many people were involved in this research. Specific recognition and thanks are due grazing was studied by Wagnon et al. (1959) and Heady and Pitt to: Stanley L. Anderson (range technician/herdsman), James L. Burns (maintenance (1979). Heady (1961) rotated the time (early, mid, late) of grazing foreman), C. Eugene Conrad (range scientist), Don A. Duncan (range scientist/pro-
ject leader), Robert Flournoy (rancher/cooperator, Likely, California), Charles A. during the growing season, but opened all areas to grazing during Graham (range scientist/superintendent), C. Dick Hansen (rancher/cooperator, the dry and inadequate green forage seasons.
Biola, California), Merton J. Reed (range scientist/project leader), Jack N. Reppert
(range scientist), Stanley E. Westfall (range technician), and E. Joseph Woolfolk Under rotated seasonal grazing, cattle are on annual grassland (division chief/assistant director). range yearlong but graze specifically restricted portions of their Manuscript accepted 10 April 1986. range rotationally. The forage season of grazing is rotated among
different portions of the range each year.
More efficient cattle production and better herbage production occur with moderate grazing than with close grazing on annual grassland (Bentley and Talbot 1951). Moderate grazing was there- fore planned under all treatments.
Range Units
Swale, open-rolling, and rocky-brushy range site classes at the San Joaquin Experimental Range are described by Bentley and Talbot (1951) and Gaylord (1972). Productivity varies with site. Herbage production was therefore monitored for 2 years to deter- mine and equalize grazing capacities.
The 4 treatments were then randomly assigned to 2 replications (blocks) of range units. One block of range units had about 26% open-rolling sites and 74% rocky-brushy sites. The other block of range units had about 89% rocky-brushy sites and 11% open- rolling sites. The 8 range units average 91 ha in size. Range units assigned seasonal treatments were partitioned into 3 subunits for grazing in the 3 forage seasons.
Supplemental Feeding
To properly maintain their animals, ranchers in the area sup- plement dry and/or inadequate green herbage (Voorhies et al. 1942). Therefore, when quality herbage was in short supply, 4.5 kg/ head/ day of high quality alfalfa (Medicago saliva) hay was fed in all treatments. Iodized salt was provided in the last half of the gestation to prevent goiter in new-born calves. Block salt was provided as needed.
The Cattle
A select herd of 99 yearling Hereford heifers was brought to the San Joaquin Experimental Range in April 1959. All were of good- to-choice feeder grades, weighed 204 to 227 kg, and were raised together. In November and December 1960, they had their first calves (Duncan and Reed 1973). In January 1961, balanced weight groups of 8 cows with calves were formed from the herd. The groups were randomly and permanently assigned to treatments and range units. The cows in the groups were called “testers.“Their responses and those of their calves provided the measure of treat- ment effects. Other cows were put into and taken out of range units as needed to assure moderate use.
The breeding program was designed so that cows under all treatments would calve from late October to early December. Testers were culled if they twice failed to conceive and/ or wean a calf, were sick for a protracted period, or, of course, died. To maintain a basic herd of 8 cows, culled testers were replaced.
At the change of forage seasons, cows were individually weighed following an overnight shrink. Calves were weighed within 24 hours of birth, when their dams were weighed, and at weaning. Herbage Production and Residue
Herbage production by treatment was 3,100 kg/ ha under cont- F, 2,390 kg/ ha under cant-N, 2,240 kg/ ha under repeated sea- sonal, and 2,460 kg/ ha under rotated seasonal grazing (Caldwell et al. 1985; Caldwell, Menke and Duncan, unpublished manuscript).
At the start of the inadequate green forage season, 897 to 1,121 kg/ha of herbage residue was to remain in continuously grazed range units and subunits grazed in the adequate green and dry forage seasons. Estimates of herbage residues were made along random, permanent transects, and sampling was proportional to the amount of a site class in a range unit. The overall average therefore estimated amounts left in the range unit or subunit. Residual herbage on subunits grazed in the inadequate green for- age season was assumed to equal the herbage production.
Analysis of Data
Differences in cattle responses among grazing treatments were of primary interest. Owing to variation in the quantity and quality of forage, variation in cattle responses from year to year was expected. Therefore, mature cow weights (at weaning in 1964) and average calf weights (over the 8 years) expressed long-term
responses to treatment. The analysis of variance model to estimate differences between treatments was a randomized complete-block design, with 1 observation per cell. Calf weights analyzed were those at birth, at the start of the adequate green forage season, and at the start of the dry forage season (the usual weaning time). Mature cow weights were analyzed using their initial weights at the start of the study as a covariate. Determining 95% confidence intervals for pairwise differences among treatment means was by Tukey’s “w-procedure” (Steel and Torrie 1960). In th& paper, differences between treatments are expressed as (Xl - X2) f w, where w q Q (SE). Q comes from tables for the number of means compared and error degrees of freedom.
Results Variation in the Green Forage Season
Starting dates for the adequate green forage season (Table 1) varied from 12 January to 20 February. On the average, they were similar to those reported for the experimental range by Bentley and Talbot (1951).
Table 1. Adequate green forage season at the San Joaquin Experimental Range, Madera County, Caiifomia (l%l-1968).
Year 1961 1962 1963 1964 1965 1966 1967 1968 Average
Dates Length
Start End (days)
Feb. 9 May 31 111
Feb. 20 June 19 119
Feb. 8 July 11 153
Jan. 15 June 18 155
Jan. 12 July 13 182
Feb. 15 May 24 98
Jan. 12 Aug. 4 204
Feb. 7 May 24 107
Feb. 1 June 22 141
Based on past ending dates (Bentley and Talbot 1951), the adequate green forage seasons in 1963,1965, and 1967 ended later than usual. Those were 3 of 6 years from 1935 to 1978 in which April and May precipitation exceeded 10 cm and April, May, and June average maximum temperatures were below average. Late spring rains and low temperatures delayed the dry forage season.
Grazing Use and Herbage Residue
Based on the production estimates given earlier and leaving 1,121 kg/haofresidue,grazingpotentialswere 1.1,1.8,1.2,and 1.0 AUM/ha under cant-N, cant-F, rotated seasonal, and repeated seasonal grazing, respectively. Actual use by treatment was 1.1,
1.5, 0.8, and 0.7 AUM/ ha, respectively.
Differences among years in residual herbage amounts relate to
Table 2. Estimated plant residue prior to fall germination by grazing treatment at the San Joaquin Experimental Range, Madm County, Catifomh (1961-1967).
Grazing treatments
Continuous Seasonal*
Year Native Fertilized* Rotated Repeated Average -Kilograms per hectare--
1961 701 805 495 441 610
1962 432 459 414 440 436
1963 984 1132 833 887 959
1964 1542 1478 1301 1245 1392
1965 1340 2282 1490 1201 1578
1966 1124 1226 1391 1169 1228
1967 1997 2786 2072 1900 2189
Average 1160 1452 1142 1040 1199
‘Residue in the inadequate ~Fcrtilizcd with mineral
reen forage season subunits was not included. sul % ur every third year.
production and stocking. Average residue amounts range from 7% less to 30% more than planned (Table 2). Over all 7 years and all grazing treatments (excluding inadequate green forage season subunits), 7% more remained than planned. The lowest amount (-63%) occurred under rotated seasonal grazing in 1962. The high- est amount (+148%) occurred under cent-F in 1967.
Residual herbage has little nutritional value after being leached by rain, and leaving an excess amount wastes resources. Under cant-N residual herbage averaged 39 kg/ ha more than planned. Under cant-F an excess of 331 kg/ ha remained. With additional cattle, another 0.3 AUM/ha/yr could have been obtained under the treatment. Including the inadequate green forage season sub- units, residual amounts were 1,440 kg/ ha (3 19 kg/ ha extra) under repeated seasonal grazing and 158 1 kg/ ha (460 kg/ ha extra) under rotated seasonal grazing. Until the inadequate green forage season, a third of the production (one subunit) could not be used. It represents a loss of 0.3 AUM/ ha/ yr under repeated seasonal graz- ing and 0.4 AUM/ ha/ yr under rotated seasonal grazing.
Grazing use could probably have been heavier under all treat- ments during 1964, 1965, 1966, and 1967. Clawson et al. (1982) reported that 448 to 785 kg/ ha of residual herbage (moderate use) produces the best cattle production on land like the San Joaquin Experimental Range. They also suggested minimum residual amounts of 448 kg/ ha for lower or flat slopes, 672 kg/ ha for average-gentle slopes, and 897 kg/ ha for upper or steep slopes. Over the years studied, therefore, any difference among grazing treatments in residual herbage levels should have had minimal influence on cow and calf weight responses.
Relative contributions of plant species to the herbage produced may change, however, due to treatment. Moreover, differences in cow and calf responses may reflect such changes. Plant species responses to cant-N, cant-F, and the seasonal grazing treatments have been discussed (Caldwell et al. 1985; Caldwell, Menke and Duncan, unpublished manuscript).
Calf Response
Over all years and treatments, calf birth weights at the San Joaquin Experimental Range (Table 3) averaged 3 1 .O f 0.8 kg. At
Table 3; Calf birth weights, weights at the start of the adquate green and dry forage seasons, and rates of pin during the adequate green forage season (over all treatments) by crop year at the San Joaquin Experimen-
tal Range, Madera County, California.
Year
1961 1962 1963 1964 1965 1966 1967 1968 Average
Birth -_-
28.1’ 28.3 30.8 31.8 31.5 31.1
31.2 30.4 31.0
Calf weights Green season
Green season Dry season gain per day -Kilograms-_--_---
82.9’ 176.3 0.84
96.4 201.0 0.87
99.1 233.4 0.87
87.3 214.6 0.81
90.0 244.7 0.85
106. I 219.3 1.15
83.2 252.0 0.82
95.2 189.8 0.88
94.8 217.8 0.89
‘For reader information; not used in analyses.
the start of adequate green forage, calves averaged 94.8 f 2.8 kg. At weaning, the average calf weight was 217.8 f 4.3 kg.
Calf weights at the start of the adequate green forage season reflect their ages more than inadequate green season forage qual- ity. The calves were younger and weighed 90 kg or less when the adequate green forage season started in January. The calves were older and weighed over 90 kg when it started in February.
Variation in its length accounted for 90% (R = 0.95) of the variation in calf weight gains (Table 3) during the adequate green forage season. The longer that calves were on the range, the greater their final weights. Calf gains also reflected forage quality. Though
the 1966 season was short (98 days), the adequate green forage was of high quality. Calves gains 1.2 kg per day that season, 0.27 kgper day more than in any other year.
Larger calves are commonly asserted to have greater vitality at birth and to be larger at weaning than smaller calves. For calf birth weights (Table 4), the 95% confidence interval for the difference
Table 4. Calf birth weights and weights at the start of the adequate green and dry forage seasons by grazing treatment at the San Jorquin Experi- mental Range, Madera County, California.
Grazing treatment Birth
Calf weights’
Green season Dry season
_-_-- Kilograms---
Continuous
Native 31.9a 100.4ab 229.Oa
Fertilized2 31.9a lOIS& 227.8a
Seasonal
Repeated 29.5a 88.6bc 205.2b
Rotated 29.7a 86.2c 202.2b
Tukey’s “w” 3.3 12.2 18.6
‘Within columns, treatment means followed by the same letter are not statistically different (KO.05).
*Fertilized with mineral sulfur every third year.
between the continuous grazing treatments and repeated seasonal grazing was 2.4 f 3.3 kg. The true difference is, therefore, between an advantage of 0.9 kg for repeated seasonal grazing and an advantage of 5.7 kg for continuous grazing. At those extremes, an advantage for repeated seasonal grazing would little affect future calf response, but an advantage for continuous grazing could affect future calf response.
Continued supplementation after parturition should tend to reduce treatment differences in calf weights. Nevertheless, at the start of the adequate green forage season, calves under continuous grazing weighed more than calves under seasonal grazing (Table 4). Calves were 14.2 f 12.2 kg heavier under cant-N and 14.8 f 12.2 kg heavier under cant-F than calves under rotated seasonal grazing. Also, calves under cant-F were 12.4 f 12.2 kg heavier than calves under repeated seasonal grazing.
Treatment differences were amplified during the adequate green forage season. At the start of the dry forage season (the usual weaning time), calves under continuous grazing (Table 4) averaged 25 kg heavier than calves under seasonal grazing. Between cant-N and repeated and rotated seasonal grazing, the differences were 23.8 f 18.6 kg and 26.8 f 18.6 kg, respectively. Between cent-F and repeated and rotated seasonal grazing, the differences were 22.6 f 18.6 kg and 25.6 f 18.6 kg, respectively.
Similar results were reported by Duncan and Reed (1973). And continuous grazing gave better lamb weights and ewe performance than seasonal grazing of annual grassland (Heady 1961, Heady and Pitt 1979).
Cows under continuous grazing had the entire range unit for selecting forage. Those under seasonal grazing had one-third as much area. Consequently, although all cows received equal rations of hay, cows under continuous grazing had greater opportunity, after calving, to select dietsconducive to high lactation rates. That may explain the heavier calves under continuous grazing at the start of the adequate green forage season.
Stocking rate differences during the adequate green forage sea- son explain part of the difference in weaning weights between continuous and seasonal grazing treatments. Average stocking rates for cent-N and cant-F units were 2.3 and 1.9 ha/AUM, respectively. Average stocking rates for rotated and repeated sea- sonal subunits were 0.8 and 0.9 ha/AUM, respectively. Cows and calves under continuous grazing did not have to graze as closely as cows and calves under seasonal grazing. As a result, cows and calves under continuous grazing could be more selective in choos-
Table 5. Starting and mature tester cow weights and 95% confidence intervals for the man cow weights at the start of the dry forage eeason (1961-1968) on the San Joaquin Experimental Range, Madera County, California.
Grazing treatment
Starting weight
Mature weight’
Confidence Interval2
Continuous Native Fertilized* Seasonal
_- Kilograms---
331.6 503.5a3 471.3 f 34.2 339.7 518.7a 492.8 f 36.0
Repeated 326.3 464.9a 441.3 f 24.1
Rotated 336.8 459.4a 437.1 f 21.1
Average 333.6 486.6
Tuckey’s “w” 146.4
‘At weaninn of calves (18 June 19641 and adiusted for covariate effects of startinn
‘Within column, values followed by the same letter are not statistically different (KO.05).
*Fertilized with mineral sulfur every third year.
ing their diet (at least toward the end of the adequate green forage season).
For cow-calf operators dependent yearlong on annual grassland of the Sierra Nevada foothills, continuous grazing should be more productive than seasonal grazing. That conclusion is consistent with previous findings of livestock responses on annual grassland range. To maintain productivity of the resource base, stocking to obtain moderate use is recommended.
At the San Joaquin Experimental Range, calves on range grazed continuously were heavier at weaning than calves on range divided into seasonal units grazed repeatedly or in rotation. At a market price of $1.36/kg, (based on the 95% confidence interval), the return per calf under continuous grazing on native range would be between $11.15 and $61.74 more than per calf under rotated sea- sonal grazing. Whether differences of those sizes will induce cow- calf operators to change from seasonal to continuous grazing depends on cost-return relationships.
Cow Responses Literature Cited
Weights of original tester cows that weaned calves in 1964 were used to estimate grazing treatment effects on the cows. Cow weights (taken on a specific date) summarize all influences from the start of the study. By 1965, many of the original testers in some range units had been replaced. Because their histories and those of the testers differed, replacement cow weights could not be used’to reflect long-term treatment effects. Weights of all cows (replace- ments as well as testers) were used by Duncan and Reed (1973). The weights they reported therefore differ from those given here.
Rentley, J.R., and M.W. Telbot. 1951. Efficient use of annual plants on cattle ranges in the California foothills. USDA, Washington, D.C. Circ. No. 870.
The 95% confidence interval for the difference in weights of mature cows (Table 5) under cent-F and those under rotated seasonal grazing, was 59.3 f 146.4 kg. The true difference is, therefore, somewhere between an advantage of 87.1 kg for rotated seasonal grazing and an advantage of 205.7 kg for cant-F. Confi- dence intervals for other continuous and seasonal grazing compar- isons may be similarly interpreted.
Caldwell, R.M., J.W. Menke, and D.A. Duncan. 1985. Effects of sulfur fertilization on productivity and botanical composition of California annual grassland. J. Range Manage. 38:108-l 13.
Clawson, J.W., N.K. McDoupld, end D.A. Duncan. 1982. Guidelines for residue management on annual range. Cooperative Extension, Div. of Agr. Sci., Univ. Calif., Berkeley. Leafl. 21327.
Duncan, D.A., and M.J. Reed. 1973. Yearlong tops seasonal grazing in extended rangeland study. West. Livest. J. (Mt. Plains&Southwest Ed.) 51:3248.
Gaylord, V.J. 1972. A method for the correlation of range sites with land association classes in the Sierra foothills. M.S. Thesis, California State Univ., Fresno.
Ranchers commonly accept the premise that large cows produce large calves. Continuous grazing produced larger calves than sea- sonal grazing. Any true difference in cow weights is, therefore, likely an advantage for continuous grazing.
Fewer heifers may need be retained annually under rotated seasonal grazing. Over all years and grazing treatments, 34 (7.1% per year) of the original 64 cows were replaced. By treatment, replacements were 63% (cant-N), 56% (cant-F), 63% (repeated seasonal), and 31% (rotated seasonal). For all treatments, except rotated seasonal, 1 or more replacement cows were replaced.
Heady, H.F. 1961. Continous vs. specialized grazing systems: A review and application to the California annual type. J. Range Manage. 14: 182-193. Heady, H.F., and M.D. Pitt. 1979. Seasonal versus continuous grazing on
annual vegetation of northern California. Rangelands 1:231-232. Range Term Glossary Committee. 1974. A glossary of terms used in range
management. 2nd ed. Sot. for Range Manage. Denver, Colo. Steel, R&D., and J.H. Torrie. 1960. Principles and procedures of statis-
tics. McGraw-Hill, Inc., New York.
Voorhies, E.C., L.A. Crawford, R.L. Adams, and G.A. Carpenter. 1942. Ranch organization and management in the granite area. p. 83-95. In: C.B. Hutchison and E.I. Kotok (eds.), The San Joaquin Eiperimental Range. Univ. Calif., Berkeley. Bull. 663.
Wagnk, K.A., H.R. Guilbert;and G.H. Hart. 1959. Beef cattle investiga- tions on the San Joaquin Experimental Range. California Agr. Exp. Sta. Bull. 765.
The overall weaning rate was 0.88 calf/cow. Average weaning rates were 0.85 (cant-N), 0.87 (repeated seasonal), 0.90 (cent-F), and 0.90 (rotated seasonal).
The overall conception rate was 0.95 calf/cow. Conception by treatment averaged 0.91 (cant-N), 0.95 (repeated and rotated sea- sonal), and 0.98 (con-F). The overall weaning rate per pregnant cows was 0.93 calf/cow. Average weaning rates were 0.91 (repeated seasonal), 0.92 (cant-F), 0.94 (cant-N), and 0.95 (rotated seasonal).
Conclusions
Effects of Season and Stage of Rotation Cycle on Hydrologic
Condition of Rangeland Under Intensive Rotation Grazing
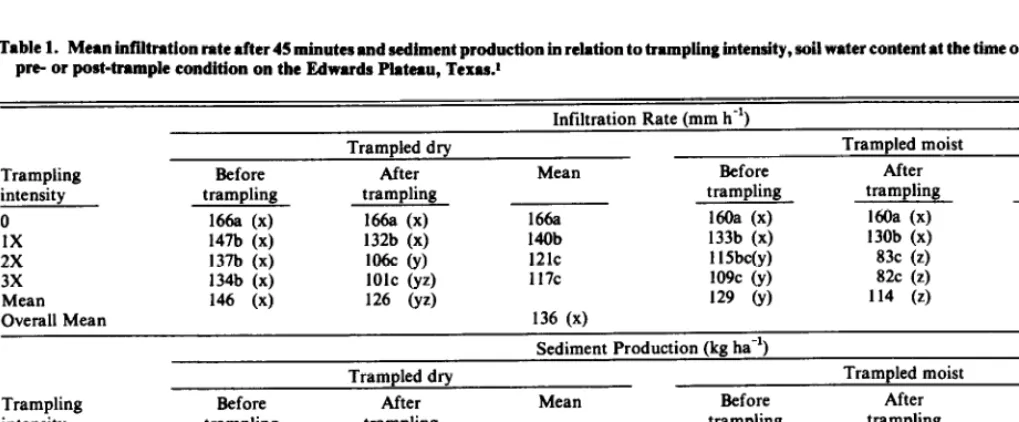
S.D. WARREN, W.H. BLACKBURN, AND C.A. TAYLOR, JR.Infdtration rate and sediment production were measured over a 2-year period on an intensive rotationally grazed pasture. Mea- surements were taken prior to the movement of livestock onto the pasture, soon after their removal, and approximately midway through the subsequent rest period of each rotation through the system. Midgrass-dominated interspaces were characterized by significantly higher htfiltrrtion rates and lower sediment produc- tion than shortgrassdomhtated interspaces. Wiltration rate declined and sediment production increased following the short-term hrtense grazing periods inherent in the rotational system. The detrimental effect was significant during periods of drought or winter dormancy, but not during periods of active growth. Soil characteristics relating to higher hydrologic condition were signifi- cantly more stable durhtg the growing season, providing greater resistance to and resilience from the damaging impact of livestock activity.
Mismanagement of domestic livestock, especially through exces- sive stocking rates, has caused severe degradation of many of the world’s rangelands (Bentley 1898, Box 1967, Dregne 1978). Mod- erate stocking rates which are designed to utilize approximately half of the current year’s forage production are generally accepted as proper grazing management (Stoddard et al. 1975). However, even when “proper” stocking rates are achieved, livestock may selectively overutilize specific areas, certain forage species, or even individual plants. One tool to help prevent such uneven distribu- tion of grazing is the implementation of rotational grazing systems. Additional goals of grazing systems include improvement or main- tenance of the forage resource and increased animal production.
Over the last decade there has been a renewed interest in inten- sive rotation grazing, a concept which originated prior to the 19th century (Voisin 1959). Modern proponents of the system predict that, in addition to improved plant and animal production, the intense livestock activity associated with short-term, high stocking density will increase infiltration of rainfall into the soil and reduce erosion, even at stocking rates which double or triple the conven- tional moderate rates (Goodloe 1969, Savory 1978, Savory and Parsons 1980). Most scientific research with rotational grazing systems has shown that heavy stocking rates decrease infiltration rate and increase sediment production, regardless of the system used (Blackburn 1984, Gamougoun et al. 1984; M&alla et al. 1984a, 1984b; Pearson et al. 1975; Pluhar 1984; Smith 1980; Thurow 1985; Warren et al. 1986c; Weltz 1983). Even at moderate stocking rates, rotational grazing systems have no consistently significant hydrologic advantages over continuous grazing (Black- burn 1984; Blackburn et al. 1980; Knight 1980; Mbakaya 1985;
McGinty et al. 1979; Skovlin et al. 1976; Wood 1980; Wood and Blackburn 1981a, 1981b; Wood et al. 1978).
Although the overall hydrologic impact has been evaluated for many rotational grazing systems, little is understood about the Authors are presently environmental research scientist, USA-CERL, Environmental Division, P.O. Box4005, Champaign, Ill. 61820, professor of watershed management, Department of Range Science, Texas A&M University, College Station 77843, and superintendent, Texas Agricultural Experiment Station, Sonora 76950. At the time of this research the senior author was nraduate research assistant at Texas ABM University.
This study was a cooperative project between U.S. Department of Agriculture and Texas Agricultural Experiment Station. Financial support of the Soil Conservation f+xvice RCA Special Study and a Science/ Education Grant is acknowledged: Pub- $szts;k approval of the Dtrector, Texas Agncultural Expenment Statton as
Manuscript accepted 10 April 1986.
466
mode of action by which the watershed is impacted. The purpose of this investigation was to test the hypothesis of hydrologic improve- ment under intensive rotation grazing in relation to stage of the rotation cycle and seasonal variability.
Study Area
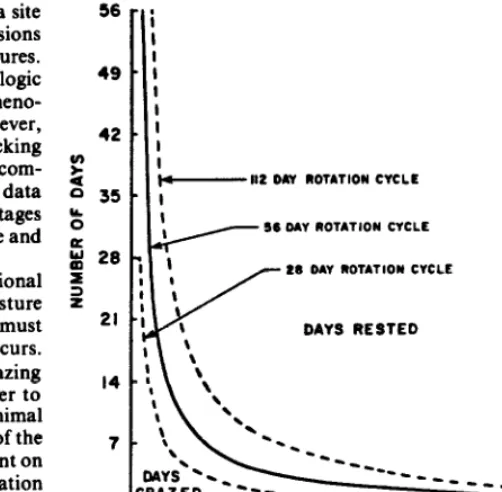
Field research was conducted at the Texas Agricultural Research Station located on the Edwards Plateau near Sonora, Texas. In the fall of 1982, a 376ha, 14pasture intensive rotation grazing system was put into operation at the Station. Pastures ranged in size from 8 to 32 ha. The system was stocked with a single herd composed of a 1.63: 1: 1 ratio of cattle, sheep, and goats at a stocking rate of 8.1 ha/ AU, which is the recommended moderate rate. The number of days of grazing per pasture per rotation cycle was dependent upon the condition of the forage resource within each pasture. During the spring and summer, the average rotation cycle was 56 days but slowed to 74 days during the winter dormant season.
A 32-ha pasture was used for this study. The pasture was in better condition than most others and was grazed at a heavier rate accordingly. During a typical 56day rotational cycle, the pasture was grazed for 8 days, so that it was representative of a 7-pasture intensive rotation grazing system stocked at 4.8 ha/ AU or I .7x the recommended moderate rate. Stocking density while livestock were on the pasture was 0.68 ha/ AU.
The physiognomy of the pasture was characterized by dense, scattered live oak (Qnercus virginiana Mill.) mottes with grass interspaces. The midgrass component of the grass interspaces was dominated by sideoats grama (Bouteloua curtipendula (Michx.)) and Wright’s threeawn (Aristida wrightii Nash). Other important midgrass included fall witchgrass (Leptoloma cognatum (Schult.) Chase), Texas wintergrass (Stipa leucotricha Trin. & Rupr.), and silver bluestem (Bothriochloa saccharoides (Swartz) Rydb.). The shortgrass interspaces were predominantly common curly mes- quite (Hilaria belangeri(Steud.) Nash). Honey mesquite (Prosopis glandulosa Torr.) and ashe juniper (Juniperus ashei Buchholz), 2 woody species, were scattered through the grass interspaces in a Savannah-like fashion. Prickly pear (Opuntia spp. Mill.) was also abundant.
Study sites were located on Kavett silty clay soils with slopes 0% and a depth of 250-500 mm overlying a fractured caliche layer and limestone substratum. The soils were of the clayey- skeletal, montmorillonitic, thermic family of Lithic Haplustolls, characterized by high shrink-swell capacity and high organic mat- ter content. When undisturbed, they were well aggregated and had high rainfall infiltration capacity.
Therefore, dormant season, for purposes of this paper, refers to any extended period of vegetation dormancy, whether induced by cooler temperatures and shorter day length during the winter, or by extended drought, regardless of the time of year.
Methods
Beginning in the fall of 1982 when the intensive rotation grazing system was installed, and continuing until the fall of 1984, pastures were sampled immediately prior to the entry of livestock, soon after their removal, and approximately midway through the sub- sequent rest period of each rotation through the system. Two rotation cycles were omitted due to freezing temperatures which prevented rainfall simulation. Sixteen plots were sampled on each
sample date at sites which were randomly located within the pas- ture. Half of the plots represented midgrass interspaces and half represented shortgrass interspaces.
A mobile, drip-type rainfall simulator (Blackburn et al. 1974) was used to determine infiltration rate and sediment production on variable area runoff plots. Plot size averaged approximately 0.4 mr. In order to reduce variability attributable to antecedent soil water content, the plots were pre-wet by applying 105 area mm of water at a rate of 79 mm h-’ from a mist type nozzle located under a plastic cone 0.6 m above the soil. The plots were then covered with plastic tarps to prevent evaporation, and gravitational water was allowed to drain. After approximately 24 hours, when the soil had drained to near field capacity, simulated rainfall was applied at a rate of 203 mm h-r for 30 minutes. The simulated raindrops were 2.5 mm in diameter. Drops falling 2.1 m reached 5.25 m/set or 7 1% of the terminal velocity achieved by raindrops in an unlimited fall (Laws 1941). This application rate simulated a storm witha return period of about 120 years and was necessary to insure runoff from all plots. Runoff from each plot was regularly pumped into tared containers. At five minute intervals the runoff was weighed and mean infiltration rate (mm h-‘) was calculated by determining the difference between applied rainfall and the quantity of water run- ning off the plot. At the end of each simulated rainfall event, runoff from the plot was thoroughly mixed and a l-liter subsample was collected. The subsample was filtered through a tared Whatman #l filter. Sediment remaining on the filter was oven-dried, weighed and converted to sediment production (kg ha-‘) based on the area and total runoff from each plot.
Immediately prior to each simulated rainfall event, soil bulk density and soil moisture content at a depth of O-50 mm were determined adjacent to each runoff plot by the core method (Blake 1965) and gravimetric method (Roundy et al. 1983), respectively. Soil surface microrelief within each plot was measured with a IO-pin relief meter similar to the one described by Kincaid and Williams (1966). Following simulated rainfall, a composite surface soil sample was taken to a depth of 30 mm from within the plot and was used for analyses of soil organic matter content by the Walkley-Black method (Nelson and Sommers 1982) and aggregate stability by the wet-sieved method (Kemper 1965).
Percent aerial cover of midgrasses, shortgrasses, forbs, litter, rock, and bare ground was determined by ocular estimate for each runoff plot. Midgrass, shortgrass, and forb cover were combined to produce a single vegetative cover estimate. Litter cover was added to the vegetative cover total to produce a total organic cover estimate. Following rainfall simulation, grasses and forbs were clipped to a IO-mm stubble height and litter was hand collected from each plot. These samples were oven-dried and weighed. Grass and forb weights were combined to produce a standing crop value, and litter was added to calculate total above-ground herbaceous biomass.
Biomass variables and soil microrelief were highly skewed. Log10 transformations were performed to meet assumptions of normal- ity. Analysis of variance based on a 3 X 2 X 2 factorial design was used to determine if significant differences existed for dependent variables between stages of the rotation cycle (pre-graze, post- graze, mid-rest), seasons (growing, dormant), and grass types (midgrass, shortgrass). The error term in the analysis of variance consisted of the nested variation of the randomized sites within the factorial treatments (Snedecor and Cochran 1971). If differences were present, Duncan’s multiple comparison test was used to separate the means (Steel and Torrie 1980). Simple correlation was computed for all combinations of dependent and independent variables. A significance level of 95% was used throughout.
Results and Discussion
The average growing season at the Station is 240 days and extends from March through October. Precipitation during 1983 (501 mm) was considerably below the long-term (1918-1984) aver-
120
-.- STUDY MONTHLY 105 - - l - - AVERAGE MONTHLY
II
01
I ,,I 1 , , , , / , , , , & , , , , , , , , , ,ND;JFYA’JJASOND:JFHAMJJAS
I
1992 ; 1993 1 1984
Fig. 1. Long-termaveragemonthlyprecipitation (1918-1984)andmonthly precipitation during the study, near Sonora, Texas.
age of 609 mm (Fig. 1). Drought conditions were even more severe the following year, with only 406 mm precipitation, from 10 Janu- ary to 25 July 1984 there were no significant rainfall events (>lO mm). This resulted in a drought-induced extension of the dormant season well into the summer.
Infiltration rate was significantly greater (162 vs. 121 mm h-r) and sediment production significantly less (937 vs. 1,559 kg ha-‘) from plots located in midgrass interspaces than from plots repre- senting shortgrass interspaces. Similar differences in hydrologic response due to grass type have been noted by Knight (1980); McCalla et al. 1984a, 1984b; Pluhar (1984); Thurow (1985); and Wood and Blackburn 1981a, 1981b. There was no significant interaction between grass type and other treatment factors. There- fore, grass types are combined for discussion of seasonal variability and stage of rotation cycle.
Sewonal Variability
Mean infiltration rate was significantly higher and sediment production was significantly lower during the growing season than during priods of dormancy (Fig. 2). Knight (1980), McCalla et al. (1984a), and Thurow (1985), also working at the Sonora station, reported similar seasonal variability for infiltration rate. Standing crop was the only vegetation or cover variable which varied signifi- cantly between seasons; it was greatest during the growing season (Table 1).
Most soil-related variables were significantly different between seasons (Table 1). Soil aggregate stability and soil organic matter were significantly higher and soil bulk density was significantly lower during the growing season, creating a more stable soil hydro- logic condition. Soil aggregate stability and soil organic matter are highly autocorrelated by virtue of the fact that organic matter is a principal constituent in the binding of individual soil particles into soil aggregates. Soil organic matter content, in turn, is largely dependent on microbial decomposition of litter and humus. Soil microbes are most active during the growing season when soil moisture and soil temperature are favorable and litter is abundant. However, microbial activity may be limited by very high tempera- tures and low soil moisture conditions. During the summer drought of 1984, soil temperatures at a depth of 50 mm reached diurnal peaks approaching 37’ C while soil moisture at that depth dropped as low as 2-3s on a dry weight basis. These conditions may have limited microbial activity and probably contributed to
180
160
- GROWING SEASON - -0 - - DORMANT SEASON
I I I I I I
5
IO
I5
20
25
30
TIME
(min .I
GROWING SEASON I
500
1000
1500
2000
SEDIMENT PRODUCTION (kg ha”1
Fig. 2. Mean injiltration rare after 30 minutes and sediment production during the growing and dormant seasons near Sonora, Texas. All means for infiltration rote ot the same rime intervolondfor sediment production
are significantly different (PG-05).
the lower soil organic matter content and aggregate stability during the dormant season.
The degree of aggregation of soil particles is also positively related to soil bulk density. Porosity of the soil is generally enhanced and soil bulk density reduced as the degree of aggrega- tion increases. Soil porosity during the growing season is also increased by the disruptive action of plant roots. In addition, most of the annual precipitation at the Sonora station falls during the growing season (Fig. 1). The shrinking and swelling of the predom- inant montmorillonitic clay soils, in response to wetting and dry- ing, lightens the soil and decreases bulk density.
Vegetation variables were significantly correlated with infiltra- tion rate and sediment production during the growing season and during periods of dormancy (Table 2). Grass and litter may inter- cept a significant portion of incident precipitation (Burgy and Pomeroy 1958, Corbett and Crouse 1968, McMillan and Burgy 1960) and thus reduce the impact of falling raindrops. Raindrops
Table 1. Mean vegetation and soil vwisblea during the growing and dor- mant seasons, near Sonora, Texas.1
Variable Bare ground (%) Litter cover (%) Vegetation cover (%) Total organic cover (%) Standing crop (kg ha-‘) Litter accumulation (kg ha-‘) Total above ground herbaceous
Growing season Dormant season
28.3a 30.3a
20.5a 20.9a
48.6a 46.5a
69.la 67.4a
2311.5a 1967.7b 1242.6s 1205.5a
biomass (kg ha-‘) 3548.9a 3157.1b
Microrelief (unitless) 1.15a l.lla
Soil bulk density (Mg ms) 0.77a 0.8Ob
Soil aggregate stability (%) 76.8a 62.2b Soil organic matter content (%) 6.3a 5.8b ‘Mesus fcllowed by the same letter within a row sre not significantly different (E.05).
Table 2. Simple correlation coefficients of vegetation md soil variables
COded with mean itiltrxtion rate after 30 minutes md sediment production during the groning and dormant seasons, near Sonora, Texls.1
Infiltration rate Sediment production
Independent variables Bare ground Litter cover Vegetation cover Total organic cover Litter accumulation Standing crop Total above ground
Growing Dormant Growing Dormant season season Season season
-.56 -.56 .53 .46
.28 .26 -. 10 NS -.09 NS
.37 .42 -.48 -44
.54 .57 -.52 -.45
.4l 40 -.22 -.19
.54 .47 -.39 -.36
herbaceous biomass .6l .58 -.41 -.36
Microrelief .45 40 -.30 -.19
Soil bulk density -.17 -.36 .04NS .14
Soil aggregate stability .I4 44 -.42 -.32 Soil organic matter content .I3 .26 -.27 -.17 ‘Correlation coefficients followed by NS arc not significant (K.05).
impinging directly on a bare soil surface may dislodge soil particles which may eventually clog soil pores or may be carried away by overland flow (Osborn 1954). Depending on plant morphology, much of the intercepted rainfall may be channeled to the base of the plant (Glover et al. 1962, Gwynne 1966) where plant roots and accumulated litter create a more porous soil characterized by high infiltration rates (Blackburn 1975, Ndawula-Senyimba et al. 1971, Wood and Blackburn 198 la).
Soil variables were also significantly correlated with soil hydro- logic response (Table 2). Soil surface microrelief which results from small natural depressions, plant bases, and litter may slow overland flow, increase infiltration rate, and cause deposition of suspended soil particles. However, infiltration rates in depressions caused by cattle tracks may be severely reduced due to compaction (Kako and Toyoda 1981). Soil bulk density was more closely related to infiltration rate than to sediment production. In addi- tion, the relationship was stronger during the dormant season than during periods of growth. Soil aggregate stability and soil organic matter content were also more strongly correlated with infiltration rate during the dormant season. However, these latter variables were more closely tied to sediment production during the growing season.
Stages of Rotation Cycle
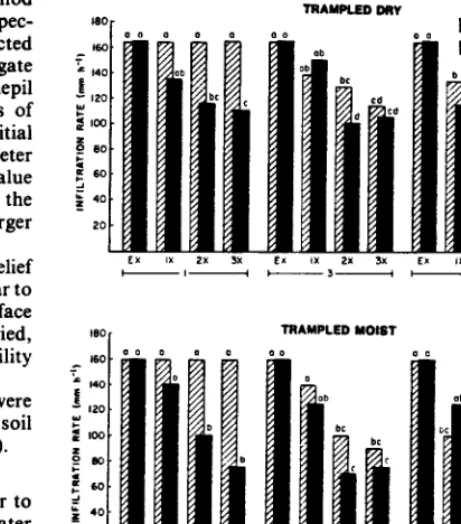
Fluctuations between pre-graze and post-graze hydrologic con- dition were much more pronounced during dormant periods, regardless of the factors inducing the dormancy (Fig. 3). Overall,
3000 c
i5
c
v
a
_ 2000 ;iz ‘;z! Y 1000 EW m
0
W 180
4
1605 z 140
$6 a.5 120 t-
_I
z 100
z
80
I
l PRE - GRAZEI
II l POST-GRAZE
I A MID-REST
/yj/rQ\~
- i‘.<*,q’ / l /O
_
I I
0 I
_
\
I
I\
~-~wm\A,M4’o’m 0
l
, 1 0T\m, ‘\
l
l A
‘1,
l I A \/I
I I
l
_
I I
\ / l I
DORMANTkASON
I
GROWING
- DORMANT SEASON GROWING SEASON SEASON
I
‘N’D; J’F’M’A’M’J’J’A’S’O’N’D; J’F’M’A’M’J’J’A’S’
1982 i I983 I I 1984
Fig. 3. Mean infiltration rate after 30 minutes and sediment production as related to stage of rotation cycle and season near Sonora, Texas. Dormant season includes winter dormancy and drought-induced dormancy.
during the growing season, mean terminal infiltration rate was somewhat higher before the movement of livestock onto the pas- ture than immediately after their removal, but the difference was not statistically significant (Table 3). During the dormant season,
Table 3. Mean ifiltration rate after 30 minutes and sediment production at different stages of the short-duration grazing rotation cycle during the growing and dornmnt seasons near Sonora, Texas.1
Infiltration rate Sediment production
(mm h-l) (kg ha-l)
Stage of Growing Dormant Growing Dormant rotation cycle season season season season
Pre-Graze 159a 146a 744a 1241a
Post-Graze 153a lllc 964a 2017b
Mid-Rest l5Oa 124b 1074a 1640ab
~Means followed by the same letter within a column are not significantly different (is.05).
however, the decline in infiltration rate following grazing was significant. Despite the deleterious effect of trampling, some degree of hydrologic recovery did occur during the subsequent rest periods. By midway through the rest period, mean infiltration rate recovered to a level significantly greater than the post-graze condi- tion, but remained significantly lower than the pre-graze condition.
Sediment production responded similarly to infiltration rate but in an inverse fashion (Table 3). The amount of sediment produced during simulated rainfall was greater following grazing than before grazing during both growing and dormant periods. However, as with infiltration rate, the negative impact of high intensity live- stock activity was significant only during the dormant periods. Recovery of hydrologic condition in terms of sediment production was evident during the dormant season rest periods. The amount of sediment production declined by midway through the rest period to a level which was not statistically different from either the pre-graze or post-graze condition.
The augmented detrimental impact of intensive livestock activ- ity during the dormant season is probably a reflection of overall lower hydrologic condition of the soil during that part of the year.
JOURNAL OF RANGE MANAGEMENT 39(8), November 1988
Grazing animals not only remove protective biomass through graz- ing, but their trampling activity may reduce vegetative cover (Bry- ant et al. 1972, Edmond 1958, Plumb et al. 1984, Quinnand Hervey 1970, Witschi and Michalk 1979), destroy cryptogamic crusts which are essential to hydrologic stability (Brotherson and Rush- forth 1983, Loope and Gifford 1972), compact the soil (Chandler 1940, Kako and Toyoda 198 1, Knoll and Hopkins 1959, Lull 1959, Van Haveren 1983, Willatt and Pullar 1983, Warren et al. 1986b), decrease soil moisture (Chandler 1940, Edmond 1958, Knoll and Hopkins 1959), decrease soil organic matter content (Chandler 1940) reduce soil aggregate size (Chandler 1940, Warren et al. 1986b), reduce soil aggregate stability (Knoll and Hopkins 1959, Warren et al. 1986b), reduce soil hydraulic conductivity (Willatt and Pullar 1983), and reduce seedling emergence and establish- ment (Blom 1976,1977). The ability of a watershed to withstand or recover from livestock impact is undoubtedly related to the hydro- logic condition of the watershed at the time of the impact. During the growing season when soil moisture status, soil aggregate sta- biity, soil organic matter content, soil bulk density, microbial activity, and above- and below-ground plant growth are near optimum levels, the potential of the soil to withstand livestock impact is high, as is the potential to recover following the removal of livestock. During periods of dormancy, however, the resistance to damage from grazing and for subsequent recovery after grazing is less than during the growing season.
Summary and Conclusions
Hydrologic response to an intensive rotation grazing system on silty clay soil, in terms of infiltration rate and sediment production, was different during the growing season than during periods of winter or drought-induced dormancy. Infiltration rate was signifi- cantly higher and sediment production was significantly lower during the growing season than during periods of dormancy. Greater vegetation standing crop and more stable soil physical characteristics during growth periods contributed to the differen- ces. Mean infiltration rate was consistently lower and mean sedi- ment production was consistently higher following grazing than before. The difference was significant during periods of dormancy but not during the growing season. Unfavorable growing condi-