QUALITY OF HIV AND AIDS DATA REPORTED IN COMMUNITY BASED HEALTH INFORMATION SYSTEM IN HOMA-BAY COUNTY, KENYA
EVANCE OCHIENG OGONDI (BSc) Q141/CTY/PT/23686/2013
A RESEARCH THESIS SUBMITTED IN PARTIAL FULFILLMENT OF THE REQUIREMENT FOR THE AWARD OF THE DEGREE OF MASTERS OF SCIENCE IN HEALTH INFORMATION MANAGEMENT IN THE SCHOOL OF PUBLIC HEALTH OF KENYATTA UNIVERSITY
ii
DECLARATION
This thesis is my original work and has not been presented for a degree in any other University:
Signature ………..……… Date………
Name: Evance Ochieng Ogondi
Department of Health Management and Informatics
SUPERVISORS
We confirm that the work reported in this thesis was carried out by the Candidate with our approval as the University Supervisors.
Signature ………... Date…... Dr. George. O. Otieno
Department of Health Management and Informatics Kenyatta University
Signature ………... Date……… Dr. Isaac Mwanzo
iii DEDICATION
iv
ACKNOWLEDGEMENT
I take the earliest opportunity to thank Kenyatta University and specifically, Department of Health Management and School of Public Health for the opportunity and support offered to successfully undertake this course.
The finalization of this study is a culmination of invaluable contributions by various persons. I wish to extend special thanks to my research supervisors, Dr. George Ochieng Otieno and Dr. Isaac Mwanzo, who gave me unlimited audience and guidance.
I also take this opportunity to thank National AIDS control Council M&E officers working in the former Nyanza Region, Mrs. Lucy Okatch, the regional Data officer Nyanza office and Mr. Edwin Lwanya, the Regional HIV Coordinator, for their cordial support and valuable information which helped me in completing this thesis.
Last but not least, I am grateful to almighty God, members of my family, workmates and friends and any other person who may have contributed to this thesis directly or indirectly, for their unwavering material, moral and spiritual support without which this thesis would not have been possible.
v
TABLE OF CONTENTS
DECLARATION ... ii
DEDICATION ... iii
ACKNOWLEDGEMENT ... iv
TABLE OF CONTENTS ...v
LIST OF TABLES ... ix
LIST OF FIGURES ...x
ABBREVIATIONS AND ACRONYMS ... xi
OPERATIONAL DEFINITIONS ... xii
ABSTRACT ...xiv
CHAPTER ONE: INTRODUCTION OF THE STUDY ...1
1.1 Background to the Study ...1
1.2 Statement of the Problem ...3
1.3 Justification of the Study ...4
1.4 Objectives of the Study ...4
1.4.1 Main Objective ...4
1.4.2 Specific objectives ...5
1.5 Research questions ...5
1.6 Null Hypotheses ...6
1.7 Significance of the Study ...6
1.8 Scope and delimitation of the Study ...6
vi
CHAPTER TWO: LITERATURE REVIEW ...9
2.1 Introduction ...9
2.2 Data Quality ...9
2.3 Technical Factors and their Influence on Data Quality ... 11
2.4 Organisational Factors and their Influence on Data Quality ... 13
2.5 Socio-demographic factors and their Influence on Data Quality ... 15
2.6 Health information system for HIV/AIDs ... 17
2.7 Summary and Gaps in Literature Review ... 21
CHAPTER THREE: RESEARCH MATERIALS AND METHODS ... 22
3.1 Introduction ... 22
3.2 Research Design ... 22
3.3 Study Variables ... 22
3.3.1 Dependent Variable ... 22
3.3.2 Independent Variable (s)... 22
3.4 Study Location ... 23
3.5 Study Population ... 24
3.5.1 Inclusion Criteria ... 24
3.5.2 Exclusion Criteria ... 24
3.6 Sampling Techniques and Sample size ... 24
3.6.1 Sampling Technique ... 24
3.6.2 Sample size Determination ... 26
3.7 Pre-Testing of Tools... 27
vii
3.7.2 Reliability... 28
3.8 Data Collection Instrument and Procedures ... 29
3.9 Data Analysis ... 29
3.10 Logistics and Ethical Considerations ... 31
CHAPTER FOUR: RESULTS ... 32
4.1 Socio-Demographic Characteristics of the Study Respondents ... 32
4.2 Quality HIV/AIDs Data in CBHIS ... 34
4.3 Socio-Demographic Factors and their Influencing on Data Quality ... 35
4.4 Technical Factors and their Influence on Data Quality ... 38
4.4.1 Characteristics of Technical Factors ... 38
4.4.2 Influence of Technical Factors on Data Quality ... 40
4.5 Organizational Factors and their Influence on Data Quality ... 42
4.5.1 Characteristics of Organizational Factors ... 42
4.5.2 Influence of Organizational Factors on Data Quality ... 43
CHAPTER FIVE: DISCUSION, CONCLUSIONS AND RECOMMENDATIONS 47 5.1 Discussion... 47
5.1.1 Quality of Data ... 47
5.1.2 Socio-Demographic Factors and their Influence on Data Quality ... 48
5.1.3 Technical Factors influencing Data Quality ... 49
5.1.4 Organizational Factors Influencing Data Quality ... 52
5.2 Conclusions ... 53
5.3 Recommendations ... 54
viii
REFERENCES ... 56
APPENDICES ... 60
Appendix 1: Consent Form ... 60
Appendix 2: Interview Questionnaire... 63
Appendix 3: Key Informant Interview Guide ... 73
Appendix 4: Research Approval from Graduate School ... 74
Appendix 5: Ethical Review Clearance ... 75
Appendix 6: Research Permit from NACOSTI ... 77
Appendix 7: Data Quality Index ... 78
Appendix 8: Distribution of Sampled Organization ... 79
ix
LIST OF TABLES
Table 3.1 Key Informants Distribution ... 25
Table 4.1 Socio-Demographic Characteristics of the Study Respondents ... 33
Table 4.2 Influence of Socio-Demographic Factors on Data Quality ... 37
Table 4.3 Characteristics of Technical Factors ... 38
Table 4.4 Computer Skills of the respondents/participants ... 39
Table 4.5 Influence of Technical Factors on Data Quality ... 41
Table 4.6 Characteristics of Organizational Factors ... 43
x
LIST OF FIGURES
xi
ABBREVIATIONS AND ACRONYMS AIDS Acquired Immune Deficiency Syndrome CACCs County Aids Control Committee
CASCOs County Aids and STI Coordinator CBO Community Based Organization CDC Center for Disease Control CI Confidence Interval
COPBAR Community Based Programme Activity Reporting System FBO Faith Based Organization
HARS HIV and AIDS Reporting System HIM Health Information Management HIRs Health Information Resources HIV Human Immunodeficiency Virus KII Key Informant interview
KNASP Kenya National AIDS Strategic Plan NACA National Agency for AIDS Control NACC National AIDS Control Council
NASCOP National AIDS and STI control program. NGO Non-Governmental Organization.
NNRIMS Nigeria National Response Information Management System PBF Performance based financing
RHC Regional HIV Coordinator
xii
OPERATIONAL DEFINITIONS
Community-based Health information System
This is an information systems which is designed to collect, store and report health information from the community after which the information is reported vertically to national and facility health information systems.
Computer Proficiency
This refers to ability of health professionals to use basic Microsoft office applications in utilizing information
Data This refers to facts and statistics collected together for reference or analysis in community based health information systems
Data base This refers to an organized collection of data set of data and information held in a in electronic, print or manual formatcomputer and can easily be accessed, managed, and updated.
Data quality Refers to perceived fitness of data for use in regards to its accuracy, completeness, update status, relevance, and consistency across data sources, reliability, appropriate presentation and accessibility
xiii
Health information This refers to any system that captures, stores, manages or transmits information related to the health of individuals or the activities of organizations that work within the health sector
Organizational factors
This refers to institutional processes, systems and structures in place to support data quality improvement such as trainings, data quality checks and recruitment of highly qualified personnel
Socio-Demographic factors
These are the individual characteristics which can exert influence on data handling, processing and use. In this study, behavioral factors included their age, sex, education and experience
Technical factors This refers to the available resources and capabilities in an organization to support application of technology in data collection, processing and management
xiv
ABSTRACT
1
CHAPTER ONE: INTRODUCTION OF THE STUDY 1.1 Background to the Study
The advancement of time has seen the incorporation of health information systems in management and care of different cases and phenomenon within the health care sector. Whereas many players within the sector have different approaches in use of health information system, the bottom line is that they involve the adoption of different apparatus and processes for collection of vital data (Chen et al, 2012). The collected data, at the community level, is in many practices transmitted to a system that allows for monitoring and evaluation for the purpose of improving health system within different organization and agencies (NASCOP, 2011).
Complexities within the health care sector calls for use of Community Based Health information systems (CBHIS) that allow continuous process that can record and tap into the ever dynamic and complex health care phenomena (CDC, 2010). In this regard, there is an overwhelming need to adhere to a system that is centralized, that can gather different patterns and records, including mortality and morbidity and that must range from individual level all the way to the most complex of groups. Similarly, within the Kenyan context, the system must gather the data and information from the sub county level, through to the county and upwards to the national level
2
care are dependent on improvements in access to, and use of, good quality information (Shivaji et al., 2015).
Data quality refers to data that is accurate, valid, reliable, relevant, legible, complete and available in a timely manner to decision-makers for healthcare delivery and planning purposes (Chiba et al., 2012). Data quality includes the accuracy of coding and data entry, the timeliness of data, the comprehensiveness of data collection and the degree to which all relevant records are captured. Good quality data is data that meets the requirements of data users to support service delivery, quality improvement, performance reporting and planning (Barua et al., 2014). Health and data quality standards identify what structures and processes organizations should have in place to create a supportive environment for data quality. Because good quality health information is dependent on good quality data, it is therefore logical that efforts to improve the information on which decisions are based will start with ensuring that data is collected, processed and analysed appropriately (Chen et al., 2012).
3
Despite the effort put in place to make use of Health information system in the management of HIV/ AIDS, there is mixed fortune in that respect. This study seeks to investigate factors that influence quality of HIV &AIDS data reported in the community based health information systems in Kenya with a focus on Homa-Bay County as a means of understanding the Kenyan scenario.
1.2 Statement of the Problem
Kenya National AIDS strategic plan (2014) {KNASP III} report on strategic planning identified data quality as a hindrance to achieving the numerous initiatives that have been put in place to tackle HIV and AIDS. Although the report acknowledges insufficient data provision from Community Based Programme Activity Reporting System (COPBAR) for decision systems supports, limited efforts have been put towards understanding the causes of poor quality of data in the systems.
4
evidence to indicate that since the inception of the COPBAR program in 2006, it has undergone any form of data quality assurance. . It is against this backdrop that this study sought to assess factors contributing to quality of data in the community based Health information systems.
1.3 Justification of the Study
NASCOP (2011) acknowledges poor data quality as a key challenge in HIV programming and policy intervention. Many programs and interventional decisions rely on the data collected to make decisions which affect populations’ health and impact on
socio-economic development of the country. However, there are information gaps on key factors affecting HIV data quality in COPBAR in Kenya which this study sought to bridge.
Further, the Health Policy Framework, 2012-2030, the Constitution of Kenya and Vision 2030 among other national and international operational frameworks acknowledge the role of improved population health in socio-economic prosperity of a country. This requires high quality data to support decision-making support and resource allocations. Homa Bay County was selected as the study site because it hosts a significant proportion of functional COPBARs in Kenya linked to its high HIV prevalence.
1.4 Objectives of the Study 1.4.1 Main Objective
5 1.4.2 Specific objectives
The study had three specific objectives namely:
1. To determine the quality of HIV/AIDS data reported to the CBHIS in Homa-Bay county, Kenya;
2. To establish socio-demographic factors influencing quality of HIV/AIDS data reported to the CBHIS in Homa-Bay county, Kenya;
3. To establish technical factors influencing quality of HIV/AIDS data reported to the CBHIS in Homa-Bay County, Kenya;
4. To determine organizational factors influencing quality of HIV/AIDS data reported to the CBHIS in Homa-Bay county.
1.5 Research questions
1. What is the quality of HIV/AIDS data reported to the CBHIS in Homa-Bay county, Kenya?
2. What are the socio-demographic factors that influence quality of HIV/AIDS data reported to the CBHIS in Homa-Bay County?
3. What are the Technical factors that influence quality of HIV/AIDS data reported to the CBHIS in Homa-Bay County?
6 1.6 Null Hypotheses
The Null Hypotheses of the study were:
1. There is no statistically significant relationship between socio factors and quality of HIV/AIDS data reported in the CBHIS;
2. There is no statistically significant relationship between technical factors and quality of HIV/AIDS data reported in the CBHIS;
3. There is no statistically significant relationship between organizational factors and quality of HIV/AIDS data reported in the CBHIS;
1.7 Significance of the Study
The study provides useful information on factors influencing quality of HIV/AIDS data reported in the community based health information system. The study documents clear policy actions recommendations for informing policies initiatives and programme interventions for the implementing organizations management and stakeholders aimed at improving quality of HIV/AIDS data and hence improve integrity of data for decision-making. The study also contributes to health research documentation for future research and reference.
1.8 Scope and delimitation of the Study
7
To address this limitation, individual perceptions towards quality of data were adopted as basis of quality measurement in the study.
1.9 Conceptual Frame work
The conceptual framework illustrates the expected relationship between the independent variables of the study and the dependent variable. I.e. how the independent variables influence data quality (Figure 1.1).
Conceptual Framework of the Study
Independent Variable Intervention Variable Dependent variable
Source: Modified from Chen et al., 2012 Figure 1.1 Conceptual Framework of the Study Socio-demographic
Factors
Age
Sex
Education
Experience
Training
IT Skills Technical Factors
Data collection tools
Computer
Internet Access
Organizational Factors
Adequate Personnel
Support system
Funding
Trainings
Quality of HIV/AIDS data Policies and
8
9
CHAPTER TWO: LITERATURE REVIEW 2.1 Introduction
This chapter provides a comprehensive review of factors affecting quality of HIV and AIDS data reported in health information systems. Similar studies and publications done in Kenya, Africa and worldwide have been reviewed. A critique and summary of gaps for the studies reviewed has also been provided
2.2 Data Quality
Numerous scholarly works have been published with regard to quality of data in fighting HIV/AIDS. Many countries all over the world have had numerous challenges with regard to the quality of data collected at the community levels; and the more challenges have been reported in resource limited countries, Kenya stands in as one of them. Many scenarios report that there are standardized methods in data collection, reporting and implementation (NASCOP, 2011).
10
reliability of the data, so collected. The quality of data is therefore summed up as being influenced by technical, s and organisational factors (NACC, 2011).
CDC (Centre for disease Control) has, in course of time worked with other government agencies and local community health facilities to provide the requisite data that can be used in surveillance purpose; through such surveillance, management of HIV/AIDS has been enhanced all through. In this regard the focus has been integrating the data in different sources within the community levels as well as the national level to improve on its quality. However, just like in other facilities CDC has shortcomings with regard to quality of data (CDC, 2010).
The most evident challenge is that the data that comes out is never representative of the entire larger population and it either incomplete and or inaccurate. This is because the data gathered is normally of those people who have been tested and normally excludes those who are yet to be tested but are infected. This argument is justified by a survey carried out in Washington DC where 79.7% people said they had seen healthcare providers but only 49.7% of that group were offered test on HIV/ AIDS (Mann, 2008).
11
Moreover, the new approach significantly reduces the cost. This is because; the previous system had extra cost because of overlapping systems. There was need for new approaches with regard to prevention and surveillance of the outputs within the system. The success of the entire process rest in the ability the stronger monitoring and evaluation platform (Cohen & Trussell, 2006). A key establishment of studies is that once the data quality is compromised, their usefulness is compromised as well. It thus follows that there is need for concerted efforts to enhance data quality through the various steps involved (Dimsdale, 2013).
2.3 Technical Factors and their Influence on Data Quality
The quality of data gathered is largely dependent on the technical aspect involved in the entire process. The technical aspect relate to various aspects such as data collection tools used, the kind and level of technology used in the entire process as well as the information Communication technology adopted (Chan et al., 2010). World Health Organisation (WHO) reckons that health Information system, in addition to other building blocks is critical for the significance of any safe health system (Cohen & Trussell, 2006).
12
proper funding must follow since a heavy resource base is needed for the success of any health management system (Venkatarao et al., 2012).
Health information system is dependent on various data sources which include data collected from household, census from the general public, regular monitoring and evaluation and general registrations (Cheng et al., 2009). Accuracy and relevance of any kind of data dependent on right policy frame work that would allow for monitoring and evaluation. This means that quality of data is not easy to come by if the right structure and policy is not in place; it involves a complex of issues. Despite the realization of need for good quality data, many institutions globally still endure a myriad of challenges with regard to quality of data and, by extension, the right health information system. The challenges come in form of data quality and right interpretation of data (Muskat-Gorska, 2008).
In the process of collecting and inputting HIV/AIDS data, it is essential that several factors that have a bearing on the quality of date be checked to ensure quality of data collected and used to inform decisions (Chen et al., 2012). In this regard, strategies are vital to ensure quality of data. Fundamentally, there are five essential strategies that relate to data tools that guide quality of data in a heath information system. These include (i) proper M&E structures and guidelines; (ii) proper definition of pointers and reporting procedure; (iii) proper data collection and reporting; (iv) right data management and (v) right interlink among various sub regional, regional and national reporting system.
13
system for better quality of data. That means, the weakness within the system can be identified and the right mechanisms developed to improve. Therefore, rigorous and regular evaluation of the health information system is paramount to identify the factors that curtail quality of data in health information system (Fackelmann, 2008).
Data quality short-comings has been for long attributed to code based system which was later moved to name based; but the challenges remain imminent. Accuracy was improved but completeness of the data was not as improved as was envisaged. In California for example only 36,000 cases were reported in 2009 but it was estimated that there were between 68,000 and 106,000; more than half the cases were never reported. This trend is universal in many healthcare facilities bearing in mind the measures and initiatives that CDC has put in place. Surveillance of HIV/AIDS data is compromised because of the technical aspect that is methodology of data collection as well as the resources of the data. In order to appreciate the shortcoming witnessed, it is imperative that investigations are carried out in the systems (Oazi and Ali, 2011).
2.4 Organisational Factors and their Influence on Data Quality
14
Experts have contended that a well-structured organisational system is important in dealing with HIV/AIDS as well as other diseases. KNASP III (2014) ETR identified a weakness in the reporting structure in the country. One of the major setback in Kenya is that there are inadequate personnel; there is improper distribution of the existing personnel (these included those with training as well as those whose trainings are questionable). Similarly, there is need for improved funding within the systems because the funds availed is not adequate to deal with these challenges (Chiba et al., 2012).
The weak reporting structure has been linked to poor morale among the employees starting from those collecting the data all the way to the top. The system is occasionally marred by poor accountability structure, poor linkages among the stakeholder involved as well as poor coordination; all of which have a negative impact in the quality of data reported (KNASP III 2014). Private sector and public sector need to work in collaboration yet research has revealed that there is inadequate collaboration due to trust issues. The result effect is a malfunctioning Monitoring and evaluation structure that is needed to redeem the sector. The reality with regard to the reporting structure from the bottom to the top is that there are different issues identified as lacking within the structure. For instance, the systems need to have competent and motivated staff (Aqil et al., 2009). There is need for integrating reporting channels from the community levels, all the way to the national level.
15
collaboration between the staff and community leadership because the work at hand needs common effort from all stakeholders (Poku, 2014). In some regions, the policies used are not in tandem with current realities and this also contributes to weak data gathered within the reporting systems. Despite efforts from different multi sectorial organizations involved in the fight, there are still gaps with regard to policy guidelines, inadequate staff trainings and requisite skills for different levels (Mann et al., 2008).
2.5 Socio-demographic factors and their Influence on Data Quality
Experts agree that the quality of data is influenced by socio-demographic factors such as the experience levels, the level and kinds of training and Information Technology skills of the people involved in the process of data collection, storage, analysis and implementation. WHO through UNAIDS through its report on, ‘guidelines for measuring National HIV prevalence in Population based surveys’, recognized that personnel used to carry out research must have high level training as well as proper organization while discharging their duties. It is evident that the duties are carried over a long period of time and there is the need to balance efforts both during intensive and non-intensive times (WHO 2010). For instance, it is evident that during filed work that involves data collection and the data entry phase, the efforts are intensive. In this regard, the personnel need to have the zeal to carry out those duties without compromise because those phase re critical in the management of HIV/AIDS (Makombe et al., 2008).
16
Rapport with the respondents is vital during data collections and as such the staff must have adequate training while carrying out such activities (Freestone et al., 2012). In some instances, staffs keeps changing and thereby breaks the rapport that is much needed. In turn, the data gathered, in most cases, risk compromise. Moreover, personal prejudices and stereotypes often get involved in the process of collections as well as reporting and these are attributed to the differences that the respondents and the interviewers may have against each other.
Data managers must ensure that the data gathered meets high standards and are devoid of individual’s potential bias. This means that counter checking as well as other proper data
quality management initiatives are adopted to ensure high quality data (Cheng et al., 2009). It is important that the personnel picked have the requisite knowledge and skills gained through training and experiencing in the different files required namely: designing of the survey, analysing data and final report. Furthermore, there must be supervisors who are conversant with the system and who countercheck to ensure high quality data.
17 2.6 Health information system for HIV/AIDs
High quality HIV/AIDs data requires functional and effective support systems and structures to enhance monitoring activities, surveillance and minimize errors associated with data (Okeyo, 2008). In this regard, most of the HIV/AIDs information systems face challenges of incomplete compilation of data as well as inaccurate reporting. In Kenya, despite the existence of many agencies, government and non-governmental working on the scourge, there was not coordination of the agencies. As such, conflicts have marred the efforts steered towards comprehensive approach to deal with HIV and AIDS (NACC, 2011).
The government through the ministry of health identified several initiatives that would narrow the gap that has negatively impacted on the fight against HIV and AIDS. Workshops that focus on empowering relevant agencies have been put forth. In those forums new and emerging strategies are addressed so that the stakeholders are up to date with the trends. This comes in the wake of reality that dealing with HIV and AIDS, like other infectious diseases, require timeliness and accurate information. Through such initiatives the patterns and trends, which are the key to addressing the challenges, are effectively, addressed (NACC, 2011).
18
following the approval of Botswana Health Research and Development committee. It was carried out by International Training and Education Centre for Health. Collection of data was through interviews done at national, district and community levels. 129 people were interviewed in the three levels where 71 were from the community, 31 were from the district and 27 from the national. People interviewed were from different social and economic levels comprising of government, NGO, community and faith based organizations. Different aspects within confine of health information system were assessed through Routine Quality Audit Tool. The data collection adhered to the five essential strategies identified above; Proper M&E structures and guidelines, Proper definition of pointers and reporting procedure, Proper data collection and reporting ,Right data management, Right interlink among various sub regional, regional and national reporting system (Leorna, 2009).
19
In 2004, Nigeria National Response Information Management System (NNRIMS) took a deeper role in the fight against HIV/AIDS through an evaluation and monitoring approach. The main reasons were to improve quality of data collected and analyzed. The NNRISM system was assessed because of a partnership that the organization formed with National Agency for AIDS Control (NACA). Within that arrangement, the 36 states of the country were empowered so that they could enhance accurate, timely and reliable data collection (Kennedy, 2004).
Further, the Nigerian ministry of health launched national wide directory of health facilities. Trough that approach a directory of more than 34,000 health care facilities spread all over the country would be monitored in real time. That is possible because the system identifies different things as the location, type of the facility as well as the other essential characteristics of the facility. Through such approach the NHMIS can have better management because the information is updated regularly (Kennedy, 2004).
20
indicators. Rwanda and Nigeria were in 2012 identified as having put in place the right PBF systems that fit within their countries context (Harlan, 2005).
Assessment of quality of data in Philippines (Mann, 2008), like in many other regions of the world, identified certain strengths and weaknesses. Health information systems (HIS) had a formulation in the 1970s through which the data required for different types of management would be gathered on need to need basis. Similarly the storage of the data did not have to be centrally stored but could be kept in different units and used in various departments and used whenever required. The data base comprised of computers which would be used to store and process the data. However, it became clear that HIS had certain challenges.
21 2.7 Summary and Gaps in Literature Review
Many factors combined determine the quality of data used for decision-making. Although several studies have been carried out on data quality, most of the studies have focused on the national information systems with limited focus on community-based information systems. In addition, there is inconclusive evidence that periodic data quality assessment undertaken have been able to address the problem facing data quality in HIV/AIDs programming. Finally, community-based systems constitute a vital data source as they are directly linked to the community. In many instances, the systems face technical and organizational challenges which affect their ability to collect, archive and report high quality data which ends up in the national data bases.
22
CHAPTER THREE: RESEARCH MATERIALS AND METHODS 3.1 Introduction
This chapter deals with design of the study, target population, sample and sampling procedure data collection, validity and reliability of the research instrument, data analysis and ethical consideration.
3.2 Research Design
A cross sectional study adopting use of qualitative and quantitative methods of data collection was used. The design was chosen due to its ability to provide a snapshot of a population at a certain time and allowing conclusions about phenomena across a wide population to be drawn. It allowed collection of data within a short period of time.
3.3 Study Variables
3.3.1 Dependent Variable
The dependent variable was quality of HIV/ AIDS data in CBHIS.
3.3.2 Independent Variable (s)
The independent variables of the study were:
a) Socio-demographic Characteristics. This variable examined the influence of age, sex, experience, level of education, profession qualification on quality of HIV and AIDS data reported to the CBHIS in Homa-Bay County.
b) Organizational factors. This variable studied the influence of workload, resources,
23
c) Technological Factors. This variable studied the influence of ICT skills, internet Connectivity, and ICT infrastructure, computer literacy on quality of HIV and AIDS data reported in the CBHIS.
3.4 Study Location
24 3.5 Study Population
The study population comprised of data management representatives from CBOs and FBOs implementing HIV/AIDs activities in Homa-Bay County from which the 138 data representatives were sampled.
3.5.1 Inclusion Criteria
The study included all the data management representatives from the selected CBOs and FBO’s within Homa-Bay County who gave informed consent to participate in the study
and had at least one year work experience within the County.
3.5.2 Exclusion Criteria
Staff who were absent from their work stations during time of study were excluded from the study.
3.6 Sampling Techniques and Sample size 3.6.1 Sampling Technique
25
respondents, simple random sampling was used. A serialized list of all the staff involved in data management activities from each of the selected organizations was prepared using a continuous numbering system. A table of random numbers was used to randomly select and recruit one respondent from each of the sampled organization to participate in the study.
Key informants for the study were selected purposively based on their experience and knowledge in the subject matter. This ensured that information obtained was reliable and comprehensive in addressing the study gaps and issues of interest. A total of fifteen (15) Key informants were selected based on their position, understanding and experience in HIV/AIDs data management, use and programming (Table 3.1). They included Regional HIV Coordinators (RHCs), County Aids and STI Coordinators (CASCOs) and County AIDs Control Committee (CACCs) in Nyanza region. Key informant interviews and provided useful insight and views on HIV/AIDS data reported in the community based health information system in Homa-Bay County.
Table 3.1 Key Informants Distribution
Type of Key informant Total Number Total Sampled
Regional HIV Coordinators 2 1
County AIDS and STI Coordinators 1 1
County AIDS Control Committee 8 1
Sub County Data Officers 8 4
Sub-county County AIDS Control Coordinators 8 4 Sub-county County AIDS Control Committee 8 4
26 3.6.2 Sample size Determination
The quantitative sample size was determined using a formula by Fisher et al., (1998) as shown:
n=Z2P (1-P) d2
Where:
n= Sample size
Z=Standard Normal deviation (1.96 for a 95% confidence level)
P=the proportion of the population having the characteristic being measured, when unknown, p=0.5
d=the level of accuracy desired, or the sampling error (Often set at 0.05).
Therefore,
n= 1.962 X 0.5 X 0.5 = 384 Respondents 0.052
Since the population in selected organizations was less than 10,000 (i.e 347 Data officers); the sample size was adjusted using the formulae:
nf= n/1+(n/N)
Where:
nf= The final sample size, when the population is < 10,000
n= the sample size of the populations of the 10,000 or more, that is 384
27 Therefore,
nf= 384.16 = 137 1+ (384.16/213)
To cater for non-response or spoiled questionnaire an allowance of 10% of the estimated sample size (13 respondents) was added translating to a total sample size of 150 respondents. During data collections, a total of 138 survey questionnaires were dully filled and returned. This translated to a sample size of 138 respondents; a 92% response rate. This was a good response rate which was representative of the study population.
3.7 Pre-Testing of Tools
Pre-testing of study instruments was done in Rongo sub- County, which is in neighbouring Migori County. A total of 30 data representatives were selected from 30 implementing organization in the County using simple random sampling to participated in the pre-test. The characteristics of the Rongo Sub-County CBHIS and respondents were similar to that of the study sites. This was important to ensure the pre-testing results and review of the study tools reflected the opinions, and unique characteristics of the study respondents.
28 3.7.1 Validity
Validity is the accuracy and meaningfulness of inferences, which are based on the research results. It is the degree to which results obtained from the analysis of the data actually represent the variables of the study (Mugenda and Mugenda, 2003).
In this study, to ensure internal validity of tools, random sampling technique was used to enhance homogeneity and representativeness of selected population while random selection of a large sample of study respondents and comparison of results with studies done elsewhere was done to enhance external validity of the study. The study used other similar study questionnaires to inform and guide development of the study tools and measurement of items included in the tools as measure of enhancing validity of the tools. Expert opinion from the research supervisors was sought and their inputs taken into account in development of the study tools to enhance validity.
3.7.2 Reliability
Reliability is a measure of the degree to which research instruments yields consistent results or data when used repeatedly in a manner that decreases random error (Mugenda and Mugenda, 2003).
29 3.8 Data Collection Instrument and Procedures
The study used semi-structured questionnaire (Appendix 2) and Key informant guide (Appendix 3) to collect primary data. Development of study instruments was informed by the study objectives. The instruments included key questions on socio-demographic, technical, organizational and quality of CHBHIS data variables which formed the core focus of the study. The study respondents who gave informed consent were interviewed using pre-tested semi-structured questionnaires while key informants were interviewed using pre-tested key informant interview guide. Desk review of similar studies and reports was also done to provide insight on the study variables and outcomes of interest.
3.9 Data Analysis
Analysis of data involved quantitative and qualitative approaches. Quantitative data was first compiled and coded into SPSS Version 20. Questionnaires with missing, inconsistent and incomplete data were cleaned and data imputation done to ensure the integrity of data and study outcomes are highly reliable.
For quantitative data, descriptive statistics including means, frequencies and percentages were used to summarize and describe the study sample and study variables.
30
In regards to inferential statistics determining influence of socio-demographic, technical and organizational factors on perceived data quality for the CBHIS across different CBO and FBO organizations, cross-tabulation was determine to study relationship between independent variables and dependent variable. This was followed by chi-square analysis which was used to determine association between the variables. In this study, statistical significance for testing hypothesis was 95% Confidence Interval (CI); that is 5 percent significance level (P-value =0.05).
31 3.10 Logistics and Ethical Considerations
Research approval to conduct the study was granted by Kenyatta University Graduate School (Appendix 4). Ethical approval was obtained from Kenyatta University Ethics Review Committee (Appendix 5) and a research permit granted by National Commission for Science, Technology and Innovation (NACOSTI) (Appendix 6).
To safe guard the rights of the respondent and uphold the obligations of the principal investigator, Informed consent to participate in the study were obtained from study respondents using a consent form (Appendix 1). The Consent form was used to obtain informed consent, provide relevant information on the study, its purpose, expected benefits, associated risks as well as enable respondents inquire on any issues of concern that related to the study especially ethical concerns.
32
CHAPTER FOUR: RESULTS
This chapter presents the qualitative and quantitative findings of the study based on research objectives. The chapter is organized as follows: background characteristics of respondents, socio-demographic factors, organizational factors and technological factors.
4.1 Socio-Demographic Characteristics of the Study Respondents
The study examined the distribution of respondents by age, gender, education, years of experience and qualifications. Table 4.1 presents the socio-demographic characteristics of the study respondents.
33
Table 4.1Socio-Demographic Characteristics of the Study Respondents
Variable Frequency (n=138) Percent
Age
21-34 years 66 48%
35-44 years 33 24%
45-54 years 20 14%
55+ years 3 2%
No Response 16 12%
Gender
Male 82 59%
Female 50 36%
No Response 6 4%
Education Level
Primary 2 1%
Secondary 37 27%
College 82 59%
University 10 7%
No Response 7 5%
Professional Experience
<2 years 15 11%
2-4 years 53 38%
5-7 years 29 21%
8-10 years 18 13%
Over 10 years 10 7%
34
4.2 Quality HIV/AIDs Data in CBHIS
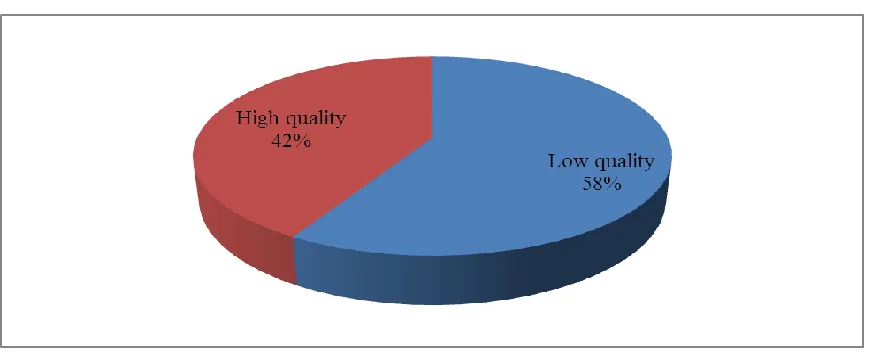
Respondents were asked to rank quality of data in the CBHIS using a 5-likert scale points. The ranking used six key dimensions of quality which were completeness, conformity, accuracy, integrity and timeliness of data (See Appendix 7). A quality index was derived from the dimensions after which the median value was used to split the data into two categories; low and high quality. Slightly more than half (58%) of the respondents ranked quality of data in the CBHIS as low (Figure 4.1).
Figure 4.1Quality of HIV/AIDS Data in CBHIS
Qualitative results revealed an existing consensus that CBHIS data is of low quality due to data-related challenges facing the implementing organizations. The challenges were reported to include lack of adequate resources and skills in data handling, processing and management. The following interviewee quote illustrates this finding:
35
4.3 Socio-Demographic Factors and their Influencing on Data Quality
A summary of the relationship between socio-demographic factors and quality of HIV/AIDS data is shown in Table 4.2.
There was minimal difference on data quality ranking across the different ages. The proportion of younger staff (21-44 years) ranking data quality as high (80%) compared equally with those who ranked the data quality as low (81.9%). The trend was the same for older staff. . There was no statistically significant relationship between age and data
quality (χ2 = 2.746,p= 0.453). Qualitative results indicated that age is not an important socio-demographic factor which can affect data quality. Individuals with the right skills and capabilities can perform data processes and activities effectively irrespective of their age. The following statement from key informant interviews explains:
“…Quality of data is not affected by age of the handler but the skills and abilities of the individual…”~Data Officer
The proportion of male staff who ranked data quality as high (56.4%) and low (70.4%) was higher than the respective proportions for females. Males tendered to rank data quality high (70.4%) compared to females (29.6%). There was no statistically significant relationship between gender and data quality (χ2 (1) = 2.643,p= 0.144). Qualitative findings showed that any employee, whether male of female can effectively and successfully undertake data management roles without any significant effect on quality of data outcomes as explained by the following quote from a key informant interview:
36
The results emphasized the need for proper orientation and capacity development of data staff in improving individual role performance.
Staff who had college education and above tended to rank quality of data in the CBHIS high (100.0%) compared to those who had secondary education level and below (0.0%). There was a statistically significant relationship between education level and data quality (χ2 (3) = 44.895,p= 0.001). Qualitative results indicated that staff with higher educational attainment are able to handle complex data and data-related problems with ease and efficient than those with lower educational levels. However, possessing internal motivation to solve data-related problems is as important as the education attainment as explained in the following key informant statement:
“…Handling large data set from multiple sources requires higher cognitive abilities. Higher educational qualification can equip one with strong abilities for comprehending and resolving complex problems…”~Data Officer
Staff who had at least two years of professional experience and above tended to rank data quality high (82.7%) compared to those who had less than two years of experience (17.3%). There were minimal differences in the data quality ranking across the various professional experience categories of the staff. There was no significant relationship between years of work experience and data quality (χ2 (4) = 6.509,p= 0.169). Qualitative findings indicated need for motivation and passion in data and data use as opposed to one’s work experience. The following quote from a key informant interview illustrates:
37
systems which can identify motivated personnel with pre-requisite skills to handle data not just experience...”~CACC
Table 4.2 Influence of Socio-Demographic Factors on Data Quality
Variable
Quality Perception Chi-square statistics
Low High
Age 21-34 years 43(59.7%) 23(46.0%) χ2=2.746, df=3, p=.453
35-44 years 16(22.2%) 17(34.0%) 45-54 years 11(15.3%) 9(18.0%) 55+ years 2(2.8%) 1(2.0%)
Gender Male 44(56.4%) 38(70.4%) χ2=2.643, df=1, p=.144
Female 34(43.6%) 16(29.6%)
Education Level Primary 2(2.7%) 0(0.0%) χ2=44.895, df=3, p=.001
Secondary 37(50.7%) 0(0.0%) College 29(39.7%) 53(91.4%) University 5(6.8%) 5(8.6%)
Professional Experience
<2 years 6(8.2%) 9(17.3%) χ2=6.509, df=4, p=.169
38
4.4 Technical Factors and their Influence on Data Quality
The study assessed various technical factors in the CBHIS which included availability of computers, internet connection, data quality checks and skills in computer programs.
4.4.1 Characteristics of Technical Factors
Results on the characteristics of technical factors are presented in Table 4.3. Results showed that in regards to computers, more than half (60%) of the organizations had functional computers for data storage and management. In regards to internet connection, less than a third (22%) had access to internet connection in their workplace. In regards to data quality checks, close to three quarters of the organizations (73%) were conducting data quality checks.
Table 4.3Characteristics of Technical Factors
Variable Frequency (n=139) Percent
Availability of computers
Yes 83 60%
No 32 23%
No Response 23 17%
Availability of internet connection
Yes 30 22%
No 85 62%
No Response 23 16%
Performance of data quality audit
Yes 101 73%
No 31 22%
No Response 6 5%
39
ranked their skills as fair while only 31 (22.5%) reported proficiency above average. However, 34(24.6%) of the respondents had no knowledge at all.
In regards to Ms Word, 30(21.7%) had no knowledge at all while 81(58.7%) had proficiency of above average. In regards to Ms Excel, 30(21.7%) had no knowledge at all while 45(32.6%) rated their skills as fair. A total of 60(43.4%) rated their skills to be above average. In regards to Web Browser, 30(21.7%) had no knowledge at all, 6(4.3%) rated their skills as poor and 75(54.4%) rated their skills to be above average. In regards to data base, 15(10.9%) rated their skills as poor while 45(32.6%) rated their skills as fair.
Table 4.4Computer Skills of the respondents/participants
Computer Skills Variable Categories Frequency (n=138) Per cent (%)
Access No knowledge 34 25
Excellent 29 21
Fair 73 53
Good 2 1
Word No knowledge 30 22
Excellent 48 35
Fair 27 20
Good 33 24
Excel No Knowledge 30 22
Excellent 30 22
Fair 45 33
Good 30 22
Poor 3 2
Web Browser No knowledge 30 22
Excellent 27 20
Fair 27 20
Good 48 35
Poor 6 4
Application Databases No knowledge 30 22
Excellent 12 9
Fair 45 33
Good 36 26
40
4.4.2 Influence of Technical Factors on Data Quality
A summary of the relationship between technical factors and quality of HIV/AIDS data is shown in Table 4.5. Staff who had computers tendered to rank data quality in CBHIS high (100.0%) while those who had no computers tendered to rank quality of data as low (66.7%). There was a significant association between availability of computers and data quality (χ2 (1) =61.888,p= 0.001). Qualitative findings showed that computers enable staff to archive optimal collection, processing and archiving data with minimal resource support in an efficient manner.
Staff who had no access to internet connection tended to rank data quality in CBHIS high (79.2%) compared to those who had internet connection (20.8%). There was no significant association between availability of internet connection and data quality (χ2 (1) =1.179,p= 0.293). Qualitative results indicated that there internet connection doesn’t no
affect data quality in the CBHIS. However, where information systems are computerized, internet connection was reported to be an important resource in electronic uploading and reporting of data for higher level use.
Staff who reported performing data quality audit tended to rank quality of data high (83.3%) compared to those who reported to have no data quality audit (16.7%). There was a significant association between performance of data quality audit and data quality
41
Lack of adequate technical skills and resources were also reported to compromises data quality in the information systems. Some CBHIS lacked the necessary technical support systems such as internet and computers which undermined their ability to collect process and achieve quality data. The following statement drawn from key informant interviews expounds:
“…In this County, there is lack of appropriate infrastructure and facilities like computers and appropriate software such as those for data back up to handle sensitize data like that of HIV/AIDs programming. There has been positive progress but more investment is required in strengthening reporting systems as a way of improving quality of data used to inform decisions…”~CASCO
“…Data quality checks and audits are done but not regularly. The efforts are sporadic…”~RHC
Table 4.5 Influence of Technical Factors on Data Quality
Variable
Quality Perception Chi-square Statistics
Low High
Availability of computers Yes 16(33.3%) 67(100.0%) χ2=61.888, df=1, p=.001
No 32(66.7%) 0(0.0%)
Availability of internet connection
Yes 20(29.9%) 10(20.8%) χ2=1.179, df=1, p=.293
No 47(70.1%) 38(79.2%)
Performance of Data Quality Audit
Yes 55(71.4%) 45(83.3%) χ2=12.037, df=2, p=.001
42
4.5 Organizational Factors and their Influence on Data Quality
The study assessed organizational factors in CBHIS which included staff training on data collection, frequency of data collection, knowledge of data collection and processing and qualification of data management staff.
4.5.1 Characteristics of Organizational Factors
43 Table 4.6 Characteristics of Organizational Factors
Variable Frequency (n=138) Percent
Staff Training on Data collection
Yes 34 25%
No 83 60%
No Response 21 15%
Knowledge of Data Collection and Processing
Yes 49 36%
No 73 53%
No Response 16 12%
Frequency of data collection
Weekly 7 5%
Monthly 15 11%
Quarterly 88 64%
Yearly 28 20%
Position in the organization
M&E Officer 26 19%
Data Manager 37 27%
CHW 31 22%
Others 28 20%
No Response 16 12%
4.5.2 Influence of Organizational Factors on Data Quality
44
Staff who reported to have knowledge on data collection and analysis tended to rank quality of data as low (42.9%) compared to their counterparts who tended to rank data quality as high (63.5%). There was no statistically significant relationship between knowledge on data collection and processing and data quality (χ2 (1) =0.496,p= 0.576). The proportion of staff who ranked data quality as high was almost equality distributed across the staff in different positions. However, data managers (29.6%) tended to rank quality of data low compared to CHWs (23.5 %) and M&E officers (16%). There was no statistically significant relationship between staff position and data quality (χ2 (6) =8.662,p= 0.154).
45
Table 4.7 Influence of Organizational Factors on Data Quality
Variable Quality Perception
Chi-square Statistics
Low High
Training on data collection and analysis
Yes 21(30.4%) 13(27.1%) χ2=.154, df=1, p=.836
No 48(69.9%) 35(72.9%)
Knowledge of data collection and processing
Yes 30(42.9%) 19(36.5%) χ2=.496, df=1, p=.576
No 40(57.1%) 33(63.5%) Position in the
organization
M&E Officer 13(16.0%) 13(22.4%) χ2=8.662, df=6, p=.154
Data Manager 24(29.6%) 13(22.4%) CHW 19(23.5%) 12(20.7%) Others 12(14.8%) 16(26.6%)
Frequency of data collection
Weekly 7(8.6%) 0(0.0%) χ2=6.771, df=5,
p=.224 Monthly 7(8.6%) 8(13.8%)
Quarterly 51(63.0%) 39(67.2%) Yearly 16(18.7%) 11(18.9%)
46
staff to equip them with relevant skills. The following quote from one of the interviewee explains:
“…Qualifications of staff does not translate into quality of data. What is required is ensuring position holders in data management have the necessary skills and capabilities to perform it well and meet expectations…”~Data Officer
Some of the implementing organizations have undertaken relevant staff trainings and capacity development programs which have improved skills and ability of staff in enhancing quality of data collected and reported. However, staff skills and capabilities in data management remains a key challenge in data management. The following statement explains:
“…We have conducted trainings on data collection and management for the field
47
CHAPTER FIVE: DISCUSION, CONCLUSIONS AND RECOMMENDATIONS This chapter presents discussion, conclusions and recommendations of the study.
5.1 Discussion
5.1.1 Quality of Data
The study showed that more than half (58%) of the respondents perceived quality of HIV/AIDS data in the CBHIS to be of low quality. This means that predominant perception is that the data doesn’t meet quality expectations for the users. The quality of data was perceived to be poorest on dimensions of timely reporting, completeness and accuracy. This was supported by findings by a report by NACC (2011) which identified completeness, timeliness, accuracy and reliability of the data to be the main causes of poor data quality in community information systems.
48
5.1.2 Socio-Demographic Factors and their Influence on Data Quality
Level of education was shown to influence quality of data in CBHIS. Performance of data staff is to a large extent based on individual motivation to work for a healthier community and passion for dealing with data irrespective of the age of the data handler. Education level of staff handling data at various stages of data management is an important qualification requirement. Higher educational attainment was linked to increase the ability of an individual to articulate complex data quality problems and formulating practical solutions to address them (Chan et al., 2010). Data handled by staff with lower education level was reported to be of lesser quality rank. This was similarly reported in a study by Makombe et al. (2008) in a study which assessed the quality of data aggregated by antiretroviral treatment clinics in Malawi where education attainment was linked to key skills and abilities for effective data management.
Age had no significant association with quality of data. This finding was also reported by Chen et al. (2012) in which age of staff handling data was shown to have no effect on individual job performance when controlling for effect of staff capacity building opportunities. This means that equipping staff with relevant skills and knowledge may have a greater role in influencing data quality rather than basing recruitment and deployment of data staff on their ages; this relationship was not deeply explored and investigated hence no conclusive finding can be made.
49
study found performance and job-match is based on individual skills and abilities to manipulate and manage data sets rather than their sexual orientation.
Experience of data staff was not significantly associated with quality of data in the CBHIS. Experience in data management was reported to provide one with important exposure and learning opportunities which can translate into high performance and improved data quality outcomes but there was no adequate evidence to show that experience influences data quality. This could be also due to the qualitative finding that majority of the data staffs in the CBOs and FBOs were reported to have higher job attrition. Staff turnover is attributed to search for better paying jobs compared to the poorly paid jobs in community-based organizations. These organizations are greatly perceived as platforms for gaining much sought experience key in obtaining good jobs in future hence the high staff turnover. Evidence show that automation of the implementing organization data and information systems can be effectively used to cut high staffing costs (CDC, 2010) and hence maintain few but well-motivated and performing staff hence, lower turnover rates.
5.1.3 Technical Factors influencing Data Quality
50
requires equipping the organizations with adequate resources such as computers to enhance their capacity to collect and manage reliable data.
Many of the data representatives in the implementing organizations had inadequate technical skills to support execution of their roles as data support staff which included computer skills. However, there was consensus that technical skills for computer use and data management and manipulation was important elements for achieving high data quality. Studies agree that quality of data gathered is highly dependent on the technical skills and resources available in an organization (Chan et al., 2010; CDC, 2010). This affirms the need for management to ensure that data managers and handlers are required to ensure that data collected, achieved and reported meets high standards and is free from individual’s and systems’ potential bias. This requires organizations to equip their staff
with sufficient technical skills and resources required in collecting and reporting timely, accurate and comprehensive data through capacity building programmes.
Internet connection had no statistically significant relationship with data quality. This contradicts findings by Venkatarao et al. (2012) in which internet connection was reported to improve efficiency and ease of data collection and management. It was reported as a useful resource in validating data and communicating outcomes. This difference in result is mainly due to difference in study context. Small organizations such as CBOs don’t handle big and complex data which may require complex and
51
advancement of technology, evidence points to increasing need for system automation and hence the need/demand for reliable internet access will grow with time even for smaller implementing organizations at the local and grassroot level (Harlan, 2005).
Performance of Data Quality Checks had a statistically significant association with data quality. However, few organizations performed regular data quality checks which was linked to increase in potential for quality gaps in the data collected, achieved and reported. According to Chen et al (2012), data quality checks is an important exercise which allows organization to improve their data quality assurance measures. He and his colleagues emphasize need for regular but well-coordinated quality audits to strengthen quality standards in the systems. Many organizations don’t have the necessary expertise and capacity including resources to perform comprehensive and effective quality audits. Supporting organizations like NACC and other partners should take responsibility for supporting the grassroots organizations in ensuring implementation and maintenance of simple but effective quality assurance programmes which will improve the data collected and reported.
52
connection and also conduct frequent data quality checks as quality improvement initiatives. The three are self-reinforcing elements should be complementary in the achievement of the organizational quality objectives.
5.1.4 Organizational Factors Influencing Data Quality
The organizational factors studied (staff training on data collection, frequency of data collection, staff knowledge and skills in data processing and staff qualifications) were found to have no individual association with data quality. However they were reported to have a complimentary effect in influencing quality of data reported in the information systems. Study findings by Mann (2008) agreed with this finding in which provision of adequate competent personnel and provision of relevant training were reported to have no significant effect on data quality but were found to be jointly significant in influence data quality. A key observation was that proper funding or resource base is needed to support organizational roles (Freestone et al., 2012) such as employing skilled staff, providing capacity building of staff and procurement of technical facilities such as computers and internet for an effective information management system. This finding is supported by Venkatarao et al. (2012) in which funding was singled out as key determinant of quality of data produced by an information system. A key challenge documented is that Kenya has a tendency to allocate limited budget to health information programming resulting to overreliance on donor support which is not sufficiently sustainable financially.
53
qualifications and skills in the expected areas of responsibility has been linked with collection of incomplete, inaccurate and duplicated data which compromises data quality in the CBHIS. The finding was similar to that reported by Chiba et al. (2012) who argued that the data quality improvement initiatives needs to consider staff capacity and motivation as a complementary resource to information systems and processes improvement initiatives.
A key implication of this study is that CBHIS goal of pursuing data quality should adopt a holistic approach in regards to improving their organizational structures, resources, processes and systems. There should be a shift from vertical quality improvement initiatives such as over-reliance on training and data audits to organizational-wide improvement efforts which focus on existing structures and systems to eliminate potential bottle necks in operations and management.
5.2 Conclusions
The conclusions of this study are drawn from study findings and based on objectives of the study.
Quality of Data
Data in the CBHIS is of low quality mainly due to lack of timeliness in reporting, inaccuracies and incompleteness of the data sets.
Socio-Demographic Factors