MARKETING CAPABILITY AND FIRM PERFORMANCE: AN EMPIRICAL ANALYSIS OF FOOD PROCESSING FIRMS IN NAIROBI CITY COUNTY, KENYA
The Strategic Journal of Business & Change Management. ISSN 2312-9492 (Online) 2414-8970 (Print).www.strategicjournals.com Page: - 544 -
Vol. 6, Iss. 1, pp 544 - 555, March 14, 2019. www.strategicjournals.com, ©Strategic Journals MARKETING CAPABILITY AND FIRM PERFORMANCE: AN EMPIRICAL ANALYSIS OF FOOD PROCESSING
FIRMS IN NAIROBI CITY COUNTY, KENYA Kyengo, J. M., Muathe, S. M. A., & Kinyua, G. M.
Doctoral Candidate, School of Business, Kenyatta University[KU], Nairobi, Kenya Ph.D, Lecturer, School of Business, Kenyatta University [KU], Nairobi, Kenya Ph.D, Lecturer, School of Business, Kenyatta University [KU], Nairobi, Kenya
Accepted: March 12, 2019
ABSTRACT
One of the key drivers of economic growth in Kenya is the Food Processing sector and hence the Kenyan government has provided and implemented key logistics systems to support this important segment of the manufacturing sector. However, despite all this, existing body of contextual literature shows declining performance in this sector for the last three years. Therefore, this study sought to establish the effect of marketing capability on performance of food processing firms in Nairobi City County, Kenya. The study targeted 102 registered Food Processing Firms within Nairobi City County in Kenya and was anchored on dynamic capability theory and resource based view where positivism research philosophy and both explanatory and descriptive research designs were adopted. Multistage probability sampling technique was used to select 31 firms and 155 respondents where unit of analysis was the food processing firms and unit of observation the heads of functional areas in those firms. Collection of Primary data was by use of semi-structured questionnaires where drop and pick technique was used to administer the questionnaires. Descriptive and inferential statistics were used to analyse Quantitative data and content analysis used to analyse qualitative data. The study revealed that marketing capability has a positive effect on performance. The study recommended for management of food processing firms to ensure that adequate resources are acquired and provided for advertising activities. An appropriate policy should be developed to inform investment decisions and practises in relation to advertising.
Keywords: Strategic Assets, Marketing Capability and Organizational Performance
The Strategic Journal of Business & Change Management. ISSN 2312-9492 (Online) 2414-8970 (Print).www.strategicjournals.com Page: - 545 -
INTRODUCTION
Organizations play an important role in our daily lives and indeed their performance represents a key ingredient of economic development of nations globally (Gavrea, Ilieş & Stegerean, 2011). In view of this, many scholars and practitioners consider organizations as engine of economic, social and political progress. The centrality of performance in enhancing the ability of an organization to realize success in the various areas of strategic objectives has made this construct a domineering theme in management research. The dynamic nature of the environment and competition in the global economy has heightened the need to identify the drivers of organizational performance. The scope of scholarly activities in search of drivers of organizational performance has been broadened to integrate both tangible and intangibles organizational assets.
As has been noted by Ortega and Maria (2010), business organizations continually seek ways of improving their performance to compete and operate effectively and aggressively in the market. A central premise of the resource-based view of the firm is that competition in an industry is fundamentally linked to access, control and management of an assortment of strategic assets and capabilities (Barney, 2012). Indeed, the key concern of senior management relates to strategic assets that are fundamental for continued existence and success of firms, and for general economic prosperity in the highly competitive and dynamic global market (Mitrega, 2011). Extant literature is replete with evidence that suggests that corporate resources have potential to enhance the competitive posture of a firm (Gasik, 2011; Rao & Kumar, 2011; Kinyua, Muathe & Kilika, 2015).
According to Youndt et al. (2004), organizational resources that are strategic in nature and have hallmarks of innovativeness are capable of enhancing corporate performance. The resource based view (RBV) holds that the stock of assets held by a firm are an imperative for building competitive
advantage and thus ensuring the strategic survival and success of a firm (Dess, Lumkin, Eisner, Lumpkin & McNamara, 2012). It emphasizes that the stock of resources held by a firm in the form of both tangible and intangible assets have a role in explaining performance heterogeneity in an industry. However, RBV proposes that intangible assets such as information technology capability are dominantly inelastic in supply and are thus not easily transferable across the industry making them a source of competitive advantage and superior performance in the long run.
Researchers have generally viewed capabilities as complex bundles of skills and knowledge embedded in the organizational processes by which a firm’s available resources are transformed into valuable outputs. These capabilities are developed over a long period of time and ultimately become embedded in organizational routines and processes making it difficult for rivals in the marketplace to successfully observe and imitate, thereby enabling firms that are in their possession to enjoy sustainable competitive advantage (Grewal & Slotegraaf 2007). These capabilities are considered by the resource based view of the firm as as part of the assortment of intangible assets which are rare, unique, firm-specific and difficult to imitate and are not only a source of sustainable competitive advantage but have strategic implications in respect of the survival and success of firms in an industry (Morheney & Pandian, 1992; Barney, 2007; Barney & Hesterly, 2010). Notably, marketing capability is fundamental intangible asset that confers a firm with the ability to use available resources to undertake marketing tasks in ways that result in attainment of desired marketing outcomes (Morgan, Katsikeas, & Vorhies 2012).
The Strategic Journal of Business & Change Management. ISSN 2312-9492 (Online) 2414-8970 (Print).www.strategicjournals.com Page: - 546 -
customers’ future requirements and value creation in the production (Kanibir et al., 2014). This can help firms to develop products that are novel or add new abilities or features to current products, to satisfy the needs of their customers for a stable, long lasting and predictable experience despite competition brought about by upcoming technologies and contemporary modes of valuation (Nath et al., 2010). Marketing capability is additionally operated within more appropriate organizational set up. The firm’s competence in effectively managing its capabilities and assets in conformity with prevailing demands of the surrounding environment and external markets is a sign of peak performance.
The firm’s capacity relating to gathering, sharing and dissemination of market information form part of its marketing capability. Others, as stipulated by Theodosiou (2012) include unveiling new products successfully and maintaining good customer and supplier relationship. These all lead to the firm’s success and to achieve this; the firms respond or take action based on their knowledge of the market. Marinova (2004) affirms that dissemination of information about the market is significantly connected to the firm’s aptitude for new opportunities in the market and generally improves on innovation performance. Innovation performance hence rightfully denotes success in the organization’s endeavors to extend its marketing capability.
Regarding the global market performance, Hallback and Gabrielsson (2013) add that marketing capability’s success in the wider market’s performance proves the full potential of value capture, and that the stronger it becomes from an innovation angle. Marketing capability is a major constituent of the success of emerging firms that are striving to penetrate the international markets (Tsai & Eisingerich, 2010). Market sensing and linkages with partners are some marketing capability that has been linked to positive organizational outcomes. Others are customer, functional and networking
capability (Mitrega et al., 2011) which can centrally form part of the marketing strategy aiming for superior performance. Alternatively, they may be adopted for operational use in support of the value chain. The resource based view of the firm proposes that intangible assets such as marketing capability have potential to drive competitive advantage and thus enhance performance of a firm in an industry. Marketing capability has been associated with business strategy, market orientation and as a complementary asset in driving business performance (Mason, 2009; Vorhies, Morgan & Autry, 2009); Morgan, 2012).
The concept of measurement of organizational performance has always been a central concern and focus of scholars in the field of management particularly because organizational performance is considered the most fundamental criterion for evaluating actions and environments of a business enterprise (Short, McKelvie, Ketchen & Chandler, 2009; Gavrea, Ilieş & Stegerean, 2011; Kinyua, Muathe & Kilika, 2015). In this regard, the existing body of theoretical and empirical literature is replete with evidence of scholarly effort that has been expended in the pursuit to refine the definitions and measurement of organizational performance. Moreover, theoretical and empirical literature has presented different thoughts and arguments concerning the concept of organizational performance.
The Strategic Journal of Business & Change Management. ISSN 2312-9492 (Online) 2414-8970 (Print).www.strategicjournals.com Page: - 547 -
all levels of an organization (Richard, 2009). On the other hand, the researchers using non-financial indicators are of the view that non-financial metrics are relevant for embracing the present and predicting future operating conditions of a business enterprise (Raymond & St-Pierre, 2005, Kinyua, Muathe & Kilika, 2015). However, in this empirical investigation, an integrated approach for evaluating performance which emphasizes financial and non-financial indicators was adopted where performance of food processing firms was measured using profitability, market share and customer retention. This position was considered by the researcher so as to leverage on the two distinct set of indicators for evaluating performance as advocated by Kaplan and Norton (2007).
As noted by the Kenya Association of Manufacturers (KAM), food processing firms are a key driver of economic growth in Kenya just as is the case in many economies globally (KAM, 2016). To this effect the Government has favourably responded to the call for implementation of key infrastructures and improvement of general logistics systems and regional market penetration protocols to support this important segment of the manufacturing sector. However, even with the substantial infrastructural support given to the industry, the Kenya National Bureau of Statistics (KNBS) indicates that food processing firms have been experiencing declining performance in the last three years (KNBS, 2016). Statistics data from KNBS have shown that the industry grew at 3.5% in 2014, 3.2% in 2015 and 3.01% in 2016 (KNBS, 2016). This implies that the proportion of contribution of Food Processing firms to the gross domestic product (GDP) has been reducing over time. As a result, the has been notable closures of some of the food process firms such as Kuguru Foods Complex Limited in July 2015, Pecha Food Limited in July 2016, Stawi Food and Fruits Limited in August 2016 and Maz International Limited in March 2017 (KAM, 017).
LITERATURE REVIEW
Resource based view (RBV) of the firm is a managerial framework that was propounded by Penrose (1959) as a theoretical basis for determination of strategic resources with the potential to deliver competitive advantage to a firm. RBV proposes that management should look inside the company to find the sources of competitive advantage as opposed to focussing on the competitive environment. Wernerfelt (1984) further assert that the way that the organization manages its essential assets and resources affects its overall performance. RBV underscores resources and capability attributes which serve to refine the firm's performance, diversity and longevity (Morheney & Pandian, 1992).
RBV presupposes that people are motivated to utilize economic resources available to the maximum possible and the general economic framework informs the logical choices that a firm makes (Barney, 2007). There are three main compositions of resources as presented by Barney and Hesterly (2010) as capabilities, competences and resources. Resources as defined in strategic management text are the stocks of accessible items that the firm possesses. Competencies are the unique strong points that enable the firm to distinguish its deliverables’ quality through technological systems that are built to respond to the needs of the customer. They empower and equip the firm to ably compete with its rivals in the market place. RBV has been found to contribute in strategic management due to the prominence on firm-specific resources which are perceived as key contributors of the firm’s competitive advantage and exemplary performance (Mckelvie & Davidsson, 2009; Levesque, 2010; Anderson, 2011).
The Strategic Journal of Business & Change Management. ISSN 2312-9492 (Online) 2414-8970 (Print).www.strategicjournals.com Page: - 548 -
processes is what defines capability. On RBV, Lockett, Thompsons and Morgensrern (2009) share that it illuminates the firm’s resources and specific abilities that are responsible for it highest rates of return and elevated performance benefits.
The theory of RBV adds to the ways of helping firm managers to check if elements contributing to positive performance exist or not. Locket, Thompson and Morgenstern (2009) affirm that Resource Based View theory helps to bring to the fore elements that contribute towards positive performance of a firm.
This empowers managers to exploit deficiencies in the market to set their firm’s performance at a higher level. Managers are then positioned to be able to bring together resources for sustenance of superior performance. The theory allows the organizational decision makers to select the most critical strategic inputs to acquire and utilize from the industry. Rouse and Daellenbach (2009) and Kenneth at el. (2011) however argued that RBV oversimplifies organizational reality and it tends to assume a linear non-problematic relationship. Further the theory does not take into account the aspect of environmental factors which affect firm's performance. Barney and Hesterly, (2010) expounded that resources that are valuable advances the firms' performance and that rareness creates ideal competition especially where resources in the same category are found in only a few of the firms. Resources that are inimitable are those that would cost too much to duplicate while resources that are said to be non-substitutable have no alternative to accomplishing the same goal or end-product amongst competing firms.
Barney, Wright and Kitchen (2001) maintain that every organization has a varied range of resources that are tangible and intangible. Tangible resources are the visible, material items that an organization possesses such as the structural facilities, raw materials and work equipment. On the other hand, organizational attributes like values, processes,
networks and branding that are not included in the typical managerial and/or accounting systems are classed as intangible resources. The authors add that intangible resources are more likely to lead to competitive advantage and good performance than the tangible resources. In this study, the theoretical propositions of RBV have been used to underpin marketing capability and performance as independent and dependent variables respectively.
Empirical Literature Review
Vicente, Antunes and Malva (2016) conducted an empirical investigation of the impact of marketing capability, technological capability and organizational innovation on export performance. In this study organizational innovation was adopted as an intervening variable for the two capabilities and export performance where export manufacturing firms based in Portugal were surveyed. The postulates of the resource based view of the firm were used to underpin the research variables. The researcher distributed 3000 questionnaires on the e-mail platform and ultimately received back 471 valid questionnaires translating to a response rate of 15.7 percent. The conclusion of the study was that marketing capability has a positive effect on export performance. Despite the contextual bias, the low response rate that fell way below 50 percent of the target respondents could not support making of inferences from the observed respondents as recommended by Mugenda and Mugenda (2003).
The Strategic Journal of Business & Change Management. ISSN 2312-9492 (Online) 2414-8970 (Print).www.strategicjournals.com Page: - 549 -
performance of mobile service provider intermediary organizations. Notably, regression model was chosen and the test for multicollinearity conducted as the only diagnostic test for the model. Although the results of diagnostic test conducted showed that the assumption of multicollinearity was not violated other key assumptions of linear regression were not confirmed in this investigation.
Alharbi (2015) investigated the role of marketing capability in firm's success. Market sensing, customer engagement and partner linking were used as measures of marketing capability and exploratory research design was chosen to guide the implementation of the research strategy. The study found out that in situations where firms operating in both domestic and international markets possess marketing capability, the potential for success is much greater. In essence, marketing capability is proposed to significantly improve the performance of firms innovatively and drive such firms towards attainment of higher market share in foreign markets. Besides the contextual bias that characterised the study, the use of exploratory research design implied that the findings of this study could not be generalised.
Kumbhakar, Wang and Horncastle (2015) found out that there is a significant and positive effect of marketing capability on firm performance. This study interacted different capabilities but ignored the moderating role of the market condition that firms operates. DC theory puts forward the fact that it is the capabilities by which firms’ resources are acquired and deployed in conformance with the market environment that gives explanation to the business performance variance between
different firms. This presupposes that market places are dynamic rather than simple. The theoretical and empirical literature therefore for the basis for hypothesized relationship presented in figure 1 regarding marketing capability and performance.
Independent Variable Dependent Variable Figure 1: Conceptual Framework
Source: Literature Review (2017)
The research hypotheses for this study were as follows;
Ho: Marketing capability has no effect on performance of food processing firms in Nairobi City County Kenya
Ha: Marketing capability affects performance of food processing firms in Nairobi City County Kenya
METHODOLOGY
This study adopted positivism research philosophy which as observed by Mertens (2005) and Creswell (2009), is appropriate for quantitative studies as it is directed at explaining causes which influence outcomes and provides a basis for prediction and generalization. The study utilized both explanatory and descriptive research designs specifically cross-sectional survey as recommended by Saunders, Lewis and Thornhill (2009). The target population of this study comprised of food processing firms registered by KAM and located in Nairobi City County.
Table 1: Distribution of Target Population
Category Turnover Frequency Percentage
Large Over Ksh. 750,000,001 per annum 36 35.2
Medium Ksh.750,000,000 p.a- Ksh.500,000,001 per annum 33 32.4
Small Below Ksh.500,000,000 per annum 33 32.4
Total 102 100
Source: KAM (2017)
Marketing Capability
Advertising investment
Trade mark owned
.
Performance
Profitability
Market Share
The Strategic Journal of Business & Change Management. ISSN 2312-9492 (Online) 2414-8970 (Print).www.strategicjournals.com Page: - 550 -
The researcher randomly sampled 30% of the 102 firms; this translated to 31 food processing firms. However, the unit of observation was the key functional areas in each firm. The key function areas include, Finance, Human resource, marketing, ICT, Operations, internal audit, procurement and supplies, research and development, store.
Before processing the responses, the collected data was prepared for a statistical analysis. Validation and checking was done after the questionnaires had been received from the field.
Descriptive and inferential statistics were used to analyze collected data that was quantitative; to aid this STATA version 12 software was used.
The study was guided by the statistical equation presented in model 1
Y = β0 +β1X1 + ε ...model 1
Where;
Y = Performance
X1= Marketing Capability
β 0 = Beta coefficient for the constant
β1 = Beta coefficient for the independent variable ε = Error term
FINDINGS AND DISCUSSION
The researcher received 110 dully filled-in questionnaires from the field confirming that the response and non-response rate were
approximately 73 and 37 percent respectively. The successful response rate of 73.3 per cent was well within the acceptable threshold recommended by Mugenda and Mugenda (2008) for facilitating further statistical analysis for the purpose of making generalizations and conclusions. In the views of Mugenda and Mugenda, a response rate of 50.5% is adequate for analysis and reporting; a rate of 60% is good while a response rate of 70% and over is excellent.
Descriptive Statistics
Sample mean and sample standard deviation were utilized by the researcher to arrive at appropriate summary measures for describing the characteristics of the sample. Descriptive statistics was analyzed on the responses obtained from the respondents on the two variables at the center of this investigation. The results of this analysis formed the basis for statistical analysis and making of inferences. The descriptive statistics for the distinct items and the corresponding aggregate scores for the independent variable were presented in Table 2.
Table 2: Descriptive Statistics of Marketing Capability
Descriptions and characteristics n Mean Std Deviation
Our company is often the first to market new product and services 110 4.09 0.785
Advertising always increases organization sales 110 4.16 0.784
Trademark of the organization increase company profit 110 4.28 0.658
Novel marketing is utilized by the firm 110 4.25 0.513
Aggregate score 4.20 0.685
Source: Survey Data (2018
The results displayed in Table 2 showed that the aggregate sample mean score for marketing capability was 4.20 and the corresponding aggregate sample standard deviation was 0.685. In this case, the aggregate sample mean score was close to 4.00 when mapped on the five point Likert scale that was used for measuring and weighting
The Strategic Journal of Business & Change Management. ISSN 2312-9492 (Online) 2414-8970 (Print).www.strategicjournals.com Page: - 551 -
to the mean sufficiently demonstrates that responses gathered were clustered around the aggregate mean response was 4.28 for advertising activities and the smallest sample mean was 4.09. Similarly, sample standard deviation ranged between 0.513 and 0.785. These levels of standard deviation relative to the mean confirmed that there the variability associated with the responses was low and thus it was possible to infer the parameter of population mean from the calculated sample mean. Moreover, the aggregate sample mean and standard deviation attained from the responses
confirmed that the activities adopted for measuring marketing capability were considered important for performance of food processing firms in Nairobi City County.
The researcher conducted analysis of sample measures using the data on responses to the statement regarding performance of food processing firms. This analysis yielded sample means and sample standard deviations for individual and aggregate responses as shown in Table 3.
Table 3: Descriptive Statistics of Firm Performance
Profitability n Mean Std Deviation
Profitability in 2012 110 3.36 1.11
Profitability in 2013 110 3.34 1.12
Profitability in 2014 110 3.37 1.11
Profitability in 2015 110 3.33 1.10
Profitability in 2016 110 3.40 1.13
Aggregate Score for profitability 3.36 1.11
Market Share
Market Share distribution in 2012 110 4.15 0.730
Market Share distribution in 2013 110 4.27 0.597
Market Share distribution in 2014 110 3.92 0.774
Market Share distribution in 2015 110 4.08 0.890
Market Share distribution in 2016 110 4.00 0.796
Aggregate Score for market share 4.08 0.757
Customer Satisfaction
Is customer loyalty a priority in your organization 110 4.13 0.756 Does the number of customer complains impact on your
organization performance
110 4.29 0.646
The overall satisfaction is of value to your organization 110 4.33 0.593 Our customer retention has increased performance 110 4.39 0.436
Aggregate scores for customer satisfaction 4.29 0.608
Aggregate scores for performance 3.88 0.842
Source: Survey Data (2018)
The results displayed in Table 3 showed that the aggregate sample mean and sample standard deviation for profitability food processing firms in the five years that were considered for this survey were 3.36 and 1.11 respectively. The implication of these results was that on average the respondents concurred that food processing firms made profits
The Strategic Journal of Business & Change Management. ISSN 2312-9492 (Online) 2414-8970 (Print).www.strategicjournals.com Page: - 552 -
respondents cocurred that their firms market share ranged between 51 and 75 per cent of the market in the five years involved in this survey.
Similarly, the results showed that the aggregate sample mean score for customer satisfaction was 4.29 with a corresponding aggregate sample standard deviation score of 0.608. This value of aggregate sample mean approximates to a score of 4.00 on the five-point rating scale adopted by the researcher. This implies that on average the respondents concurred that prioritizing customer loyalty, customer complaints, value of customer satisfaction and the effect of customer retention on increased performance are important in their food processing firms. Moreover, the overall aggregate sample mean and sample standard deviation for responses on performance measured on the basis of profitability, market share and customer satisfaction were 3.88 and 0.842 respectively.
Computation of the variability of responses regarding performance yielded a value of 21.7 percent as the coefficient of variability. This level of variability was low and therefore the sample mean for performance was a stable and reliable estimator of the true (population) mean. The aggregate scores also demonstrated that the activities that were used to indicate performance were practiced in food processing firms.
Test of Hypothesis
Simple linear regression analysis was performed using STATA in order to estimating a statistical model for to determining the effect of marketing capability on performance of food processing firms in Nairobi City County, Kenya. To this end, marketing capability was regressed on performance. The results of this statistical analysis
were reported in Table 4.
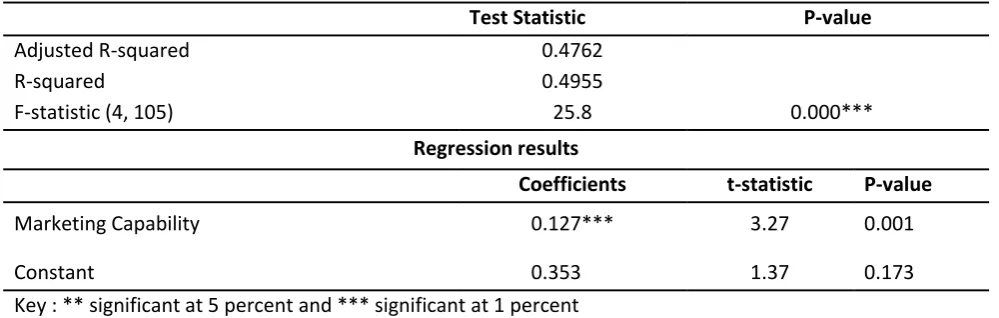
Table 4: Output of Regression Analysis
Test Statistic P-value
Adjusted R-squared 0.4762
R-squared 0.4955
F-statistic (4, 105) 25.8 0.000****
Regression results
Coefficients t-statistic P-value
Marketing Capability 0.127*** 3.27 0.001
Constant 0.353*** 1.37 0.173
Key : ** significant at 5 percent and *** significant at 1 percent Source: Survey Data (2018)
The output of the regression analysis in respect of the estimated model demonstrated that the value of R-squared was 0.4955 which corresponds to a product moment correlation coefficient of 0.703 signifying a strong positive linear relationship between marketing capability and performance. R-squared as a statistical measure basically indicates how close the observed data are to the fitted regression line. Indeed, R-squared provides the percentage of variation of the response variable
The Strategic Journal of Business & Change Management. ISSN 2312-9492 (Online) 2414-8970 (Print).www.strategicjournals.com Page: - 553 -
The output of simple linear regression analysis relating to the F-statistic showed that the statistical model that was estimated sufficiently fitted the set of data observed from the field. Generally, if the calculated F value in a test is larger than the critical F statistic, the null hypothesis is rejected. Conversely, where the calculated probability is less than the level of significance adopted, the null hypothesis is rejected. The value of F-statistic (1, 105) for the estimated linear model was 25.8 at a level of significance of 0.000 which is less than the p-value of 0.05 that had been chosen as the statistical threshold for inferences at 95% level of confidence. Consequently, the linear regression model that was estimated provides a good fit to the observed data. In this case, the coefficient of determination that indicates the explanatory power of marketing capability on performance of food processing firms did not occur by chance and therefore can be attributed to the four dimensions of independent variable chosen for this study.
Furthermore, the output of the regression coefficients that provides information on the parameters regarding the y-intercept and slopes of the regression line corresponding to the predictor variable. The parameters of the model signified by the beta coefficients are in essence a representation of the actual effect of marketing capability on performance of food processing firms in Nairobi City County, Kenya. The results of regression coefficients displayed in Table 4 were used to generate the statistical model below.
Performance = 0.353 + 0.127 Marketing Capability... Model 2
The calculated probability values of 0.001 for the parameter associated with the predicator variable was less than the 0.05 threshold adopted as criterion for testing corresponding hypotheses. However, the probability value of 0.173 for the parameter associated with the y-intercept is greater than the 0.05 threshold adopted as the criterion for hypothesis testing. Therefore, in the case where the predictor variable was held at a constant zero,
performance of food processing firms surveyed would be at 0.353, however, with a probability of 0.173 comparatively greater than 0.05, there is no sufficient statistical evidence to reject the null hypothesis that the y-intercept is equivalent to zero. Consequently, the researcher rejected the null hypothesis implying that at 95 percent level of confidence, marketing capability has no statistically significant effect on performance. On the contrary, the results of regression analysis revealed that when marketing capability is increased by 1 unit, performance of food processing firms increases by 0.127 units and vice versa. The study therefore concludes that marketing capability affects performance of Food Processing Firms in Nairobi City County, Kenya.
The finding that marketing capability positively affect the performance of food processing firms are in consonance with those of researchers with similar past studies (Karanja, Muathe & Thuo, 2014; Alharbi, 2015; Kumbhakar, Wang & Horncastle, 2015; Vicente, Antunes & Malva, 2016) who found out that there is a significant and positive effect of marketing capability on firm performance. The conclusion are in resonance with the postulates of dynamic capabilities theory which posit that the manner in which organizations develop specific expertise and abilities in line with change in the business environment is in the long run connected to their business processes, their position in the market and available opportunities (Teece & Pisano, 1994; Teece et al., 2007). Moreover, the findings are consistent with the views of Clarke, Seng and Whiting (2011) that competitiveness involves constantly working to discover new combinations that continuously seek to improve their expertise in the market place.
The Strategic Journal of Business & Change Management. ISSN 2312-9492 (Online) 2414-8970 (Print).www.strategicjournals.com Page: - 554 -
processing firms to sense and respond to changing market needs such as moves made by the competition, technological advancements, dynamics in consumption behavior and patterns among others. It provides a basis for food processing firms to leverage on the available resources for value creation as well as enabling firms to anticipate the explicit and latent needs of customers. Marketing capability was observed to complement role played by research and development through provision of substantial information relating to the behavior of the market.
Conclusion and Policy Implication
The study sought to investigate the effect of marketing capability on performance of food processing firms. Marketing capability was measured using indicators such as advertising investment and firm’s trademark. The summary measures of sample mean and sample standard deviation associated with marketing capability confirmed that the set of activities that signified this variable were practiced in food processing firms. Similarly, the low variability demonstrated that the responses from the participants were clustered around the mean response relating to marketing capability. Analysis of inferential statistics demonstrated that marketing capability positively affect performance of food processing firms in Nairobi City County, Kenya.
The findings from inferential analysis indicated that marketing capability has a statistically significant effect on performance. Therefore, the researcher concluded that marketing capability positively affects performance of food processing firms in Nairobi City County, Kenya. It is therefore imperative for management of food processing firms to ensure that adequate resources are acquired and provided for advertising activities. An appropriate policy should be development to inform investment decisions and practices in relation to advertising.
Suggestions for Further Research
The findings and inferences made from this study were delimited to the constructs of marketing capability and performance in the context of food processing firms in Nairobi City County. It is therefore necessary for future researchers to undertake similar or replicative empirical studies in food processing firms in other Counties in Kenya as well as extend the investigation to organizations in other industries and sectors in order to validate the findings and conclusions of this study. Similarly, other factors that may not have been accounted for in the estimated model as implied by the coefficient of determination may also warrant the attention of future researchers.
REFERENCES
Barney ,J., Wright, M. & Ketchen, D. J. (2001). The RBV of a firm; Ten years after 1991, Journal of Management 27 (6):.625 -641.
Clarke, M., Seng, D., & Whiting, R. H. (2011). Intellectual capital and firm performance in Australia. Journal of Intellectual Capital, 12(4): 505–530.
Frink (2011). An examination of Employee Reactions to perceived corporate citizenship, Journal Of Applied Psychology.
Gavrea, C., Ilieş, L. & Stegerean, R. (2011). Determinants of Organizational Performance: the Case of Romania. Management and Marketing Challenges for the Knowledge Society, 6(2), 285-300.
The Strategic Journal of Business & Change Management. ISSN 2312-9492 (Online) 2414-8970 (Print).www.strategicjournals.com Page: - 555 -
Kenya Association Manufactures of Kenya, (2016). Quarterly sector Statistics Report 2017. Retrieved 2017, June 16 from www.kam.go.ke.
Krasnikov & Jarachandran (2008).Do market orientation and innovation improve organizational performance. An international and comparative review of the effects page 19.
Nkatha, G. (2012). Competitive advantage and performance. Business Journal Africa, 30-50
Pebrianto, A. & Djumhur, S. K. (2013). Influence of Information Technology Capability, Organizational Learning, and Knowledge Management Capability on Organizational Performance: A Study of Banking Branches Company in Southern Kalimantan Province. Information and Knowledge Management, 3(11), 112-120.
Remenyi, D. (2009). Multi-tasking: The uncertain impact of technology on knowledge workers and managers: The Electronic Journal Information Systems Evaluation, 12(1).
Sambomirthy V., Bharadwaj A. & Grover V. (2003). Shaping agility through digital options: Re-conceptualing the role of information technology in contemporary firm.
Santhanam, R. & Harton, e., (2003). Issues in linking Information Technology capability to Firm performance.
Teece, D, J., (2007). Explicating dynamic capabilities: the nature and micro foundations of (sustainable) enterprise performance. Strategic Management Journal 28:1319-1350.
Teece, D., & Pisano, G. (1994). The dynamic capabilities of firms: An introduction. IIASA Working Paper. IIASA, Laxenburg, Austria, WP-94-103 Retrieved from http://pure.iiasa.ac.at/4109/
Turulja, L. & Bojgoric, N. (2016). Innovation and Information Technology Capability as Antecedents of Firms’ Success. Interdisciplinary Description of Complex Systems, 14(2), 148-156.
Vicente, M., Antunes, M. J. & Malva, M. (2016). The Impact of Marketing Capabilities, Technological Capabilities and Organizational Innovation on Export Performance. Universidade Europeia. ICEMC 2016, 328-337.
Ward J. & Peppard J. (2002). Strategic planning for information systems (3rd Edition)