Available Online atwww.ijcsmc.com
International Journal of Computer Science and Mobile Computing
A Monthly Journal of Computer Science and Information Technology
ISSN 2320–088X
IMPACT FACTOR: 6.199IJCSMC, Vol. 8, Issue. 9, September 2019, pg.18 – 23
LEAF DISEASE DETECTION AND DISEASE
IDENTIFICATION USING ARTIFICIAL
DEEP LEARNING NEURAL NETWORK
S.Dhivya
1; Dr. R.Shanmugavadivu
2 1Research Scholar, Department of Computer Science, PSG College of Arts and Science, Coimbatore, India 2
Assistant Professor, Department of Computer Science, PSG College of Arts and Science, Coimbatore, India
[email protected], [email protected]
ABSTRACT: Plant disease analysis is to identify the percentage and the exact location of plant diseases caused by viruses, fungi and bacteria. When one part of the leaf is affected by disease and another part is also affected as soon. In our work, identifying the disease spot at early stages, the growth level of the diseases. The classification is one of the most energetic research and relevance area of neural network. Multilayer perception is used to classify the leaf diseases and the back propagation algorithm is used to calculate the disease spot by total area of the leaf. Implementation has been done by using MATLAB 2017a simulation tool which generates better result for clustering algorithm.
Keywords: Plant disease, Neural network, classification, multilayer perception, Back propagation.
I. INTRODUCTION
Now days, a new idea of clever farming has been introduced the place the field stipulations are managed and monitored the use of the self working systems. The self-recognition of the ailment is primarily based on the identification of the symptoms of disease. So that statistics about the disease occurrence ought to be rapidly and precisely supplied to the farmers, professionals and researchers. This in flip reduces the monitoring of large discipline by using human being. In disease recognition from photograph the key is to extract the characteristic feature of the diseased region. According to the disorder the features can also vary. The aspects that are extracted from the image are color, shape, texture etc. Sometimes for detection of the ailment more points are extracted and this extracted feature would amplify the hardware as properly as software program cost. This similarly reasons extend in the complexity and the computation time.
A. Fungal:
Fungi area unit the fore most common parasites inflicting disease. Most area unit microscopic plants that kill living inexperienced plants or on dead organic material. Once they attack living plants, an illness results. Fungi typically turn ou t spores that, once carried to a plant, will begin an infection. So as for plant life spores to start new infections, adequate wet and therefore the right air temperature area unit needed. A plant wound is typically additionally required as an entry for th e plant life. Plant life diseases area unit common throughout wet and wet seasons.
For identifying fungal diseases in leaves and their symptoms
Leaf Spots
Leaf Blights
Rust
Downy Mildew
Powdery mildew
A symptom of un-wellness could be a visible impact of disease on the plant. Symptoms could embody a detectable amendment in color, form or operate of the plant because it responds to the microorganism. The Symptoms of fugal diseases are:
Birds eye spot
Damping off of seedlings
Leaf spot (septoria brown spot)
Chlorosis (yellowing of leaves) B. Bacteria
Bacteria are single-celled microscopic organisms. Some attack living plants and cause plant disease. Bacteria can be carried from plant to plant by wind, rain splash, insects and machinery.
Bacterial disease signs (difficult to observe, but can include):
Bacterial ooze
Water-soaked lesions
Bacterial streaming in water from a cut stem Bacterial disease symptoms:
Leaf spot with yellow halo
Fruit spot
Canker
Crown gall
Sheperd’s crook stem ends on woody plants C. Viruses:
Viral disease signs:
None – the viruses themselves can’t be seen Viral disease symptoms:
Mosaic leaf pattern
Crinkled leaves
Yellowed leaves
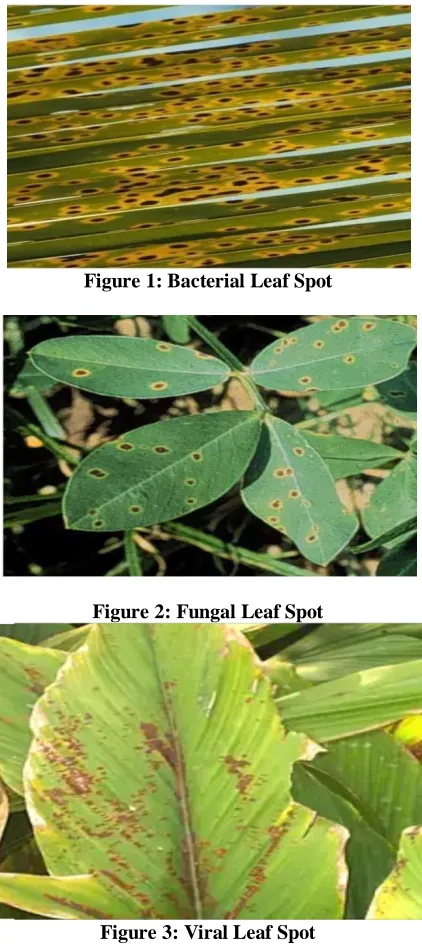
Figure 1: Bacterial Leaf Spot
Figure 2: Fungal Leaf Spot
Figure 3: Viral Leaf Spot
III. STANDARED AREA DIAGRAM:
It divides rust intensity into five grades representing 0,5,10,20 and 50% of leaf area occupied by the visible or sporulating rust pustules. The highest grade(50%) represented maximum possible cover. A common formula as fallows is generally used to calculate the average infection index, sometimes also known as disease index or percent disease index, which is calculate as fallows.
Percent Disease Index(PDI)=
Severity estimates from fairly small areas can be combined cover large areas, villages or state. This overall index can be obtained by using the formula.
0: No diseases on leaf and pods.
1: Small brown spot covering < 1% leaf area( pin points spot on pod). 3: Brown sunken spot 1-10% leaf area (< 1% pod area).
5: Brown spot 11-25% leaf area (1-10% pod area).
7: Circular brown sunken spots 26-50% leaf area (11-25% pod area). 9: Circular to irregular >51% leaf area(> 25% pod area).
IV. CLASSIFICATION ALGORITHM:
The image classification fallows the steps as pre-processing, segmentation, feature extraction and classification. In the classification system information is incredibly vital that contains predefined sample patterns of objects into account that compare with the test object to classify it appropriate classes. Image classification is a crucial task in various fiel ds such as statistics, remote sensing, biological images and medical images. In a typical organization images is cap tured by a camera and some are taken through web. Multilayer and back propagation algorithm is used to classify the diseased leaf images and calculate the affected leaves from various plant leaves.
A. MULTILAYER PERCEPTION:
The supervised learning drawback of the multilayer perception is often solved with the back propagation algorithm. The algorithmic rule consists of two steps: with in the forward pass, the expected outputs are calculated resembling the given inputs. Within the backward pass, partial derivatives of the price perform with regard to the different parameters are propagated back through the network. A typical multilayer perception (MLP) network consists of a collection of supply nodes forming the input layer, one or more additional hidden layer of computation nodes, and an output layer node. The sign propagates through the network layer – by – layer. Multi layer feed forward back propagation algorithm is employed to coach the network and tests the performance of the network. Multilayer perception network square measures usually used in supervised learning issues this implies that there is a training set of input-output pairs and also the network should learn to model the dependency between them. Multilayer perception (MLP) network may be a well-liked learning algorithm rule in an exceeding sense that neural network is aware of the required output and adjusting of weight coefficient is finished in such means, which calculated and desired outputs square measure as close and possible.
B. FEED FORWARD BACK PROPOGATION METHOD:
V. RESULT AND DISCUSSION
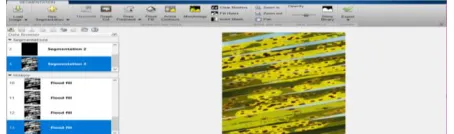
All the experiments are implemented by RMatlab 2017a. The sample of leaf images belonging to 3 classes (i.e Bacterial, fungal and viral). The database consists of three plant leaves that have various shapes, colors and sizes. We checked the plant leaves based on the classes and split the images based on that. The classes contain more number of leaves that are differentiated from the plant leaves. Finally, the sample output of work is given below.
Figure 4: Sample output Segmented Bacterial Spot Image
Figure 5: Sample Color Segmentation for Viral Leaf Spot
Figure 6: Sample Disease Identification using Multilayer Perception algorithm
Disease Grade Total Rating Number of Ratings
0 5 0
1 5 5
3 8 24
5 4 20
7 8 56
9 4 36
Total 34 186
Table 1: Disease Severity Grade chart
(PDI)=
Sum of all disease rating = 186 Total Rating = 34
VI. CONCLUSION
In our work, we would like to conclude that is an efficient and accurate technique for a detection of bacteria, fungal and viral diseases of plant leaves. In our work plant leaf diseases are detected by Multilayer perception classification algorithm. The Multilayer perception classifies based on color, shape and texture of the images based on the plant leaves. A Back propagation neural network for recognition of leaves is implemented in this paper. The training set contains minimum three spices for each type of leaf in each data file. Using more number of species in training set and number of output nodes can increase the detection ability. Using quick training algorithms without losing recognition performance can enhance the scope of this work.
REFERENCES
[1] Jean Beagle Ristaino: Tracking[Augus2006] The Evolutionary History of The Potato LateBlight Pathogen with historical Collections, Outlooks on Pest Management.
[2] H.AI-Hiary, S.Bani-Ahmad, M.Reyalat, M.Braik&Z.AIRahamneh [2011] Fast and accurate detection and classification of plant disases, International Journal of Computer applications90975-88870, Volume 17-no.1, pp 31-38).
[3] Mr.Pramod and S. Landge, “Automatic Detection and Clssification of Plant Disease through Image Processing”, International Journal of Advanced Reasearch in Computer Science and Software Engineering, Volume 3, Issue 7, ISSN: 2277 128X,2013.
[4] Jayme Garcia, ArnalBarbedo, “Digital Image Processing Techniques for Detecting, Quantifying and Classifyi ng Plant Diseases”, Springer Plus, 2013.
[5] M. Egmont-Petersen, “Image processing with neural networks”, Elsevier, Volume 35, Issue 10, October 2002, Pages 2279-2301, 2002.
[6] Georgr, E.F, Plant propagation by tissue culture. Part 1: The technology.1993 No.Ed. 2pp.vii + 574 pp.ref.71 pp.of. [7] T Rumpf and L.Plumer, Early Detection and Classification of Plant diseases wit support vector Machines based on Hyperspectral reflectance, Computers and Electronics in Agriculture, Volume 74, Issue 1, October 2010, Pages 91 -99. [8] Sindhuja Sankaran, Ashish Mishra, Reza Ehsani, Cristina Davis, A review of advanced techniques for detecting plant diseases, Computers and Electronics in Agriculture 72 (1), 1-13,2010.
[9] Vijai singh and A.K.Misra, Detection of Plant leaf diseases using image Segmentation and Soft computing techniques, Information Processing in Agriculture 4 (2017) 41-49.
[10] Kulkarni anand H, Ashwin Patil RK, Applying Image processing technique to detect plant diseases. Int J Mod Eng Res 2012;2(S):3661-4.
[11] Jagadeesh D. Pujari, Rajesh Yakkundimath, Abdulmunaf S.Byadgi, Image Processing Based Detection of Fungal Diseases in Plants, International Conference on Information and Communication Technologies (ICICT 2014).
[12] Chen. YR, Chao K, Moon SK, Machine Vision Technology for agricultural Applications. Compuetr and Electronics in Agriculture;2002, vol.36, no.2-3,pp.173-191.
[13] Megha S, Niveditha C.R, Sowmyashree.N, Vidhya.K, Image Processing System for Plant Disease Identification by Using FCM Clustering Techniques, International Journal of Advance Research, Ideas and Innovations in Technology, ISSN: 2454-132X,Volume 3,Issue2.
[14] Nikos Petrellis, “Plant Disease Diagnosis Based on Image Processing, Appropriate for Mobile Phone Implementation”,
7th International Conference on Information and Communication Technologies in Agriculture (HAICTA), pp.238 -246,2015.
[15] Savita N.Ghaiwat and Parul Arora, “Detection and Classification of Plant Leaf Diseases Using Image Processing Techniques: A Review, International Journal of Recent Advances in enginerring and Technology(IJRAET), pp.2347 -2812,2014.
[16] Prof.sanjay B. Dhaygude, Mr.Nitin P.Kumbhar, “Agricultural plant Leaf Disease Detection Using Image Processing” IJAREEIE, vol.2(1),pp. 599-602, January 2013.
[17] Jayamala K. Patil, Raj Kumar, “Advances in Image Processing For Detection of Plant Diseases” JABAR, vol.2(2),pp.135-141, June-2011.
[18] Sachin D.Khirade, A.B.Patil, Plant Disease Detection Using Image Processing, International Conference on Computational Communication Control and Automation,2015.
[19] Ananthi, S. Vishnu varthini, Detection and Classification of Plant Leaf Diseases, International J ournal of Research in Engineering and Applied Sciences, Volume 2, Issue 2 (February 2012) ISSN: 2249 -3905.