Journal of
Volume 11, Number 4 July 1958RANGE MANAGEMENT
Some Factors Affecting Establishment of
Desirable Forage Plants in Weedy Bluegrass
Pastures of Eastern’ Nebraska1
MILO L. COX AND M. K. MCCARTY
Assistant Agronomist, Agricultural Experiment Station, University of Nebraska, and Research Agronomist, Crops Research Division, Agricultural Research Service, U. S. Department of Agriculture, Lincoln, Nebraska
In general the farm pastures of eastern Nebraska have had a his- tory of deterioration similar to the larger grazing areas of the region. This history has usually consisted of varying periods of heavy grazing pressure followed by a reduction of the native warm-season grasses and their eventual replacement by Ken- tucky bluegrass, Pea pratensis, and both annual and perennial weeds. This process has been slow, and the decline in total production was seldom noticed, probably because the farmer or rancher had no handy method of measuring the a c t u a 1 forage yield.
Many attempts have been made to increase forage yields, especially in areas where pas- tures were of such size as to represent a significant part of the area producing the farm in- come. Various methods have been employed such as increased levels of fertility, control of weed populations, mechanical r e n o v a t i o n, establishment of
1PubZished with the approval of the Director as Paper No. 824, Journal Series, Nebraska Agricultural Ex- periment Station. Nebraska Agr. Exp. Sta. and Crops Res. Div., A.R.S., U.S.D.A., cooperating.
more productive grasses and leg- umes, or some combination of these practices. Most workers have eventually come to the con- clusion that if maximum produc- tion is to be obtained, the per- sistent though unproductive spe- cies should be replaced by more productive ones.
The primary objective of this study was to determine the ef- fects of seed b e d preparation methods and weed control prac- tices on the establishment of de- sirable species in areas where Kentucky bluegrass and weeds predominated. The initial ques- tion to be answered was how much tillage was necessary to kill the bluegrass, or reduce it to such an extent that reseeded grasses and legume seedlings could become established. It was apparent, however, that in a weedy pasture sufficient tillage to drastically reduce the blue- grass resulted in large increases in annual weeds, which were of ten responsible for subsequent failure of the seedlings to sur- vive their first year. Therefore the second question to be an- swered was what weed control method could be applied in the seedling year that would control weed populations in order that
159
the reseeded grasses and legumes could survive their critical seed- ling period. This would be par- ticularly critical in years of moisture deficits: a condition which occurred during the course of this study.
-__ _ _-
160 MILO L. COX AND M. K. MCCARTY
probably would be advantageous on stony land or on highly erod- able slopes.
Experimental Area The area selected for this study was a portion of the Arthur Hornung farm pasture, 8 miles south of Lincoln, Nebraska2. The pasture had been used for the grazing of beef cattle for fifty years and had never been plowed.
The botanical composition of this pasture was well known as detailed vegetative analyses had been made over a four-year period by Klingman (1952) and McCarty (1953). There was a well established bluegrass sod and large amounts of hairy chess
(Bromus commutatus). These
two species represented about 90 percent of the grasses present. Annual and perennial broad- leaved weeds were abundant, and about 55 percent of the total dry matter produced each year was produced by unpalatable species. The soil was a deep, fer- tile, Judson-Wabash silt loam.
Methods and Materials The experimental area was di- vided in half and two separate experiments were set up; one us- ing smooth bromegrass as the re- planted species and the other us- ing a warm-season grass mixture. This mixture consisted of switch- grass, sand lovegrass, side-oats grama, and blue grama at the respective rates of 5, 2, 2, and 5 pounds per acre. The two experi- ments were conducted simul- taneously except for dates of planting, spraying and mowing. All of the treatments were ap- plied to the warm-season grass mixture one month later than to the bromegrass. A split-plot de- sign was chosen with seedbed preparations as the whole plots and weed control treatments as the subplots. Each experiment was replicated four times.
2Appreciation is expressed to Mr. Arthur Hornung for providing the
No detailed data were collected in the year that the reseeding was done. Survival through the year following seeding was con- sidered to be a better index to successful establishment than counts in the seedling year. Therefore the seedbed prepara- tions, plantings, and weed con- trol treatments were done in the spring of 1952, and the data col- lected in the summer of 1953.
Three methods of seedbed preparation were utilized in this study: plowed, disked, and no tillage. These were selected pri- marily because they represented three distinct degrees of reduc- tion of the bluegrass sod, and secondarily because they could readily be accomplished by most land-owners with their available machinery.
The plowed portion of the area was plowed five inches deep with
a moldboard plow, disked and then harrowed with a spike- toothed harrow. The disked por- tion was disked twice and then spike-tooth h a r ro w e d. The bromegrass was broadcast at the rate of 15 pounds of seed per acre. The warm-season grass mixture was broadcast at the rate of 4 pounds per acre, and the entire area was gone over with a treader to cover the seeds and firm the soil. Alfalfa and sweetclover were included in some plots as indicated below.
The weed control practices were as follows:
No weed control (checks) Mowed (hay removed) Mowed (hay not remowed) Sweetclover (no weed con-
trol)
Sweetclover (mowed) Alfalfa (no weed control) Alfalfa (mowed)
Table .I .Number of weed stems per 2’ x 4’ quadraf in bromegrass and warm- season grass mixture plots one year after reseeding. Lincoln, Ne- braska, 1953.
_____- Warm Season Grass
Mixture Brome -
Ironweed, Ironweed,
False Vervain, False
Boneset, Annual Boneset, Dandelion Ragweed Dandelion -__ ..~_____~
Plowed
No weed control 3.25 435.65 7.60
Mowed (R) # 3.55 450.10 4.50
Mowed (NR) # 1.05 304.75 4.80
Sw.Cl.-no weed control 0.30 544.40 6.00
Sw.Cl.-mowed 1.55 405.90 1.50
Alfalfa-no weed control 1.15 485.85 4.95
Alfalfa-mowed 2.75 243.45 3.65
Average 1.94” 411.44” 4.71*
Disked
No weed control 10.75 145.60 47.70
Mowed (R) # 27.05 247.15 43.35
Mowed (NR) # 12.70 125.35 28.75
Sw.Cl.-no weed control 9.10 181.45 45.05
Sw.Cl.-mowed 19.85 193.20 36.35
Alfalfa-no weed control 17.15 172.05 32.15
Alfalfa-mowed 25.00 192.95 28.70
Average 17.37 179.68 37.44
No seedbed preparation
No weed control 23.05 75.40 42.50
Mowed (R) # 22.65 95.85 44.90
Mowed (NR) # 14.35 66.70 21.90
Sw.Cl.-no weed control 12.70 93.90 40.30
Sw.Cl.-mowed 28.75 63.75 39.20
Alfalfa-no weed control 15.15 48.50 44.00
Alfalfa-mowed 27.95 92.00 37.05
Average _~__.____ 20.66 80.44 ______ 38.55 --
# R-herbage removed; NR-herbage not removed.
Vervain, Annual Ragweed
319.65 306.80 256.45 272.45 219.60 193.55 193.10 251.66
194.80 238.20 253.60 182.60 162.95 152.70 219.05 200.56
85.05 150.70 85.30 57.10 124.60 56.30 188.25 106.76 _
ESTABLISHMENT OF DESIRABLE PLANTS IN WEEDY BLUEGRASS PASTURES
161
I-
Disced
Reseeded to Warm-Season Grass Mixture
No Seedbed Preparation
Reseeded to Bromegrass
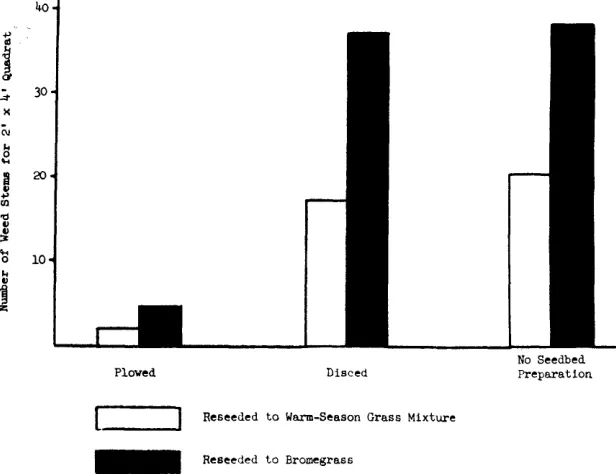
FIC~JHE 1. Effect of seed bed preparation on the number of stems of the three most abundant perennial weeds (ironweed, false boneset, and dandelion) one year after reseeding.
As a sunnlement to the seven
treatment; L listed above there
were five additional treatments
applied to the plowed portions of
the experiment.
2,4-D ester (1 lb. per acre)
Sweetclover-mowed 4” high,
hay not removed
Sweetclover-mowed 1” high,
hay removed
Alfalfa-mowed 4” high, hay
not removed
Alfalfa-mowed 1” high, hay
removed
The supplemental treatments
were included in order to obtain
additional information on the ef-
fects of height of mowing and
removal of the hay, where leg-
umes were included in the mix-
ture, and the effects of 2,4-D
where no legumes were seeded.
Collection of the Data
The two classes of herbaceous
vegetation
measured in this
study were grasses and grass-
like forms, and broad-leaved
plants that included both broad-
leaved weeds and legumes. Since
these two classes of vegetation
were present in vastly different
numbers, they required dis-
tinctly different
methods of
measurement. A basal density
method using a modified line-
transect was used on the grasses
and grass-like plants, while a
quadrat method was used to
measure the broad-leaved popu-
lations. Such a system of meas-
I
uring two classes of vegetation
by two different methods yielded
data of two types which were
not directly comparable. How-
ever, the statistical analyses
were handled separately; grasses
were compared with grasses be-
fore and after treatment, and
broad-leaved plants were com-
pared on a before and after treat-
ment basis, so no conflict was in-
curred by the use of different
methods.
Experimental Resulfs Effects of Seeclbed Preparafion
The effects of plowing were
very similar in both the brome-
grass experiment and the warm-
season grass mixture experi-
ment. In both cases the stands
of perennial weeds were materi-
ally reduced. The three most im-
portant perennial weeds, iron-
weed, (Vernonia
baldwini)
,false
boneset
(Kuhnia glutinosa),
and
dandelion (Taruxucum
offici-
nule), were reduced 90 percent
(Figure 1 and Table 1). Plow-
ing also reduced the bluegrass,
hairy chess, and sand dropseed
(Sporobolus
cryptundrus)
by ap-
proximately 80 percent (Figure
2 and Table 2).
Plowing was decidedly supe-
rior to disking or no seedbed
~lcwed Disced MO Seehed PlOWA DiSWd KG Seedtml
Preparnticn Preporation I ” W.S.G. Mixture
f-1 Brome
162
MILO L. COX AND M. K. MCCARTY
Table 2. Percent basal density of grasses in bromegrass and warm-season grass mixture plots one year after reseeding, Lincoln, Nebraska, 1953.
Warm Season Grass
Mixture Bromegrass
Bluegrass, Blue-
Hairy Chess, grass,
Reseeded Sand Brome- Hairy
Species Dropseed grass Chess
Plowed
no weed control 4.23 1.88
Mowed (R) # 12.91 1.08
Mowed (NR) # 11.41 0.98
Sw.Cl.-no weed control 4.72 1.87
Sw.Cl.-mowed 8.31 0.82
Alfalfa-no weed control 5.10 1.68
Alfalfa-mowed 7.56 0.73
Average 7.75* 1.29**
Disked
No weed control 1.08 17.07
Mowed (R)# 2.85 11.32
Mowed (NR) # 3.12 15.10
Sw.Cl.-no weed control 0.87 14.01
Sw.Cl.-mowed 2.76 11.36
Alfalfa-no weed control 0.75 14.68
Alfalfa-mowed 4.36 9.63
Average 2.26 13.31
No seedbed preparation
No weed control 0.00 17.75
Mowed (R)# 0.55 15.35
Mowed (NR) # 0.23 15.80
Sw.Cl.-no weed control 0.05 15.87
Sw.Cl.-mowed 0.25 17.15
Alfalfa-no weed control 0.04 18.77
Alfalfa-mowed 0.40 18.00
Average 0.22 16.96
# R-herbage removed; NR-herbage not removed. ** Significant at the 1 percent level.
* Significant at the 5 percent level.
preparation in
obtaining good
stands of the reseeded grasses.
There was 35 times more warm-
season grass and 51 times more
bromegrass established in the
plowed plots than in the plots
receiving no tillage (Figure 2
and Table 2). It was evident,
from observations during the
growing season, that the success
of the replanted grasses in the
plowed plots was largely due to
the drastic reduction in Ken-
tucky bluegrass.
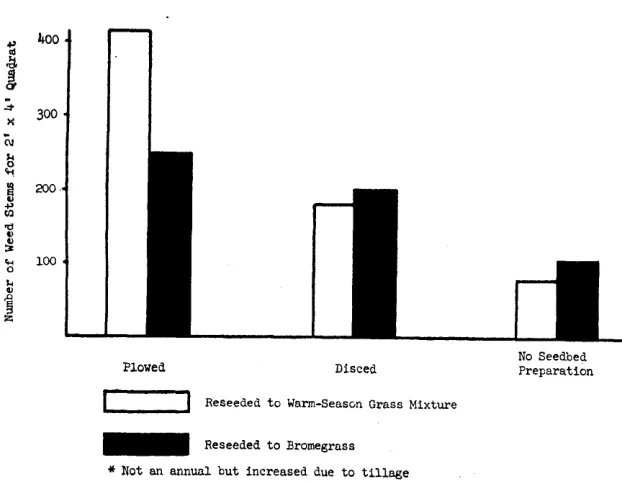
lPlowing also resulted in great
increases of an n u a 1 ragweed
(
A m b r o s i a artemisiifolia)and
hoary vervain (Verbena stricta)
(Figure 3).
Inthe warm-season
grass mixture plantings there
were five times as many of these
two weeds in the plowed plots as
4.10 8.48
3.65 3.38
2.58 3.95
3.50 5.95
4.20 2.80
3.18 5.70
3.62 4.22
3.55** 4.92**
1.02 16.18
0.80 9.80
0.80 12.63
0.35 14.72
0.62 12.86
1.70 14.40
0.95 11.37
0.89 13.14
0.05 15.80
0.08 14.90
0.08 17.90
0.08 16.48
0.15 16.98
0.02 16.90
0.05 13.23
0.07 16.03
in
the untilled ones. Plowing
doubled the number of these two
weeds in the bromegrass plant-
ings.
Disking gave slightly better re-
sults than no tillage, but much
poorer results than plowing. In
the disked plots bluegrass rap-
idly recovered, the stands of
planted species were poor, and
annual weeds increased almost
as much as in the plowed plots
(Figure 2 and Table 2)
. Effects of Weed Control TreatmentsOne year following the appli-
cations of the weed control treat-
ments there were still significant
reductions in weeds as compared
to the untreated checks. The re-
maining weed populations did
not, however, adequately indi-
cate the benefits derived from
the treatments.
This was true
because the treatments were ap-
plied in 1952 and the weed popu-
lations were studied a year later,
by which time the annual weed
populations had recovered some-
what from the previous year’s
treatment. Therefore the suc-
cess of the weed control treat-
ments was not indicated by the
1953 weed populations, but by
Plowed Disced
Reseeded to Warm-Season Grass Mixture
No Seedbed Preparation
Reseeded to Bromegrnss
* Not an annual but increased due to tillage
ESTABLISHMENT OF DESIRABLE PLANTS IN WEEDY BLUEGRASS PASTURES
163
Weed Control Treatments (1952)
Ef~s6.l Deneity of Grasses
I
No Weed Control 1
Mowed4"highJuly 5 (Removed)
Mowedk" highJuly 5 (Not Removed)
Sweet Clover No Weed Control
Sweet Clover - Moved 4” high July 5
Alfalfa - No Weed Control
Alfalfa - Mowed 4” high JOY 5
L
Warm-Season Grass Mixture_ Bromegrass
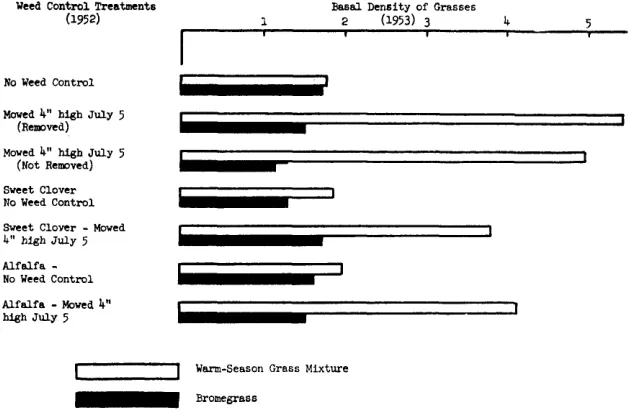
FIC~JRE 4. Effect of weed control treatments on basal density of bromegrass and warm- season grass mixture.
the success of the reseeded
grasses that had survived their
first year (Figure 4)
.Mowing increased the estab-
lishment of the warm-season
grass mixture by 2% times.
Since drought was a critical fac-
tor in the survival of the warm-
season grass seedlings, a pro-
nounced effect was achieved by
removing a large part of the
weed population
while the
grasses were in their seedling
stages and highly susceptible to
drought. Mowing did not pro-
duce such large differences in
the bromegrass plots because the
bromegrass population had al-
ready been lowered drastically
by a late freeze while the brome-
grass was in the seedling stage.
Also, the remaining bromegrass
plants were much farther ad-
vanced and had produced deeper
roots by the time drought condi-
tions became critical, and mow-
ing was not as important in
seedling survival (Figure 4).
Spraying with 2,4-D resulted in
as high an increase of warm sea-
son grass seedlings as mowing
(Figure 5), and it was evident
that spraying would have a de-
cided advantage over mowing
where the weeds were too small
to be effectively mowed. Also,
spraying would be easier on
large areas or areas where mow-
ing was difficult. Mowing, how-
ever, gave excellent control of
hairy chess while spraying was
ineffective.
Alfalfa and s w e et c 1 o v e r
planted with both cool and
warm-season grasses had little or
no effect on weed populations or
the success
of the planted
grasses. Removal
or non-re-
moval of the hay after mowing
had no effect, and height of
mowing, four inches versus one
inch, s h o w e d no significant
results.
Summary
A study was made of the ef-
fects of seedbed preparation and
weed control practices on seed-
ling establishment in a weedy
pasture. The seedbed prepara-
tions involved plowing or disk-
ing as compared to no tillage.
There were
12 weed
control
treatments that involved mow-
ing, height of mowing, 2,4-D
spraying, legume planting, and
removal or non-removal of hay.
The plantings included brome-
grass, a warm-season grass mix-
ture, alfalfa, and sweetclover.
The plots were prepared, the
plantings made, and the weed
control treatments applied in
1952. The detailed vegetative
analysis was made in the sum-
mer of 1953 without further
treatments of any kind. Such a
schedule provided a much bet-
ter estimate of the ultimate sur-
vival of the planted species than
if the data had been collected in
the seedling year.
Plowing was decidly the best
seedbed preparation method in
this study. Plowing destroyed 90
percent of the perennial weeds,
80 percent of the old bluegrass
sod, and was 30 to 50 times more
Switchgras6 Side-oats gram Sand lovegram No weed control
r-1 2,4-D ester - 1 lb. per acre
Mowed 4” high July 5
264
MILO L. COX AND M. K. MCCARTY
effective in seedling establish-
ment than where no tillage was
done. Disking was not much bet-
ter than no seedbed preparation,
and both resulted in poor stands
of the planted species.
Spraying with one pound of
2,4-D ester per acre and mow-
ing were both effective in con-
trolling weeds
and allowing
establishment of planted species.
Under these treatments about
2% times as many grass seedlings
were established as where no
weed control treatments were
applied. Mowing at a one-inch
height was no better than mow-
ing at four inches.
The planting of legumes with
the grasses made no difference
in the success of the reseeding.
Leaving or removing the hay
after mowing had no differential
effect.
The success or failure of re-
seeding more productive species
in weedy bluegrass sods seemed
to be proportional to the degree
to which the bluegrass sod was
destroyed and to the effective-
ness of the weed control meas-
ures applied in the seedling stage
of the planted species. The lat-
ter would be especially impor-
tant in years of moisture deficit.
LITERATURE CITED
AHLGREN, H. L., M. L. WALL, R. J.
MUCKENHIRN AND F. V. BURCALOW.
1944. Effectiveness of renovation in increasing yields of permanent pastures in southern Wisconsin. Jour. Amer. Sot. Agron. 36: 121- 131.
COOK, I. S. 1922. West Virginia pas- tures. W. Va. Agr. Exp. Sta. Bul. 177. 23 pp.
COTTON, J. S. 1910. Improvement of pastures in eastern New York and the New England States. U. S. Dept. Agr. Bur. Plant Ind. Circ. 49. I6 PP.
GRABER, L. F. 1927. Improvement of permanent bluegrass pastures with sweetclover. Jour. Amer. Sot. Agron. 19: 994-1006.
. 1928. Evidence and ob- servations on establishing sweet-
clover. Jour. Amer. Sot Agron. 20: 1197-1205.
1936. Renovating blue- grass pastures. Wis. Agr. Exp. Sta. Circ. 277. 23 pp.
HUGHES, H. D. AND M. L. PETERSON. 1946. Building better pastures. Iowa Farm Sci. Reporter. 7: 14-18. KLINGMAN, D. L. 1952. Annual Re- port, Noxious Weed Control Proj- ect. Div. of Weed Inv., Bur. of Plant Ind., Soils and Agr. Eng., U. S. Dept. Agr. (Unpublished). MCCARTY, M. K. 1953. Annual Re-
port, Brush and Weed Control Project, Weed Inv. Sec., Field Crops Research Branch, Agr. Res. Serv., U. S. Dept. Agr. (Unpub- lished) .
ODLAND, T. E., C. V. WILSON, H. 0. HENDERSON AND E. P. DEATRICK 1930. Pasture experiments. W. Va. Agr. Exp. Sta. Bul. 235. 32 pp. SPRAGUE. M. A. 1952. The substitu-
tion of chemicals for tillage in pas- ture renovation. Jour. Amer. Sot. Agron. 44: 405-409.
SPRAGUE, V. G., R. R. ROBINSON AND A. W. CLYDE. Pasture renovation: I. Seedbed preparation, seedling
establishment and subsequent
yields. Jour. Amer. Sot. Agron. 29: 12-25.
Forty-one persons were voted into the National Cowboy Hall of Fame by trustees in annual meeting at Oklahoma City, January 7, as con- tracts were signed on architects’ plans and specifications leading to construction start by autumn, for the first $l% million unit of the western shrine.
All persons to be honored this year are deceased; all were identified with the livestock industry, had a hand in development of the Ameri- can West or were prominent in per- petuation of traditions and ideals of the West, which were the basic cri- teria for selection and approval by a three-fourths majority of trustees.
Previously voted into the Cowboy Hall of Fame were WILL ROGERS of
Cowboy Hall of Fame Elects
Oklahoma; THEODORE ROOSEVELT of
New York and North Dakota;
CHARLES GOODNIGHT of Texas, CHARLES RUSSELL of Montana and JAKE MCCLURE of New Mexico.
The at large honorees are EDWARD BEALE of California; DEAN W. L. BLIZZARD of Oklahoma; FRANK BOICE of Arizona; WILLIAM F. “BUFFALO BILL” CODY of Nebraska; DR. CHARLES
F. CURTISS of Iowa; JAMES J. HILL of Minnesota; PETE KNIGHT of Alberta; HENRY MILLER of California; TOM MIX of Texas and Hollywood; Eu- GENE MANLOVE RHODES of New Mexi- co and BRIGHAM YOUNG of Utah.
Honorees by states were: Arizona,
RAMON AHUMADO and GEORGE RUFF-
NER; California, HENRY C. DAULTON
and FRED H. BIXBY; Idaho, FRANK GOODING and JOHN HAILEY; Kansas, DAN C. CASEMENT and CALVIN F. FLOYD; Montana, ROBERT C. FORD and CARSTEN C. KOHRS; Nebraska, FRANK NORTH and EDWARD CREIGHTON; Ne-
vada, JOHN SPARKS and DANIEL
WHEELER; New Mexico, JOHN CHISUM and VIC CULBERSON.
And North Dakota, WILSE RICH- ARDS and JOHN W. GOODALL; Okla- homa, CHARLES H. TOMPKINS and OTTO BARBY; South Dakota, JAMES PHILIP and ED LEMMON; Texas, STEPHEN F. AUSTIN and OLIVER Lov- ING; Utah, ANTHONY IVINS and JACOB
HAMBLIN; Washington, ANDREW J.
SPLAWN and BENJAMIN E. SNIPES;
Wyoming, JOHN B. KENDRICK and
Effects of Sheep and Gophers on Meadows of
the Bridger Mountains of Montana1
*F. A. BRANSON AND G. F. PAYNE
sheep. A management system in- eluding one night bed grounds and camp units was used to give uniform moderate use. There were some deer and a few elk that used the range but neither of these game species was pres- Plant Ecologist, U. S. Geological Survey, Denver, Colo- ent in excessive numbers. There rado, and Professor of Range Management, Montana were no apparent effects of game
State College, Bozeman animals on the areas studied.
Many range technicians, stock- men, and others have advocated the control of pocket gophers
(Thomomys spp.) on mountain meadows because it is generally believed that gophers cause poor forage conditions. This belief is supported by the results of Moore and Reid (1951) who found that gophers on Oregon meadows did cause a decline in range condition. Ellison (1946) has stated that livestock are the primary cause of deterioration of meadows and that, “There is a slight tendency for total (vegeta- tion) production to increase where gophers are present as compared with where they are absent.” These apparent contra- dictions indicate that more infor- mation is needed before the ques-
tion can be resolved. It is gen- erally recognized that domestic livestock are the usual cause of deterioration of mountain mea- dows (Ellison, 1946)) although elk are also known to cause con- ditions that favor the increase of pocket gophers (Laycock, 1953). This paper is a progress report of a gopher use study initiated in 1943 in the Bridger Mountains by Harold F. Heady, then of the Montana Agricultural Experi- ment Station.
Meihods
Four plots, each 40 feet by 40 feet, were established on a south
‘This study was conducted under a cooperative agreement between the U. S. Forest Service and the Mon- tana AgricuZturaZ Experiment Sta- tion.
ZFormerZy Assistant Professor of Range Management, Montana State College, Bozeman.
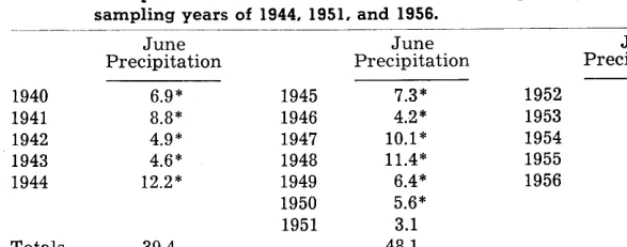
Table 1. Precipitation for fhe month of June for the years preceding fhe sampling years of 1944, 1951, and 1956.
June June June
Precipitation Precipitation Precipitation
1940 6.9” 1941 8.8” 1942 4.9” 1943 4.6* 1944 12.2*
Totals Averages
39.4 7.9
1945 7.3” 1946 4.2* 1947 10.1” 1948 11.4” 1949 6.4” 1950 5.6* 1951 3.1
48.1 6.9
1952 4.0 1953 6.5 1954 7.8 1955 8.3 1956 1.8
26.4 5.3
* Data estimated by graphing available records from climate station near the study area (6 years of record) with records from a station showing good correlation and having .records for earlier years.
slope in a mixed grass and forb type that is common on similar sites throughout the Bridger Mountains (Figure 1).
The area had been heavily grazed previous to 1929. From 1929 through 1956 the meadows were moderately grazed by
The elevation is about 7,000 feet. Average annual precipita- tion at a climatic data station 5 miles from the study area was 30.7 inches. There was an annual average of 63 days with tempera- tures above freezing and an aver- age annual temperature of 39”
FIGURE 1. Mixed grass and forb type that is common in meadows in the Bridger Moun- tains. Th: exdosure shown excludes both sheep and gophers.
166 F. A. BRANSON AND G. F. PAYNE
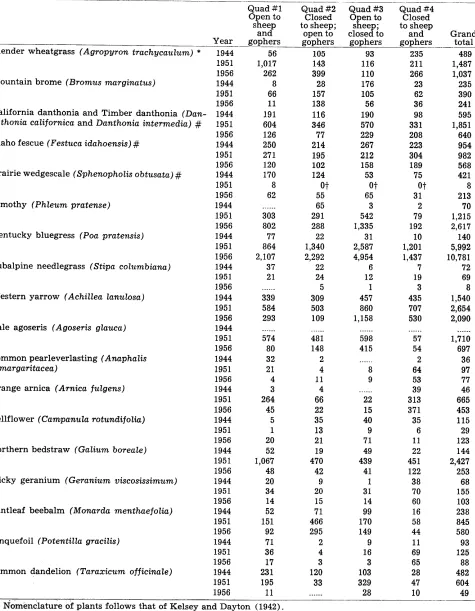
Table 2. Total numbers of siems or planfs in 8 square-meter samples in each of the four treaimenfs for the years 1944, 1951, and 1956.
_____- Quad #l
Open to Quad #2 Closed Quad #3 Open to Quad rff4 Closed
sheep to sheep; sheep;
and closed to t”:nhzep Grand
Year gophers gophers open to gophers gophers total
Slender wheatgrass (Agropyron trachycaulum) * 1944 1951 1956
Mountain brome (Bromus marginatus) 1944
1951 1956 California danthonia and Timber danthonia (Dan- 1944 thonia calijornica and Danthonia intermedia) # 1951
Idaho fescue (Festuca idahoensis) #
Prairie wedgescale (Sphenopholis obtusata) #
Timothy (Phleum pratense)
Kentucky bluegress (Poa pratensis)
Subalpine needlegrass (Stipa columbiana)
Western yarrow (Achilles Zanulosa)
Pale agoseris (Agoseris glauca)
Common pearleverlasting (Anaphalis margaritacea)
Orange arnica (Arnica julgens)
Bellflower (Campanula rotundijolia)
Northern bedstraw (Galium boreale)
Sticky geranium (Geranium viscosissimum)
Mintleaf beebalm (Monarda menthae joZia)
Cinquefoil (PotentiZZa gracilis)
Common dandelion (Taraxicum o jjicinale)
1956 1944 1951 1956 1944 1951 1956 1944 1951 1956 1944 1951 1956 1944 1951 1956 1944 1951 1956 1944 1951 1956 1944 1951 1956 1944 1951 1956 1944 1951 1956 1944 1951 1956 1944 1951 1956 1944 1951 1956 1944 1951 1956 1944 1951 1956 56 1,017 262 8 66 11 191 604 126 250 271 120 170 8 62 _.____ 303 802 77 864 2,107 37 21 ._.___ 339 584 293 -_-___ 574 80 32 21 4 3 264 45 5 20 52 ,067 48 20 34 14 52 151 92 71 36 17 231 195 11
105 93 235 489
143 116 211 1,487
399 110 266 1,037
28 176 23 235
157 105 62 390
138 56 36 241
116 190 98 595
346 570 331 1,851
77 229 208 640
214 267 223 954
195 212 304 982
102 158 189 568
124 53 75 421
O-t O? 0t 8
55 65 31 213
65 3 2 70
291 542 79 1,215
288 1,335 192 2,617
22 31 10 140
1,340 2,587 1,201 5,992
2,292 4,954 1,437 10,781
22 6 7 72
24 12 19 69
5 1 3 8
309 457 435 1,540
503 860 707 2,654
109 1,158 530 2,090
..____ 481 148 2 4 11 4 66 22 35 13 21 19 470 42 9 20 15 71 466 295 2 4 3 120 33 ______ 598 415 _._... 8 9 ..--._ . ..___ 22 15 40 9 71 49 439 41 1 31 14 99 170 149 9 16 3 103 329 28 ._._._ ___.__
57 1,710
54 697
2 36
64 97
53 77
39 46
313 665
371 453
35 115
6 29
11 123
22 144
451 2,427
122 253
38 68
70 155
60 103
16 238
58 845
44 580
11 93
69 125
65 88
28 482
47 604
10 49
* I$mendlature of plants follows that of Kelsey and Dayton (1942).
EFFECTS OF SHEEP AND GOPHERS ON MOUNTAIN MEADOWS 167
F. Precipitation for June, the Results
highest precipitation month, is The most striking change over shown in Table 1. the 13-year period was the in-
The plots were arranged as crease on all plots of the two shown in the accompanying dia- introduced species, timothy and
gram. Kentucky bluegrass. These two
N
The open plot was marked with steel fence posts at the corners. Sheep were excluded from two plots by woven wire, and the ex- clusion of gophers was accomp- lished by burying 30-inch “hail screen” (hardware cloth) 24 inches in the ground, letting it extend 6 inches above the ground. Gophers entering the two “hail screen” exclosures by snow tunnels or other means were trapped each year.
The vegetational studies in- cluded list counts of 8 randomly selected square-meter quadrats in each treatment in 1944, 1951, and 1956. A total of 14 grass spe- cies, 45 forb species, and two shrubs plus several unidentified species were found on the plots. Only those that seemed most im- portant are presented in Table 2. It will be noted that the numbers of stems for many species were greater in 1951 than in 1944 or 1956. The extremely dry year
(Table 1) of 1956 may have caused some general reductions in stem numbers.
The data can be most easily understood by referring to Table 3 which shows the increase or decrease in each species for each treatment.
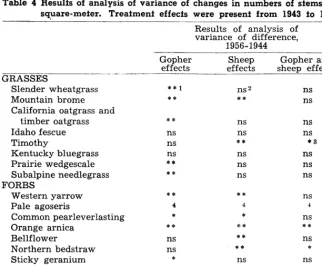
Results of statistical analyses are presented in Table 4. It is known that some differences ex- isted in the plots when the study was initiated in 1943 (see Table 2). To avoid the influences of differences that existed when the study was initiated, the changes in plant populations be- tween 1944 and 1956 were sub- jected to analyses of variance.
grasses showed the greatest in- creases on plots open to grazing by sheep but closed to gophers. Results of statistical analyses (Table 4) showed that the ef- fects of sheep were highly sig- nificant in bringing about the in- crease in timothy. Although the effects of gophers and sheep on Kentucky bluegrass were not statistically significant, the large increase on the plot grazed by sheep but closed to gophers ap- pears to have been due to sheep activities. Counts made in 1951 showed intermediate values for these species, which indicates that these two species were in- creasing on all plots in 1956. It is
surprising that these introduced species should continue to in- crease under protection. Possibly the meadow was somewhat de- teriorated when the plots were established. Deterioration at that time is indicated by the abun- dance of common dandelion in 1944 (Table 2). Common dande- lion decreased on all plots during the 13 years of treatment.
It would appear that gopher activity produced conditions fav- orable to the establishment and survival of slender wheatgrass
(Tables 3 and 4). Apparently, sheep activities had little effect on this species since it increased only slightly on the plot open to sheep and closed to gophers and on the plot closed to sheep and gophers. Gophers caused a de- crease in the two danthonias
(Danthonia intermedia and D. californica). The contrasting re- sponses of these grasses to gopher activities are difficult to explain. Possibly gopher mounds tended to cover the low-growing danthonias while they had little effect on the taller slender wheatgrass. The same explana-
Table 3. Changes in numbers of stems or plants during the time interval 1944 fo 1956. The data are differences between folfals for 8 square meters per treatment for the sampling years 1944 and 1956.
GRASSES
Slender wheatgrass Mountain brome
California danthonia l and timber danthonia l Idaho fescue l Timothy
Kentucky bluegrass Prairie wedgescale l Subalpine needlegrass FORBS
Western yarrow Pale agoseris
Common pearleverlasting Orange arnica
Bellflower
Northern bedstraw Sticky geranium Mintleaf beebalm Cinquefoil
Common dandelion
Open Closed to sheep Closed to gophers Closed
+206 +3
-65 -39
-130 -113
+802 +223
+ 2,030 + 2,270
-108 -69
-37 -17
-46 +80 -28
+42 +15 -4 -6 +40 -54 -220
+294 +110
-200 + 148
+9 +18 -14
+23 +6 +224 +1 -120
+17 -120
+39
-1091,332 +4,923
+12 -5
+701 +95
+415 +54
+9 +51
+15 +332
+31 -24
-8 + 100
+13 +32 +50 +28 -6 +54 -70 -18
+31 +13
+10 -34 +190 + 1,427
+43
168 F
tion might be applicable to prairie wedgescale which was also low-growing and was de- creased by gopher activities.
Idaho fescue and subalpine needlegrass decreased on all plots but decreased least under complete protection. Possibly neither of these species is adapted to the local environment and are therefore being replaced by more adapted species.
Mountain brome decreased slightly due to sheep activities but increased under protection from sheep. This grass was one of the grasses most preferred by sheep (Teigen, 1949).
Western yarrow decreased on plots open to gophers and in- creased on the plot closed to gophers but open to sheep. Teigen (1949) found that this plant, although abundant in the area, was seldom grazed by sheep. Tryon (1947) found that western yarrow roots were fre- quently found in food “stores”
Table 4
A. BRANSON AND G. F. PAYNE
Results of analysis of variance of changes in numbers of stems per sqrare-meter. Treatment ef f ecfs were present from 1943 fo 1956. of gophers. Findings of these two authors help explain the re- sponse of western yarrow to sheep and gopher activities. The use of this species by gophers and the lack of use of yarrow by sheep caused marked differences in the numbers of yarrow pres- ent on the treated plots (Table 3).
Pale agoseris, although used frequently by both sheep and gophers, increased on all plots. It increased least on plots com- pletely open or closed to both sheep and gophers. In view of the zero quantities in 1944 data, no statement can be made on its increase or decrease from 1944. The decrease from 1951 follows the general pattern of vegeta- tional decrease. The data show major effects of gophers from 1951 to 1956. They also indicate that agoseris is a minor part of the vegetation free of gopher and sheep influences.
Of the remaining forbs, bell-
_~__ - GRASSES
Slender wheatgrass Mountain brome California oatgrass and
timber oatgrass Idaho fescue Timothy
Kentucky bluegrass Prairie wedgescale Subalpine needlegrass FORBS
Western yarrow Pale agoseris
Common pearleverlasting Orange arnica
Bellflower
Northern bedstraw Sticky geranium Mintleaf beebalm Cinquefoil
Common dandelion
Results of analysis of variance of difference,
1956-1944
Sheep Gopher and
effects sheep effects
**1 **
ns2 ns
** ns
** ns ns
ns ns ns
ns ** *3
ns ns ns
** ns ns
** ns ns
**
4
* **
**
**
ns
ns **
ns ** ns
ns ** *
* ns ns
ns ns ns
** ** ns
** * ns
1 Indicates differences significant at the 1 percent level. 2 Indicates differences not significant at the 5 percent level. 3 Indicates differences significant at the 5 percent level.
4 No analyses were possible for this species since no values were obtained in 1944.
flower increased on plots open to sheep and decreased on those closed to sheep. The opposite re- sponse was true of northern bed- straw. From these results, one can assume that bellflower is not palatable to sheep while north- ern bedstraw is palatable to sheep.
Cinquefoil also decreased due to sheep activities and is known to be quite palatable to sheep
(Teigen, 1949). Common dende- lion decreased on all plots but the decrease was greatest on plots open to gophers. Common dandelion is known to be a spe- cies highly preferred by gophers
(Moore, et al., 1951).
Summary
The vegetational responses of 13 years of use by sheep and gophers and of protection on a mountain meadow are presented. Treatments were: (1) Protection from sheep and gophers, (2) pro- tected from gophers, open to sheep, (3) protected from sheep, open to gophers, and (4) open to sheep and gophers.
Gopher activities caused a de- crease in some of the grasses of low productivity and a decrease in two of the forbs not consid- ered desirable on mountain range. In these respects the ef- fects of gophers were beneficial. Species detrimentally affected by gopher activity were: Idaho fescue, California oatgrass, timber oatgrass, prairie wedge- scale, subalpine needlegrass, western yarrow, and common dandelion. Gophers had a bene- ficial effect on slender wheat- grass.
The results presented indicate that sheep activities reduced the population of plants most pre- ferred by sheep. This has prob- ably made the meadow less de- sirable for sheep grazing but pos- sibly more desirable as cattle range.
EFFECTS OF SHEEP AND GOPHERS ON MOUNTAIN MEADOWS 169
Kentucky bluegrass, and bell- 2nd. Ed. J. Horace McFarland Co., influence on forage production of
flower. Harrisburg, Pa. 675 pp. Oregon mountain meadows. U. S.
LAYCOCK, W. A. 1953. An ecological Dept. Agr. Circ. 884. 36 pp. LITERATURE CITED study of the pocket gopher (Thom- TEIGEN, M. L. 1949. Forage prefer-
ELLISON, L. 1946. The pocket gopher in relation to soil erosion on moun-
tain range. Ecology 27: 101-l 14.
omys talpoides tenellus Goldman) ence of range sheep. M.S. Thesis. in the Jackson Hole region of Montana State College. Bozeman.
Wyoming. Unpublished M. S.
thesis. Univ. of Wyo., Laramie. TRYON, C. A. 1947. The biology of the pocket gopher - _ (Thomomys KELSEY, H. P. AND W. A. DAYTON. MOORE, A. W. AND E. H. REID. 1951. talpoides) in Montana. Mont. Agr.
1942. Standardized plant names. The Dalles pocket gopher and its Exp. Sta. Bul. 448. 30 pp.
Reinvasion of Big Sagebrush
Following Chemical Control
W. M. JOHNSON
Range Conservationist, Rocky Mountain Forest and Range Experiment Station’, Fort Collins, Colorado.
The chemical control of big sagebrush (Artemisia triden- tutu) in Wyoming has passed be- yond the experimental stage. More than 20,000 acres of sage- brush have already been chemi- cally treated (Alley et al., 1956). High rates of kill have been ob- tained with both 2,4-D and 2,4,5-T compounds, and herbage yields following control have been materially increased (Boh- mont, 1954, and Hull et al., 1952). Cooperative studies in chemi- cal control of big sagebrush were started in 1949 by the Forest Service and the Bureau of Land Management. Results of the con- trol aspects of the studies have been published (Hull et al.,
1952, and Kissinger et al., 1952). However, information on sage- brush reinvasion following con- trol was needed to complete the evaluation. For this reason, some of the experimental plots were
‘Forest Service, U. S. Department of Agriculture, with headquarters at Fort Collins, Colorado, in coopera- tion with the Colorado State Uni- versity. Author stationed at Lara- mie, Wyoming, in cooperation with the University of Wyoming. For ref- erence purposes this article is pub- lished with aDDrovaZ of the Director.
selected for further observation. The experimental area is 36 miles southeast of Lander, Wyo- ming. Elevation is 6,800 feet and annual precipitation is estimated to be 12 to 14 inches.
combinations of herbicide, dif- ferent carriers, and at different rates of application. These treat- ments resulted in different levels of sagebrush kill. Two of these plots were selected within each of five and sometimes six levels of sagebrush kill for each of the 4 years of treatment. Levels of sagebrush kill used in the plot selection were approximately 0, 20, 40, 60, and 80 percent. Where one or two plots had substan- tially higher kills than 80 per- cent, they too were included. To sample each level of sagebrush kill, 20 permanent 50-square-foot circular s a m p 1 e s were estab- lished, 10 in each plot.
Methods
Studies of the chemical control
of big sagebrush were made in grazing was constructed In 1951 an exclosure to prevent on an 1949, 1950, 1951, and 1952 (Fig. area sprayed in 1949. A second 1). Each year a large number of exclosure was erected in 1953 plots, l/10 acre to 5 acres in size, and enlarged in 1954 on an area were sprayed with different sprayed in 1952. These exclos-
Wyoming A&cuZtura”Z Experiment FIGUl(E 1. Study area on typical big sagebrush range in Wyoming. A treated area is
170
ures included portions of a num-
ber of sprayed plots with un-
sprayed strips between plots.
All sprayed plots within the ex-
closures were studied. The kill
classes studied on grazed range
were not always represented.
Sampling procedures inside the
exclosures were the same as
those used on the grazed areas.
Woody species were inven-
toried in 1953, 1954, and 1956.
All sagebrush
plants were
counted on each permanent sam-
ple and segregated into height
classes-under 4 inches, 4 inches
plus, and seedlings of the cur-
rent year. The square feet of live
crown was estimated.
Resulfs
During 1953, large numbers of
seedlings of big sagebrush were
present on areas sprayed in 1949
and 1950, but sites sprayed in
1951 and 1952 had very few
(Table 1)
.This difference may
be correlated with the time lapse
since spraying.
To produce
abundant seedlings in 1953, sur-
viving plants would have had to
produce seed in 1952. Spraying
in 1952 apparently prevented
this. There were more seedlings
present on the 1951 area than on
the 1952 area, but not nearly so
many as on the areas sprayed
prior to 1951.
Apparently 1953 was an excel-
lent year for seedling establish-
ment, but 1954 and 1956 were
very poor. No data are available
to explain these differences.
The number of sagebrush seed-
lings is related to the percentage
of plants killed by spraying as
follows: Few seedlings became
established on unsprayed areas
or those with a small percentage
of kill. As kill increased, the
number of seedlings increased up
to a maximum in the 40 to 60
percent kill classes. The num-
ber then decreased with higher
percentage kills of the original
plants.
A ‘large number of the 1953
seedlings b e c a m e established
plants. This is indicated by the
W. M. JOHNSON
big increase in numbers of plants
in the O-4 inch class in 1954. The
change in numbers of plants in
the O-4 inch class appears to be
related to the number of seed-
lings present in 1953. On the
area sprayed in 1952, the number
of plants in the O-4 inch class did
not increase during 1954 because
there were so few seedlings in
1953.
Not all of the seedlings that
survive the first year continue to
live. This is indicated by the
substantial reduction in numbers
of plants in the O-4 inch class
from 1954 to 1956. Apparently
climatic or other factors were un-
favorable during this period and
many of the young plants died.
This was true even on the study
area sprayed in 1952 where prac-
tically no seedlings were present
in 1953, and the loss occurred
among older plants.
Among big sagebrush plants 4
inches or larger there was no sig-
nificant change in numbers.
There was a slight tendency for
numbers to increase because of
growth of younger plants. How-
ever, in some cases the number
of plants actually decreased, par-
ticularly in the areas where best
kills were obtained in 1951 and
1952. Because they did not also
decrease in the areas sprayed in
1949 and 1950, this may have re-
sulted from delayed effects of
the herbicide. These changes in-
dicated that sagebrush reinva-
sion following spraying will not
Table 1. Average number
of big sagebrush plants on grazed plots as related fo percent killed by spraying, 1953-1956.____-
Plots Seedlings 1 Plants O-4 in. 1 Plants over 4 in. 1 combined 1953 1954 1956 1953 1954 1956 1953 1954 1956 _~__
Pet. kill No. No. No. No. No. No. No. No. No. M-l (sprayed 1949)
o-3 0.7 0.2 0 7.3 9.8 5.2 11.2 11.6 12.0 19-22 0.2 0.7 0.2 4.0 4.7 2.8 7.3 8.5 8.6 37-51 1.5 0.3 0 1.5 3.4 3.6 4.0 4.6 4.5 55-64 52.6 3.5 0 0.8 22.6 19.3 4.5 4.6 5.0 77-90 15.1 2.8 0.2 0.7 20.3 20.8 1.1 1.2 2.1 98 12.9 1.3 -___- 0.1 0.3 2.2 1.6 0 0 0.1 Average 13.8 1.5 0.1 2.4 10.5 8.9 4.7 5.1 5.4
M-5 (sprayed 1950)
o-2 3.3 1.5 0 5.3 4.9 1.4 10.1 8.6 9.5 19-19 13.9 0.3 0 0.5 7.5 5.1 4.5 5.2 4.4 42-44 17.0 0.8 0 0.9 19.5 11.8 3.9 4.3 4.2 52-66 15.3 3.2 0 1.9 24.5 15.3 3.6 3.6 4.4 80-80 5.0 0.2 0 0.3 3.0 2.8 1.6 1.7 1.7 91-92 3.5 0.2 ~- 0 0.9 1.8 1.6 0.9 1.0 1.4 Average -- 9.7 1.0 0 1.6 10.2 6.3 4.1 4.1 4.3
M-10 (sprayed 1951)
3-4 0.7 0 0 3.6 3.8 1.9 7.2 7.3 6.8 19-19 0.3 0.7 0 6.3 7.0 5.2 6.2 6.7 6.7 38-44 1.9 1.3 0 5.1 8.1 10.4 4.9 4.9 6.2 56-62 0.7 0.3 0 1.8 3.1 1.9 2.1 2.2 3.2 84-86 0.9 0 - 0 1.0 1.0 1.7 4.3 4.4 1.7 Average 0.9 0.5 0 3.6 4.6 4.2 4.9 5.1 4.9
M-12 (sprayed 1952)
o-o 0.2 0 0 9.2 7.2 0.9 9.7 11.5 11.7 20-22 0 0 0 5.0 3.8 0.8 7.9 8.7 8.8 41-46 0 0.2 0 5.5 5.2 0.7 6.4 7.0 8.1 61-62 0 0 0 3.4 2.6 0.5 3.5 4.5 5.6 78-85 _____________._ 0 0 0 0.4 -- 1.1 0.2 5.9 6.8 2.9 Average 0 0 0 4.7 4.0 0.6 6.7 7.7 7.4
REINVASION OF BIG SAGEBRUSH 171
FIGURE 2. In central Wyoming reinvasion of big sagebrush tion from herbaceous vegetation may be an important factor.
is a slow process. Competi-
be a rapid process with high duction in total number of sage- initial kills (Fig. 2). brush plants inside the exclo-
Significant differences were
2. Seedling establishment was very low and mortality of plants in the O-4 inch group was very high. Larger plants showed no
observed between the grazed and ungrazed parts of the sprayed plots. During the 3 years no heavy crops of seedlings were ob- served inside the exclosures
(Table 2), In 1953 there were no seedlings inside the exclosure on the area sprayed in 1949, but out- side on the grazed area seedlings averaged 13.8 per plot with as many as 52.6 on plots in the 60- percent-kill class. Another dif- ference is the apparent down- ward trend in numbers, with time, of both small and large plants inside the exclosure. The reduced number of established plants in the O-4 inch class on sprayed areas inside the exclo- sures, as compared with the grazed range, is probably due to reduced numbers of seedlings. Two factors may have been re- sponsible for this difference : Herbaceous cover inside the ex- closures may have increased to such an extent that competition was a limiting factor, and accu- mulation of litter in the absence of grazing may have retarded germination and establishment of seedlings (Beetle, 1955).
Table 2. Average number of big sagebrush plants on protected plots as re- lafed PO percent killed by spraying, 1953-1956.
sures, the area of live crown has doubled since 1953 (Table 3). This change is not related to the percentage of sagebrush plants killed. Impressions gained from observation of the study areas indicate that this increase is due mostly to spread of younger, healthier plants. Older plants with partially killed crowns ap- peared to be weak.
Conclusions
Tentative conclusions drawn from the results after spraying are as follows:
1. Big sagebrush seedlings seem to be most numerous when approximately 40 to 60 percent of the original plants are killed, but seedlings do not become established every year.
Plots Seedlings 1 used 1953 1954 1956 --__.___ _ ~__ -___ Pet. kill No. No. No.
Plants O-4 in. 1 Plants over 4 in. 1 1953 1954 1956 1953 1954 1956
No. No. No. No. No. No.
0
55 62 68 69 72 77 86 95
M-l Exclosure (sprayed 1949 - fenced April 1951)
0 0 0 2.4 2.0 1.2 11.0 11.5 9.0 0 0.3 0.3 1.0 1.0 0.8 6.3 6.2 5.5 0 0 0 1.1 1.0 0.8 4.1 4.4 3.5 0 0 0 0.8 0.6 1.1 2.8 3.2 1.1 0 0 0 0.7 0.6 0.8 2.2 2.1 1.4 0 1.0 0 1.7 1.6 0.6 4.3 4.4 4.5 0 0.3 0 0.6 0.5 0.1 1.1 1.2 1.1 0 0 0 0.6 0.5 0.4 1.5 1.5 1.6 0 0 0 0.6 0.5 0.3 0.2 0.3 0.3
Average 0 0.2 0 1.1 0.9 0.7 3.7 3.9 3.1 M-12 Exclosure (sprayed 1952 - fenced April 1953)
4 0 0 0 10.3 9.0 2.9 8.4 10.0 7.9 45 0 0 0 2.8 1.9 1.1 5.8 6.4 6.0 48 0 0 0 1.5 1.0 0.6 5.5 5.9 5.4 53 0 0 0 0.6 0.7 0.5 6.0 6.0 4.6 55 0 0 0 4.9 3.0 1.8 5.1 6.4 4.9 64 0 0 0 2.7 1.5 0.7 5.7 6.2 4.3
-_--- _._~ __-______
Average 0 0 0 3.8 2.9 1.3 6.1 6.8 5.5 M-12 Exclosure (sprayed 1952 - fenced April 1954)
1 0 0 0 5.7 3.4 14.2 11.9
45 0 0 0 1.6 1.2 4.3 4.0
55 0 0 0 No 1.4 1.0 No 2.9 2.8
71 0 0 0 data 1.4 1.1 data 4.1 1.1
73 0 0 0 0.2 0.2 3.1 2.2
87 0 0 0 0.6 0.4 0.9 0.8
-______
Average 0 0 0 1.8 1.2 4.9 3.8
~______________
172 W. M. JOHNSON
Table 3. Average number of plants and crown area of big sagebrush inside exclosures.
Plants 1 Live crown l
Plots used 1953 -___- 1954 1956 -___ 1953 1956
Pet. kill No. No. No. Sq.ft. Sq.ft.
M-l Exclosure (sprayed 1949-fenced April 1951)
0 13.4 13.5 10.2 3.6 6.1
55 7.3 7.2 6.3 1.5 3.5
62 5.2 5.4 4.3 0.6 1.8
68 3.6 3.8 2.2 0.7 1.6
69 2.9 2.7 2.2 0.3 0.8
72 6.0 6.0 5.1 1.0 2.4
77 1.7 1.7 1.2 0.2 0.8
86 2.1 2.0 2.0 0.2 0.8
95 0.8 0.8 0.6 0.1 0.3
__I____
Average 4.8 4.8 3.8 0.9 2.0
M-12 Exclosure (sprayed 1952 - fenced April 1953)
4 18.7 19.0 10.8 2.9 5.5
45 8.6 8.3 7.1 0.7 2.1
48 7.0 6.9 6.0 0.5 1.7
53 6.6 6.7 5.1 0.6 2.2
55 10.0 9.4 6.7 0.6 2.0
64 8.4 7.7 5.0 0.6 1.7
-
.-l_____l__
Average 9.9 9.7 6.8 1.0 2.5
--___ _-____ -
M-12 Exclosure (sprayed 1952 - fenced April 1954)
1 19.9 15.3 3.4 5.5
45 5.9 5.2 0.7 1.9
55 No 4.3 3.8 0.5 1.4
71 data 5.5 2.2 0.5 1.1
73 3.3 2.4 0.2 0.5
87 __- 1.5 1.2 - 0.1 0.3
-
-- __ .__.
Average 6.7 5.0 0.9 1.8
_ 1 Per 50-square-foot subplot
general trend. practically nonexistent on areas
3. Sagebrush seedlings were protected from grazing.
4. On areas protected from grazing there were fewer young plants than on grazed areas. Also young plants were more abun- dant where the kill was light.
5. In spite of a downward trend in numbers of sagebrush plants inside exclosures, there has been an increase in the area of live crowns.
LITERATURE CITED
ALLEY, H. P., D. W. BOHMONT AND L. W. WELDON. 1956. Chemical sagebrush control, summary of four years’ data. Wyo. Agr. Exp. Sta. Circ. No. 67. 7 pp. (Mimeo.)
BEETLE, A. A. 1955. Field germina- tion and grass seedling establish- ment on range lands. Wyo. Range Mangt. No. 87. 3 pp. (Mimeo.)
BOHMONT, DALE W. 1954. Chemical sagebrush control - good and bad. Wyo. Agr. Exp. Sta. Circ. 54. 7 PP.
HULL, A. C., JR., N. A. KISSINGER, JR.
AND W. T. VAUGHN. 1952. Chemical
control of big sagebrush in WYO- ming. Jour. Range Mangt. 5: 398- 402.
KISSINGER, N. A. JR., A. C. HULL, JR. AND W. T. VAUGHN. 1952. Chemical control of big sagebrush in central Wyoming. Rocky Mountain Forest 8~ Range Exp. Sta. Station Paper No. 9. 15 pp. (Processed.)
Infersociety Forage Evaluation Symposium Purdue University, August 4, 1958. A FULL DAY SYMPOSIUM ON FORAGE EVALUATION
IS BEING HELD AT PURDUE UNIVERSITY, LAFAYETTE, INDIANA, AUGUST 4, IN CONNECTION WITH THE MEET- ING OF THE AMERICAN SOCIETY OF AGRONOMY, WHICH WILL BE HELD ON THE PURDUE CAMPUS, AUGUST 4-8. THE INTERSOCIETY FORAGE EVALUATION SYMPOSIUM IS BEING SPONSORED BY THE AMERICAN SOCIETY OF ANIMAL PRODUCTION, THE AMERICAN DAIRY SCIENCE ASSOCIATION, THE AMERICAN SOCIETY OF RANGE MANAGEMENT, AND THE AMERICAN SOCIETY OF AGRONOMY. THE SYMPOSIUM PROGRAM STARTS AT 9:30 A.M.
INFORMATION 0N HOUSING AT THE MEETING CAN BE OBTAINED BY WRITING THE DIRECTOR, MEN’S RESI- DENCE HALLS, PURDUE UNIVERSITY, LAFAYETTE, IN- DIANA.
THE PAPERS SCHEDULED FOR PRESENTATION AT THE SYMPOSIUM ARE:
1. The significance of and techniques used to measure forage intake and digestibility. M. E. M~C.TJ&&OUS;H-GEORGIA.
2.
3.
4.
5.
6.
7.
8.
The use of the esophageal fisfula, lignin and chromogen fechniques for studying selective grazing and digesfibilify of range and pasture by sheep and cattle. W. C. WEIR, J. H. MEYER AND G. B. LOFGREEN-CALIFORNIA.
Intake and digestibility techniques and supple- mental feeding in range forage evaluation. L. E. HARRIS AND C. W. COOK-UTAH.
Animal variation and measurements of forage qualify. G. 0. MOTT-INDIANA (PURDUE).
Progress in feed evaluafion. MAX KLEIBER- CALIFORNIA.
Relafionship of digestion end-producfs fo fhe energy economy of animals. J. C. SHAW- MARYLAND.
Yield and quality of forage under grazing and clipping. R. E. BLASER-VIRGINIA.