39 |
P a g e
www.ijarse.com
A NOVEL FRAMEWORK FOR CLASSIFICATION OF
BENIGN AND MALIGNANT DATA UNITS BASED ON
LEARNING METHODS
Vijaya Sri Kompalli
1, K Anand Kumar
2, Prof.S.V.Achutha Rao
31
Pursuing M.Tech(CSE),
2Asst. Professor in Department of CSE ,
3HOD
Vikas Group of Institutions, Nunna, Vijayawada. Affiliated to JNTU- Kakinada, A.P, (India)
ABSTRACT
Here in this paper, we are working to classify the benign and malignant data from a set of data units purely
based on the learning data. Using this approach we can classify the data and that is very helpful in the medical
world to identify the illness at the early stages. However the existing techniques like Support Vector Machine
(SVM) do not provide the better efficiency in extracting the harmful data and so the proposed system takes the
help of Naive Bayesian technique which will classify the data into two groups; a. Data that will purely fall
under the malignant unit, and b. Data accordingly will be segregated into the benign and malignant area. Naive
Bayesian is comparatively better for the data mining and for easy understanding various experimental
calculations are carried out based upon the results it can be concluded that the classification of benign and
malignant data units is done in an efficient manner.
Keywords
:
SVM Mining, Naive Bayesian Analysis, Benign Data, Malignant Data.
I
INTRODUCTION
In medical field the reports are generated purely based on the diagnosis. But not all the decisions can be taken
purely based on the diagnosis results, it is considered to be an analysis of the current state or situation. To have a
clear idea about the process, there are many steps involved in the implementation process and which will be
carried out step by step. As we are planning to have an analysis based implementation process, we need to
design a system that will involve the generation of the sequences which will be a combination of both benign
and malignant data. Our proposed work is carried out to separate these two and to calculate a cut-off region that
gives a report stating that values falling in this range are safe. As we already know that the results are purely
decided based upon the analysis, so we need more and more data as an input to take decision. In the existing
approach, SVM mining is used to extract the data units which are considered to be benign and malignant units.
Actually the system contains both these units in a combination manner; our work should separate these units and
must be able to give a region that will have a safe data. Our proposed work involves mainly the below steps,
1. Generation of the sequences
40 |
P a g e
www.ijarse.com
3. Plotting the experimented result
4. Calculating the threshold value.
With the above four steps, we can gather the safe data by segregating and coming to a conclusion that says the
values falling within this range can be considered as safe zone. To understand the proposed work more
efficiently we have classified this paper.
II
RELATED
WORK
As said already this paper purely deals with the classification of determinable and indeterminable data. For
doing so we have classified our work into categories step wise i.e.
Firstly we need some data for doing the analysis and to have data we are taking the help of Random class from
the utility package. This class purely generates set of values which is combination of both. Our work purely
depends on the segregation i.e. soon after the input is taken, threshold value is also calculated. This value gives
clarity to the user about the stable value. Value that fall within this range can be considered as the stable value
and error free value. We are classifying the values into benign and malignant data purely based on the algorithm
designed i.e. Naive Bayesian protocol. Naive Bayes Classifier is based on the Bayesian theorem and is
particularly suited when the input is high.
Fig. 1: Naive Bayesian Classifier
To understand the concept of naive bayes classification, consider the above figure where we can see that data is
plotted in the two different shades i.e. green and red. From the above data we can see that there are twice as
many as red objects. In Bayesian analysis, this type of belief is known as prior probability. These probabilities
are on the previous experience, in this case percentage of green and red are used to predict the outcomes before
they actually happen.
Thus, we can provide the equation,
Prior probability for green
Prior probability for red
41 |
P a g e
www.ijarse.com
Fig. 2: Classification
In the above graph we can see that, a new object is formed i.e. white circle. Since the objects are well clustered,
it will be reasonable to assume that there are more green objects than red in the vicinity of x. We have to
calculate the likelihood using the below equations,
Livelihood of X given green
Livelihood of X given red
In the final Bayesian analysis, final classification is done by combining both the source of information i.e. the
prior and the likelihood, to form a posterior probability using the Bayes theorem.
To work with the Bayes theorem we require data, and this data in our proposed work is calculated purely based
upon the Random class. This class is a utility class that helps the developer or user to generate the sequence of
values of their choice. Random class can be implemented in the below manner,
Random r=new Random();
Int i=r.nextInt();
Int j=r.nextInt(10);
In the above steps written, we can say that Random class is going to generate two random numbers i.e. one
could be a number without any boundary limit. Coming with the variable j, it is going to store a value that could
be in between 0 and 10. It cannot cross the value 10 as we have given a range in the constructor. Generally this
type of implementation is involved in the real time applications. Coming with the other implementations of this
random class, we can see most common example is generating the otp in bank examples. We might get a doubt
that using this class at single time, how can we get the range of values. To do so, we actually need to generate
series of random number by taking the loop system. And as the generated numbers should not be repeated
values, we need to depend on the other utility classes like the hashset or linkedhashset or treeset. All these three
have their own significance in the implementation process. Hashset is a class that do not allow duplicate values
and at the same time there is a drawback for it i.e. no insertion order is maintained. LinkedHashSet is the class
that maintains the insertion order and does not allow the duplicate values. Treeset is the implementation class
42 |
P a g e
www.ijarse.com
repeatedly, we will get the set of numbers and using the input sequence we get that many sequence numbers. As
the data is ready, we now need to classify the data into two categories i.e. benign and malignant. For classifying
the data as we already studied about the Bayesian theorem, this theorem classifies the data and gives two set of
values.
As the data is made ready with benign and malignant set of values, for better understanding let us plot a graph
taking the help of java api for graph. This API (Application Programming Interface) helps us to know the
classes available for plotting the data in the graphical format and by plotting the data we can get an idea about
the range which gives clear idea about the safe zone.
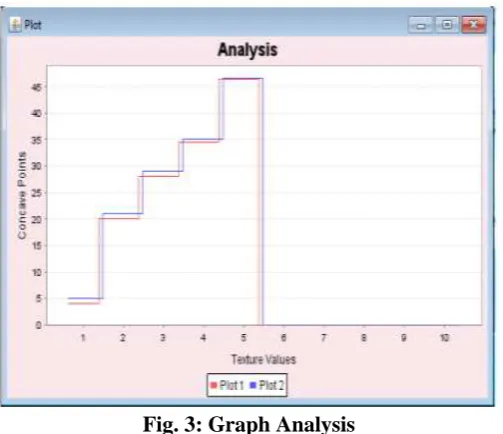
Fig. 3: Graph Analysis
In the above graph, we can see that graph is constantly varying and after reaching certain level with the input
data, the line is straight means to say that it is becoming stable. This means to say that values at that point will
be stable and can be considered as proper set of values or error free.
III CONCLUSION
Proposed work concludes that the work done on the set of data taking the help of various techniques clearly
separates benign and malignant data. Learning data is drawn into the consideration taking the help of Naive
Bayesian and this approach is considerably better that SVM. As a result the graphs plotted gives us
understanding the benign and malignant data units are in sink up to a level could be called saturation level and
there after they are stable. The stable layer says that the values falling in this range are safe and could be
considered as the range or set of data that gives better reliability and can conclude saying that it is a safe range.
This manner our experimental setup gives a better understanding and classification between benign and
43 |
P a g e
www.ijarse.com
REFERENCES
[1] E. Brill and R. C. Moore, “An improved error model for noisy channel spelling correction,” in
Proceedings of the 38th Annual Meeting on Association for Computational Linguistics, ser. ACL ’00.
Morristown, NJ, USA: Association for Computational Linguistics, 2000, pp. 286–293.
[2] N. Okazaki, Y. Tsuruoka, S. Ananiadou, and J. Tsujii, “A discriminative candidate generator for string
transformations,” in Proceedings of the Conference on Empirical Methods in Natural Language
Processing, ser. EMNLP ’08. Morristown, NJ, USA: Association for Computational Linguistics, 2008,
pp. 447–456.
[3] M. Dreyer, J. R. Smith, and J. Eisner, “Latent-variable modeling of string transductions with
finite-state methods,” in Proceedings of the Conference on Empirical Methods in Natural Language
Processing, ser. EMNLP ’08. Stroudsburg, PA, USA: Association for Computational Linguistics, 2008,
pp. 1080–1089.
[4] Arasu, S. Chaudhuri, and R. Kaushik, “Learning string transformations from examples,” Proc. VLDB
Endow., vol. 2, pp. 514– 525, August 2009.
AUTHORS PROFILE
Vijaya Sri Kompalli, pursuing M.Tech(CSE) from Vikas College of Engineering and Technology, Nunna, Vijayawada. Affiliated to JNTU-Kakinada, A.P., India
K Anand Kumar, working as a Associate Professor of CSE department at Vikas College of Engineering and Technology, Nunna, Vijayawada, Affiliated to JNTU-Kakinada, A.P., India