The formation of retrograde planetary orbits by close stellar encounters
M. J. Payne1
, A. C. Boley1
& E. B. Ford1 1
Department of Astronomy, College of Liberal Arts and Sciences, University of Florida 211 Bryant Space Science Center, Gainesville, FL 32611-2055, USA [[email protected]]
Abstract. We consider the growing number of observations of the
Rossiter-McLaughlin effect in transiting planets, which seem to suggest that ∼ 30% of
transiting planets are in highly inclined or retrograde orbits. We consider the dense cluster environment in which stars are born and investigate whether perturbations from passing stars can drive planetary systems into retrograde configurations. We find that fly-bys can result in significantly more inclination excitation than might naively be expected from impulse approximations, leading to several percent of stellar systems possessing planets in retrograde orbits.
1. Introduction
Rossiter-McLaughlin (RM) measurements can determine the alignment between a star’s spin and a transiting planet’s orbit using deviations in the rotational broadening of the
star’s spectrum during the planet’s ingress and egress. It is found in ∼ 30% of the
systems where this measurement has been made that there is a significant misalignment of>40◦and in some cases, the system may even be retrograde (See Triaud et al. (2010) and references therein).
Sculpting of such highly inclined system architectures, dramatically different from that observed in our own Solar System, has been hypothesized to occur via a number of different mechanisms: E.g. Kozai plus tidal damping (Fabryckcy & Tremaine 2007); or planet-planet scattering (e.g., Chatterjee et al. 2008; Nagasawa, Ida & Bessho. 2008).
However, instead of a process internal to the planetary system, the generation of large inclinations might be explained if stellar encounters are considered as an impetus for subsequent dynamics. In this scenario, the system need not ever be in a binary and the planets need not begin as a densely packed system. Because most field stars were likely born in a small cluster that has since dispersed (e.g., Bastian 2008), it is highly
likely that some close encounter will have taken place, although one needs to
under-stand whether such close encounters occur frequently enough and with sufficiently small impact parameter to significantly perturb planetary inclinations in sizable numbers.
Although Laughlin & Chambers (2001) (see also Heggie & Rasio 1996; Bonnell et al. 2001; Spurzem et al. 2009; and Adams 2010 for a review) suggest that the Solar
System did not experience a stellar flyby with a pericenter p < 200 AU, a larger
pericenter passage could be responsible for Sedna’s orbit as well as the sharp edge of the Kuiper belt (Kenyon & Bromley 2004). The possibility that a close encounter could have affected the Solar System, even if only its minor, outer bodies, leads us
© Owned by the authors, published by EDP Sciences, 2011
to re-examine stellar flybys, but for planetary architectures much different from the Solar System. In particular, the existence of wide-orbit substellar companions (e.g., HR8799b,c,d, Marios et al. 2008) suggests that planetary systems could have large cross sections initially, and are subsequently altered by their birth environment. In this paper, we determine the inclination distribution for planetary systems affected by stellar flybys, under the assumption that many planetary systems have or had one massive object at large radii.
2. Methodology
2.1 General Approach
We want to calculate the proportion of field stars which have had inclinations above some critical value, ic, induced in at least one of their planets. We chose ic = 40◦, as
systems in which this level of inclination is induced have a chance to then experience further evolution via the Kozai mechanism. We write this as:
F>40◦ =
Z N1
N0
dFN
dN dN Z p∞
0 ∂fe
∂pdp fi>40◦
where,F>40◦ is the fraction of stars in the field expected to have planets with
inclina-tions> 40◦, fi>40◦ =fi>40◦(p) is the fraction of systems which are excited toi >40◦
due to a stellar close approach < p au, fe = fe(p, N) is the fraction of stars which
experience an encounter with a pericenter≤pau (Dependent on cluster size, N), and FN =FN(N) is the fraction of stars now in the field which came from a cluster of size
N.
Proszkow & Adams (2009) characterized the encounter rates for stars in cluster sizes betweenN = 100 and 3000 for a wide range of parameters. We focus on the results from their subvirial initial conditions with a cluster core scaling ofrc = 1 pc (N/300)1/2.
An approximate fit to their data allows us to find an expression forfe(p, N). Following
this, we need to describe the number of stars which are born in clusters of a given size. We chose to use the canonical star cluster mass function (mdfm/dm ∼ m−1) to find
FN(N). This means that we simply need to characterizefi>40◦ in order to findF>40◦.
2.2 Numerical Methods 1: Scattering Experiments
We use the GPU code “swarm-NG” (which is a publicly available1
) to perform large numbers of scattering experiments, in which a “target” planetary system has a per-turbing star “thrown” at it. To check the accuracy of the simulations, we also re-ran a subset of the integrations using the “Mercury” package of Chambers (1999).
While we ran experiments to understand the effects of close encounters on a wide variety of different system configurations, the general set-up is to have (i) a massive (1-10 Jupiter masses,MJ) planet on a wide orbit (∼100 au), and (ii) an inner system
consisting of N-planets, with 0≤ N ≤ 3 <, with these inner planets having masses
∼ 1MJ, and semi major axes randomly distributed in log-space between 10 - 100 au
(but always with a separation>3 Hill radii). Each set of experiments would typically consist of 10,000 realizations of the same system, with the initial positions of the inner planets randomized, and the approach angle and close approach of the perturbing star randomized (but restricted to be<1,000 au).
1
Between each experiment, we would vary parameters such as the mass of the perturber, the number of perturbers, the number of internal planets, etc, etc. These scattering experiments are all run for∼105
yrs, providing detailed information on the conditions which immediately result from the close-encounter.
2.3 Numerical Methods 2: Long Term Post-Encounter Evolution
A further, more numerically demanding, set of simulations were also conducted on a subset of the systems (using the “Mercury” integrator in hybrid-symplectic mode) to follow the evolution of the planetary systems from∼105
yrs to 108
yrs. This additional set of experiments was conducted to allow us to understand whether any significant further inclination evolution (along the lines of that observed in Nagasawa et al. 2008) would occur due to long term scattering and / or secular effects.
3. Inclination Excitation due to Close Encounters
0.001 0.01 0.1 1
0 100 200 300 400 500 600
fe>0.1
Pericenter (AU) M1 M2 M2C M3 Mercury M3
0.001 0.01 0.1 1
0 100 200 300 400 500 600
fi>40
Pericenter (AU) M1 M2 M2C M3 Mercury M3
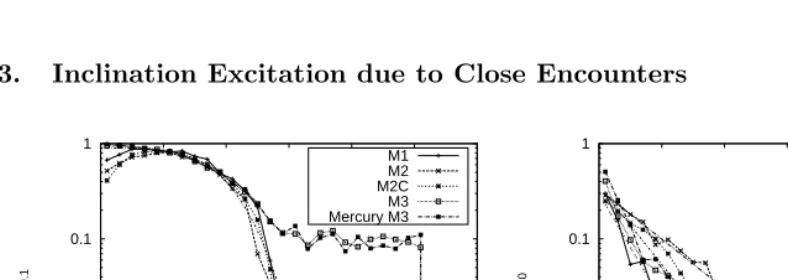
Figure 1: Eccentricity and inclination excitation plotted as a function of the close approach distance, p. The lines give the fraction of systems which were excited to eccentricitiese >0.1(fe>0.1), and inclinations greater than40◦ (fi>40). The plot labels are as follows: M1 (outer planet only) , M2 (outer planet only, binary perturber), M2C (outer planet only, circular binary perturber), M3 (outer planet plus 3 inner planets) and Mercury M3 (M3 repeated using Mercury routine).
In Fig 1., we plot fe>0.1, the fraction of systems which are excited toe >0.1, and
fi>40, the fraction of systems excited to i >40◦. From this, it is clear that inclination
excitation has (i) a significantly weaker dependence on the distance of closest approach, p, than does eccentricity excitation, and (ii) a very close approach (<100au) is required to get even 10% of the systems experiencing such a fly-by to have a resultant inclination excitation >40◦ from a single encounter.
Table 1: Table of results to illustrate the dependence of the expected fraction of field stars with inclinations>40◦,F
>40◦, on the assumed minimum cluster size,N0. We find that
1 - 3 % of systems could have inclinations>40◦immediately excited by close-encounters
(see results in center column for results at105
yrs). After extending simulations to108 yrs and counting the fraction of system which ever experienced inclinations >40◦, we
find the results given in the two left-hand columns. Note that figures given at 108 yrs for all planets as well as the inner planet only.
F>40◦ (105 yrs) F
>40◦ (108 yrs) F
>40◦(108 yrs)
N0 N1 Direct Excitation Max Inc. Ever Max Inc EverInner
10 104
0.03 0.19 0.08
30 104
0.02 0.11 0.04
100 104
0.01 0.06 0.02
4. Inclination Excitation due to Long Term Evolution
0.0001 0.001 0.01 0.1 1
40 80 120 160
fi>40
imax 105 years 108 years
0 0.1 0.2 0.3 0.4 0.5
40 80 120 160
Fraction of Systems
imax Max i at 108 years Max in Any Planet Ever Max in Inner Planet Ever
Figure 2: Inclination excitation after long-term integrations (108
yrs) of the M3 system. In Fig 2(a) we show that the distribution of inclinations at108
yrs (large filled circular points) is very similar to that at 105
yrs. In Fig 2(b) we demonstrate that during the course of the system evolution, significantly higher inclinations can occur for some portion of the time than is seen simply at the end of the simulations.
We continue the integration of the M3 system to 108
yrs, and plot the distribution of inclinations at 105
and 108
yrs in Fig. 2(a). It is clear that very little subsequent evolution occurs. However, it is important to note that out long-term simulations do not include tidal damping, and as such we do not have any method by which high inclinations could be “locked-in” (as occurred in the simulations of Nagasawa et al. 2008).
If we take these results and again combined them with the rate and distribution assumptions of Eqn 1 - 3, we find the results shown in Table 2. Here it can be seen that overall 6−19% of systems will at some point experiencei >40◦ in at least one of their planets, while 2−8% will experience such a high inclination in their inner planet. It is thus likely that a plausible upper bound on the fraction of systems with hot-Jupiter with i > 40◦ would be 8% (as the inner planets would be the only ones that would tidally damp).
We emphasize that in all of our simulations we assumed the existence of a planet at large semi-major axes (100 AU). If such planets are rare, then the figures we calculate would have to be revised downwards accordingly.
5. Conclusion
Close approaches can induce large inclination excitation in stellar systems. The frac-tion of field stars in which direct excitafrac-tion of i >40◦ has taken place may be in the
1−3% range, but there are strong dependencies on the assumptions one makes
regard-ing cluster size distributions, interaction rates, etc. Subsequent long-term evolution
may substantially increase this fraction to levels ≤8%, but much more detailed
mod-eling will be required to understand whether such levels can be realized when realistic tidal damping models are included. Our ongoing investigations aim to more fully pa-rameterize the initial scattering phase, as well as understanding how much additional inclination excitation can take place in the long-term, and to place these figures into context, allowing comparison with the level of excitation expected from other excita-tions mechanisms.
Acknowledgements. MJP is very grateful to the organizers of the conference, both for the initial opportunity to contribute, as well as their subsequent patience during the write-up process.
References
Adams, F.,C. 2010, ARAA, 48, 47A Bastian N., 2008, MNRAS, 390, 759
Bonnell I. A., Smith K. W., Davies M. B., Horne K. 2001, MNRAS, 322, 859 Chambers J. E. 1999, MNRAS, 304, 793
Chatterjee, S., Ford, E. B., Matsumura, S., & Rasio, F. A. 2008, ApJ, 686, 580 Fabrycky, D. & Tremaine, S. 2007, ApJ, 669, 1298
Heggie D. C., & Rasio F. A. 1996, MNRAS, 282, 1064 Kenyon S. J. & Bromley B. C. 2004, Natur, 432, 598 Laughlin G. & Chambers J. E. 2001, ApJ, 551, L109
Marois C., Macintosh B., Barman T., Zuckerman B., Song I., Patience J., Lafreni`ere D., & Doyon R. 2008, Sci, 322, 1348
Nagasawa, M., Ida, S., & Bessho, T. 2008, ApJ, 678, 498 Proszkow E.-M. & Adams F. C., 2009, ApJS, 185, 486
Spurzem R., Giersz M., Heggie D. C. & Lin D. N. C., 2009, ApJ, 697, 458