Merrill, Christine Lee. Molecular mechanisms of etomoxir-induced toxicity. (Under the direction of Kevin T. Morgan and Talmage T. Brown).
Etomoxir (ET) is a member of a family of substituted 2-oxirane-carboxylic acids that inhibit mitochondrial long-chain fatty acid β-oxidation (FAO), ketogenesis and gluconeogenesis. Once converted to its CoA ester, ET irreversibly binds to the CPT-1 catalytic site and prevents long chain fatty acids from entering the mitochondrion. Along with this inhibition of FAO, ET causes a shift in energy substrate utilization from fatty acids to glucose, leading to systemic
decrease in mitochondrial membrane potential and ATP levels implicated
impairment of mitochondrial energy metabolism. Other gene expression findings suggested activation of p53, DNA repair and cell cycle arrest. In rats, ET induced a strong mitogenic response in the livers of rats 24 h after administration of one 25 mg/kg dose, that was consistent with the cell proliferation caused by
Molecular mechanisms of etomoxir-induced toxicity
By
Christine Lee Merrill
A dissertation submitted to the Graduate Faculty of
North Carolina State University
In partial fulfillment of the Degree of
Doctor of Philosophy
COMPARATIVE BIOMEDICAL SCIENCES
Raleigh
2002
APPROVED BY:
____________________________ ____________________________
Talmage T. Brown Kevin T. Morgan
Co-chair of Advisory Committee Co-chair of Advisory Committee
____________________________ ____________________________ Richard T. Miller Philip L. Sannes
ii
BIOGRAPHY
Christine (Chris) Lee Merrill was born August 23, 1956 in Mount Clemens,
Michigan to Carol and Fred Merrill. She graduated from Murphy High School,
Mobile, Alabama in 1974. In 1978, Chris graduated from Auburn University with a
Bachelor of Science degree in Secondary Science Education and a minor in
German Language. She taught 7th grade biology for two years in Smyrna, Georgia. After two years of the hardest work in her life, Chris left teaching and
returned to school to complete pre-requisite courses needed to apply to
veterinary school. In 1988, she graduated from the College of Veterinary
Medicine at North Carolina State University with a Doctor of Veterinary Medicine
degree. Chris worked 7 years in toxicology at Becton Dickinson and Company,
Research Triangle Park, NC, managing an experimental studies group which
evaluated prototype medical devices for safety and efficacy. An opportunity to
expand her education and realm of experience presented itself in 1995 and Chris
rejoined North Carolina State University-College of Veterinary Medicine for 2
years more as a resident in anatomic pathology. After completion of the
residency, she entered a Ph.D. program at NCSU in pathology during which time
she successfully completed her boards in Veterinary Anatomic Pathology and
became a member of the American College of Veterinary pathologists. She
joined GlaxoSmithKline pharmaceutical company as a Director of Regulatory and
ACKNOWLEDGEMENTS
I would like to thank Drs. Ron Tyler, Ruth Lightfoot and Henry Wall and
GlaxoSmithKline for tremendous support that I received during my Ph.D.
program. I could not have done it without them and I do intend to pay it forward.
My thanks also go out to Dr. Kevin Morgan for his brilliant mind, original view of
the world and persistent reminders to “get it done”. I appreciate the strong
background in pathology that I received under the tutelage of Drs. Talmage
Brown, John Cullen, Rich Miller, Don Meuten, and John Barnes at NCSU. A big
thank you goes to the members of my Ph.D. committee who are not already
thanked above, Drs. Tony Fox and Phil Sannes.
On a personal note, I would like to thank my parents, Fred and Carol Merrill, who
always stressed the importance of education and who helped support me,
financially and otherwise, throughout the many years that I have been in school. I
very much want to thank Gail Hafley, from the bottom of my heart, for the
tremendous support and compassion that she has afforded me during this long
iv
TABLE OF CONTENTS
LIST OF TABLES ... vi
LIST OF FIGURES ...vii
LIST OF ABBREVIATIONS ... ix
GENERAL INTRODUCTION Body... 1
References ... 21
MANUSCRIPT I ... 31
Abstract... 32
Introduction ... 33
Materials and Methods... 35
Results... 42
Discussion ... 46
References ... 53
Tables and Figures ... 59
MANUSCRIPT II ... 70
Abstract... 71
Introduction ... 72
Materials and Methods... 75
Results... 81
Discussion ... 91
Tables and Figures ... 104
vi
LIST OF TABLES
MANUSCRIPT I
Table 1.1: Cell Counts, Mitotic Index, Apoptotic/Necrotic Index ...59
Table 1.2: ET-induced mRNA expression changes ...60
MANUSCRIPT II
Table 2.1: Day 2 Cell Proliferation Gene Changes ...104
LIST OF FIGURES
GENERAL INTRODUCTION
Figure 0.1: The structural formula of etomoxir...2
MANUSCRIPT I Captions for Manuscript I Figures ... 61
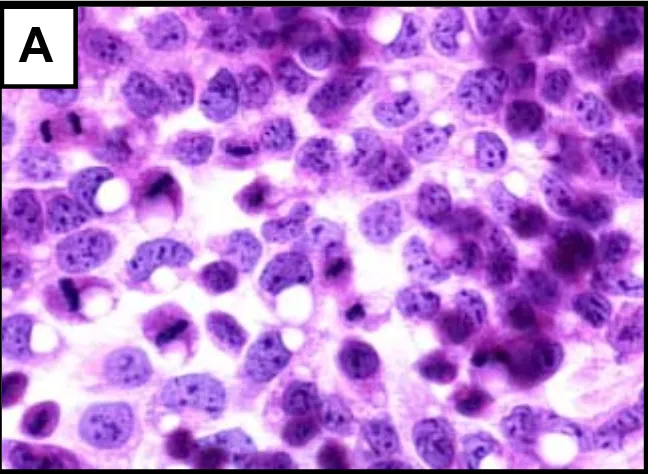
Figure 1.1:Morphologic changesin control vs. 1 mM ET-treated HepG2 cells... 63
Figure 1.2:Microarray platform gene expression changes confirmed by RT-PCR... 64
Figure 1.3: RT-PCR analysis of 7 stress genes in timecourse study... 65
Figure 1.4: Depletion of GSH, decrease in GSH:GSSG ratio, increase in GSSG... 66
Figure 1.5: Superoxide radical generation... 67
Figure 1.6: ATP assay... 68
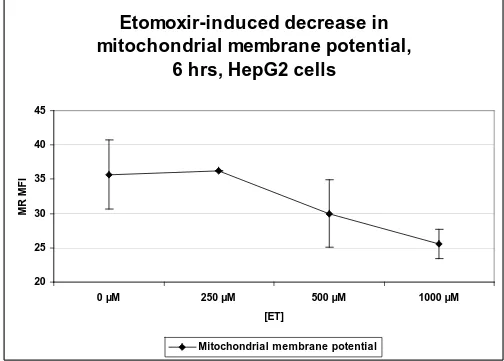
Figure 1.7: Dose-dependent reduction in mitochondrial membrane potential... 69
MANUSCRIPT II Figure 2.1: Serum triglyceride changes... 106
Figure 2.2: Increase in mitotic figures (photomicrograph)... 107
Figure 2.3: Increase in mitotic figures (bar chart)... 108
Figure 2.4: Day 2 Growth-related gene expression changes... 109
Figure 2.5: Platform comparison: cell proliferation gene expression changes... 110
Figure 2.6: Day 11 Growth-related gene expression changes... 111
viii
Figure 2.8: Day 85 Growth-related gene expression changes... 113
List of Abbreviations
ACC, acetyl-CoA carboxylase ACLY, ATP citrate-lyase ADP, adenosine diphosphate ADCY, adenylyl cyclase
cAMP, cyclic adenosine monophosphate AMP, adenosine monophosphate ANOVA, analysis of variance
ANT, adenine nucleotide translocase AOX, acyl-CoA oxidase
APC, adenomatous polyposis coli ATP, adenosine triphosphate
CACT, carnitine-acylcarnitine translocase CCNC, cyclin C CCND3, cyclin D3
CCNE, cyclin E
CDC20, cell division cycle 20 homolog – aka p55cdc CDC25B, cell division cycle 25B
CDK1, cyclin dependent kinase 1
CDK2B, cyclin dependent kinase –2 beta
CDK5, cyclin dependent kinase 5 – aka cdc2-related protein kinase CDKN1A, cyclin-dependent kinase inhibitor 1A
CDKN1B, cyclin-dependent kinase inhibitor 1B - aka p27 CL-6, delayed-early insulin-induced gene CL-6
COT, carnitine octanoyl transferase
x
CYP1A1, cytochrome P450 1A1 CYP4A, cytochrome P450 4A family EB, ethidium bromide
ECI, δ3, δ2-enoyl-CoA isomerase EDN1, endothelin-1
EGR1, early growth response 1
ERK1, extracellular signal-regulated kinase 1 ET, etomoxir
FAO, fatty acid oxidation FAS, fatty acid synthase
FAT, fatty acid translocase – aka CD36 FATP, fatty acid transport protein FOS, c-fos mRNA
G-6-P, glucose-6-phosphate
GADD153, DNA damage-inducible gene 153 GADD45, DNA damage-inducible gene 45 GAP, GTPase activating protein
GCLM, γ-glutamate-cysteine ligase modifier subunit GHRH, growth hormone releasing hormone
GHRHR, growth hormone releasing hormone receptor GIP, glucose-dependent insulinotropic peptide
GSH/GSSG, reduced/oxidized glutathione ratio GSR, glutathione reductase
GSSG, oxidized glutathione HE, hydroethidine
H&E, hematoxylin and eosin HKII, hexokinase II
HMGCR, 3-hydroxy-3-methylglutaryl coenzyme A reductase HMGCS, 3-hydroxy-3-methylglutaryl coenzyme A synthase HO1, heme oxygenase 1
HSPA1A, heat shock 70kD protein 1 HSP40, heat shock protein 40 homolog IGF1R, insulin-like growth factor 1 receptor
IGFBP1, insulin-like growth factor binding protein 1 IMM, inner mitochondrial membrane
JUN, c-jun
3KACT, peroxisomal 3-ketoacyl-CoA thiolase LCAD, long-chain acyl-CoA dehydrogenase LDH, lactate dehydrogenase
LEP, leptin
LEPR, leptin receptor
LCFA-CoA, long-chain fatty acyl-Coenzyme A
LCFA-CoA/LCFA-carn, long-chain fatty acyl-CoA/long-chain acylcarnitine ratio LIF, leukemia inhibitory factor
LIPE, hormone sensitive lipase
MAPK14, mitogen-activated protein kinase 14 – aka MAP kinase p38 MDM2, mouse double minute 2 homolog
ME1, malic enzyme 1
xii
mRNA, messenger ribonucleic acid MYC, c-myc
NADH, nicotinamide adenine dinucleotide NEFA, non-esterified fatty acids
NF2, neurofibromatosis 2
NIDDM, non-insulin-dependent diabetes mellitus
NR1D1, nuclear receptor subfamily 1, group D, member 1 – aka Rev-ERBA-alpha and thyroid hormone receptor
OGG1, 8-oxoguanine DNA glycosylase 1 OMM, outer mitochondrial membrane OSC, oxidosqualene lanosterol-cyclase
PAI2A, plasminogen activator inhibitor 2 type A PBS, phosphate buffered saline
PCNA, proliferating cell nuclear antigen PDE, cAMP phosphodiesterase
PDK, pyruvate dehydrogenase kinase PDH, pyruvate dehydrogenase
PEPCK, phosphoenolpyruvate carboxykinase PDP, pyruvate dehydrogenase phosphatase PFK-1, phosphofructokinase-1
PFKFB1, 6-phosphofructo-2-kinase/fructose-2, 6-bisphosphatase POCA, clomoxir
PPARα, peroxisome proliferator activated receptor-alpha PPRE, peroxisome proliferator response element
PRPS2, phosphoribosylpyrophosphate synthetase subunit 2 RBC, red blood cell
RT-PCR, real time-polymerase chain reaction SCD2, stearoyl-CoA desaturase
SOD2, Mn+ superoxide dismutase SPAT, serine pyruvate aminotransferase SQLE, squalene epoxidase
TCA, tricarboxylic acid cycle TDGA, tetradecylglycidic acid TG, triglycerides
TGFBR1, transforming growth factor-beta 1 receptor TGFBR2, transforming growth factor-beta 2 receptor TNFA, tumor necrosis factor alpha
TOP2A, topoisomerase Iiα
TP53, tumor protein p53 TXNRD1, thioredoxin reductase
VEGFD, vascular endothelial growth factor D VLCAD, very long chain acyl-CoA dehydrogenase VLDL, very low density lipid cholesterol
General Introduction
Etomoxir (ET) is a member of a family of substituted 2-oxirane-carboxylic acids that inhibits mitochondrial long-chain fatty acid β-oxidation (FAO) by irreversibly binding to the catalytic site of carnitine palmitoyltransferase-1 (CPT-1). CPT-1 is considered the rate-limiting step in the transportation of long-chain fatty acids from the cytosol into the mitochondrial matrix. Secondary to inhibition of FAO, ET causes a shift in energy substrate utilization from fatty acids to glucose, leading to systemic hypoglycemia, hypoketonemia, and hypotriglyceridemia (Wolf 1992). These effects make ET potentially useful in the treatment of
non-insulin-dependent diabetes mellitus (NIDDM). However, the compound has been shown to induce both cardiac and hepatic hypertrophy in animals and, therefore, has not been fully developed as an antidiabetic agent to date (Rupp and Jacob 1992; Vetter et al. 1995; Yotsumoto et al. 2000). The mechanism(s) of the respective hypertrophies have not yet been worked out, but are shown to be different from those involved in hyperthyroidism and hypertension (Rupp and Jacob 1992; Vetter et al. 1995). ET activates PPARα, and PPARα-agonists have been shown
to cause hepatic hypertrophy in rodents, but it has not been demonstrated that ET causes hepatic hypertrophy via activation of PPARα. There are numerous reports in the literature linking the switch of energy substrate from fatty acids to glucose with cardiac hypertrophy, but the effects on liver weight are unclear. It is not yet known whether ET exerts the hypertrophic effects on the liver by
Figure 0.1: The structural formula of etomoxir
Etomoxir (ethyl-2-[6-(4-chlorphenoxy)hexyl]oxirane-2-carboxylate) is arguably the best known and most published member of the oxirane-carboxylate family; other members include tetradecylglycidic acid (TDGA or palmoxirate) and clomoxir (POCA) (sodium-2-[5-(4-chlorophenyl)-pentyl]-oxirane-2-carboxylate). All of these compounds are characterized by their ability to specifically inhibit CPT-1 (EC2.3.1.21). This specificity is attributable to the fact that the inhibitors are not the compounds themselves, but are the corresponding coenzyme A esters of the (R)-(+)-isomers which are formed in the cell by the action of acyl-CoA synthetase (Anderson 1998; Eistetter and Wolf 1986; Schudt and Simon 1984; Wolf 1990). The inhibition of CPT-1 by ET is irreversible due to the covalent binding of the epoxide moiety (Fig. 1) to the substrate binding site of CPT-1 (Declercq et al.
1987; Murthy and Pande 1990; Wolf 1990).
Esters of oxirane-carboxylates are colorless, water-insoluble, oily liquids or low melting point solids that are stable for at least 5 years at room temperature. The sodium salts are crystals with melting points >90º C, water-soluble and stable in the solid form for at least 2 years. In aqueous solutions at a pH between 3.7 and 7, these compounds slowly decompose as the oxirane ring opens. At pH > 8 and due to the action of esterases, the ester linkage is hydrolyzed forming the free acids or the corresponding salts. When in the blood, these substances in this
Cl O
biochemical form mimic fatty acids and are subject to the same transport and transformation reactions, e.g. albumin and fatty acid binding protein binding and intracellular esterification with coenzyme A (Wolf 1990).
CPT-1 is the gatekeeper controlling the entry of long-chain fatty acids into the mitochondrial matrix, thereby controlling rates of mitochondrial FAO. Long-chain fatty acids cannot cross the inner mitochondrial membrane into the matrix without the participation of CPT-1. This enzyme, situated on the inner face of the outer mitochondrial membrane, binds activated fatty acids (fatty acyl-CoA esters) and catalyzes their conversion to acyl-carnitines, releasing coenzyme A to the cytosol in the process. CPT-1 exists as two isoforms encoded by separate genes. Liver-type CPT-1 (L-CPT-1 or CPT-1A) is expressed primarily in liver but is also
expressed at a lower level in all other tissues examined to date. Muscle-type CPT-1 (M-CPT-1 or CPT-1B) is expressed abundantly in the heart, skeletal muscle and brown adipose tissue (Brandt et al. 1998). Another enzyme, the carnitine:acyl carnitine translocase (CACT) positioned within the inner mitochondrial membrane (IMM), shuttles acyl carnitine through the IMM in
exchange for carnitine. Then a second CPT (CPT-2), located on the inner face of the IMM, catalyzes the reverse reaction of CPT-1 forming acyl-CoA in the matrix and releasing carnitine to be shuttled out of the mitochondrion by CACT
When a choice is available, most tissues will use fatty acids as fuels before ketone bodies, and both before glucose (Moran and Scrimgeour 1994). The glucose-fatty acid cycle (Randall Cycle) describes how the preference for a particular energy substrate is determined by metabolic conditions. When blood glucose is low, the production of both glucagon and epinephrine is high which stimulates adenylyl cyclase (converts ATP to cyclic adenosine monophosphate, a.k.a. cAMP) increasing the levels of cAMP. High levels of cAMP trigger
activation of protein kinase A which, in turn, triggers activation of hormone-sensitive lipase in the adipocyte causing release of non-esterified fatty acids (NEFA). NEFA are taken up by tissues and metabolized by beta oxidation and the citric acid cycle to yield reducing power that can generate ATP via electron transport chain and oxidative phosphorylation. Beta oxidation produces
increased levels of citrate, acetyl CoA and NADH which then inhibit glucose oxidation: citrate inhibits phosphofructokinase-1 (PFK-1) and acetyl CoA and NADH inhibit pyruvate dehydrogenase complex by stimulating pyruvate
dehydrogenase kinase (PDK). Therefore, the products of beta-oxidation not only provide a readily available source of reducing equivalents to the cell, but also inhibit glucose utilization.
dephosphorylates hormone-sensitive lipase to the inactive form. The net effect of insulin in this scenario is to inhibit release of NEFA (Moran and Scrimgeour 1994; Murray et al. 2000). Insulin is pivotal in controlling energy metabolism by
stimulating glucose uptake, glycogen synthesis, glycolysis, fatty acid synthesis and esterification and protein synthesis. Inhibitory effects of insulin are
associated with glycogenolysis, fatty acid oxidation, ketogenesis, gluconeogenesis and proteolysis.
Inhibition of CPT-1 causes a shift away from FAO and toward glycolysis, with insulin and glucagon playing major roles in flipping this metabolic switch. A study by Park et al. (1995) showed that the Vmax for CPT-1 in the outer mitochondrial membrane from the livers of both starved and diabetic rats increased 2- and 3-fold respectively over fed control values with no change in Km values for substrates. Regulation of malonyl-CoA sensitivity of CPT-1 in isolated
mitochondrial outer membranes was indicated by an 8-fold increase in Ki during starvation and by a 50-fold increase in Ki in the diabetic state. CPT-1 mRNA was 7.5 fold greater in livers of 48-h-starved rats and 14.6 times greater in livers of insulin-dependent diabetic rats compared with livers of fed rats. In rat H4IIE cells, insulin increased CPT-1 sensitivity to inhibition by malonyl-CoA in 4 h, and
sensitivity continued to increase up to 24 h after insulin addition. CPT-1 mRNA levels in H4IIE cells were decreased by insulin after 4 h and continued to decrease so that at 24 h there was a 10-fold difference. These results suggest that the presence of insulin, directly or indirectly, inhibits transcription of the CPT-1 gene (Park et al. 1995).
In order to understand how the inhibition of FAO could increase the level of glycolysis, we must first review the relevant aspects of intermediary metabolism to better understand effects of ET on the cell and the body as a whole. After a meal, the presence of food in the intestinal lumen causes the secretion of gastrointestinal hormones, such as gastric inhibitory polypeptide and
The increase in blood glucose concentration following absorption of dietary glucose causes the beta cells to release even more insulin (Moran and Scrimgeour 1994). In mammals, sugars are taken into cells by glucose transporters (GLUT), that vary by tissue type and insulin responsiveness. Although genes for 11 GLUT isoforms have been identified in the human
genome, only GLUTs 1-5, 8, and 9 have been shown to transport sugars. GLUT1 is highly expressed in endothelial cells lining the blood vessels of the brain, although it is expressed to some degree in most tissues. GLUT3 is expressed primarily in neurons and together, GLUT1 and GLUT3 allow glucose to cross the blood-brain barrier and enter neurons. GLUT2 is a low affinity (high Km) glucose transporter present in liver, intestine, kidney and pancreatic beta cells, which mediates bi-directional transport of glucose in the hepatocyte. This transporter functions as part of the glucose sensor system in beta cells and in the absorption of glucose by intestinal epithelial cells. GLUT4 is expressed primarily in muscle and adipose tissue and is the major insulin-responsive glucose transporter isoform. GLUT5 is a fructose transporter highly expressed in the intestine, and the recently identified GLUTs 8 and 9 appear to function in blastocyst
development (GLUT8) or in the brain and leukocytes (GLUT9). Since GLUT4 is the insulin-responsive isoform, it has drawn most of the attention of workers in the field of diabetes research (Watson and Pessin 2001).
high levels of G-6-P allosterically inhibit hexokinase, thus controlling rate of entry of glucose into the glycolytic pathway. However, hexokinase isoenzyme IV
(glucokinase) which predominates in the liver and pancreas is free of the G-6-P allosteric control. The free-flow of glucose into the liver via GLUT2 and the rapid conversion to G-6-P enables the liver to store excess glucose in the form of glycogen in times of “feast”. In times of “famine”, GLUT2 is a bi-directional glucose transporter capable of exporting glucose generated via glycogenolysis and gluconeogenesis to the systemic circulation.
The next regulated enzymatic reaction of glycolysis is catalyzed by
phosphofrucokinase-1 (PFK-1) which converts fructose-6-phosphate to fructose 1, 6-bisphosphate. The regulation of PFK-1 is more complex than that of
hexokinase, with several different entities serving as inhibitors or activators. ATP wears 2 hats, acting as both a substrate of PFK-1 and as an allosteric inhibitor. This nucleotide decreases the affinity of PFK-1 for its glycolytic substrate fructose-6-phosphate. AMP is an allosteric activator of PFK-1 that acts by
are high, the enzyme phosphofructokinase-2 (PFK-2) actively converts fructose-6-phosphate to fructose 2,6-bisphosphate, which then stimulates the activity of PFK-1. However, when glucose is low, glucagon activates adenylate cyclase in hepatocytes, forming cAMP which then activates protein kinase A. The active protein kinase A phosphorylates a serine residue in PFK-2 which inhibits the kinase site and activates the separate phosphorylase site of the same
(bifunctional) enzyme. The phosphorylase removes one of the phosphate groups from fructose 2,6-bisphosphate, converting it to fructose-6-phosphate and, thus, removing the stimulus for 1 activation. High levels of citrate also inhibit PFK-2 (Moran and Scrimgeour 1994; Murray et al. 2000).
The third enzyme involved in the regulation of glycolysis is pyruvate kinase, which converts phosphoenolpyruvate to pyruvate. This enzyme is stimulated by fructose 1,6-bisphosphate in a “feed- forward” form of activation and is inhibited by glucagon-activated protein kinase A. When ATP is needed (i.e. during
exercise), AMP levels are high, which removes the inhibition of PFK-1 by ATP. The associated increase in inorganic phosphate within the cell stimulates PFK-2 which increases fructose 2,6-bisphosphate, also removing the inhibition of PFK-1 by ATP. More fructose 1,6-bisphosphate is produced which then increases the activity of pyruvate kinase. Once the ATP supply has been adequately
glycolysis, while the over-abundance of glycolytic intermediates, the presence of ATP, and/or the influence of glucagon (in hepatocytes) will dampen glycolytic activity.
Poised at the interface between the glycolytic pathway and the TCA cycle, pyruvate is a versatile intermediate. The metabolic and oxidative condition of the cell will determine the fate of pyruvate. For example, if the cell is in oxygen deficit (as in muscle during prolonged contraction), then pyruvate can be converted to lactate by lactate dehydrogenase. This reaction also helps to allow continuance of oxygen-independent glycolysis by providing the oxidized NAD+ required to convert glyceraldehyde-3-phosphate to 1,3 bisphosphoglycerate in the presence of glyceraldehyde-3-phosphate dehydrogenase (GPD2). If the cell is in a state of anabolism, and citrate is being shuttled to the cytosol to synthesize fatty acids, then pyruvate can be carboxylated to form oxaloacetate (anaplerosis),
is stimulated by NADH, acetyl-CoA, and ATP, and is inhibited by high levels of pyruvate, ADP and Ca2+. PDP is stimulated by Ca2+ and, in adipose tissue, by insulin.
Three non-equilibrium enzymatic reactions within the TCA cycle are considered to be points of regulation: citrate synthase, isocitrate dehydrogenase, and α-ketoglutarate dehydrogenase. All three of these reactions are stimulated by Ca2+, which is high in muscle during contraction. ATP and long chain fatty acyl-CoA inhibit citrate synthase. The presence of oxidized dehydrogenase cofactors (e.g. NAD+) is required for the isocitrate dehydrogenase and α-ketoglutarate
dehydrogenase steps. In general, the TCA cycle is enhanced by low ATP/ADP and NADH/NAD ratios and stimulated by the inverse ratios.
Electron transport and oxidative phosphorylation are the final steps down the pathway to generate ATP from energy substrate. Because neither oxidized nor reduced NAD(H) can diffuse through the inner mitochondrial membrane, shuttle systems are in place to transfer reducing power from the cytosol to the
mitochondrial matrix. There are 2 shuttle systems involved in this energy transfer: the malate-aspartate shuttle (more active in the liver) and the glycerol-phosphate shuttle. In both shuttles, NADH, the reduced co-enzyme generated during
mitochondrial matrix, the NADH is then oxidized by Complex I of the electron transport chain, which then passes the electrons to Q to form QH2. As part of the TCA cycle, succinate is oxidized to fumarate by Complex II (succinate
dehydrogenase complex) which then donates 2 electrons to Q. The electrons are transferred from QH2 to Complex III, to cytochrome c to Complex IV and then to the final electron acceptor, oxygen. This overall transfer of electrons is down an energetically favorable gradient, which provides the needed impetus to move protons from the matrix to the intermembrane space, creating the chemical and electrical energy gradient that drives the formation of ATP. Complex V uses the influx of protons (proton-motive force) through its channel to drive the conversion of ADP to ATP. The concept of a proton-motive force driving the formation of ATP, was formulated by Peter Mitchell in the early 1960’s and is referred to as the chemiosmotic theory. In order to provide the substrate needed for this reaction, both ADP and inorganic phosphate (Pi) must be transported into the matrix. The adenine nucleotide translocase (ANT) exchanges ATP from the matrix for cytosolic ADP and the hydrogen-phosphate symporter transports both hydrogen ions (H+) and Pi into the matrix. Control of oxidative phosphorylation is based on substrate availability (NADH, O2, and Pi) and need for ATP.
Now that we have reviewed the relevant aspects of intermediary metabolism, the effects of ET on the cell and the body as a whole can be examined more
in diabetic and fasted animals and humans, ET is associated with a decrease in serum glucose, triglycerides, NEFA, cholesterol, and ketones (Anderson 1998; Eistetter and Wolf 1986; Spurway et al. 1997; Wolf 1990, 1992). Researchers disagree whether or not blood glucose decreases in ET-dosed, healthy, fed subjects. In one 8 day study of healthy, fed rats dosed with 18 mg/kg/day ET, serum glucose dropped 27% (Schmitz et al. 1995). This contrasts with another study in which healthy, fed rats were dosed with 8 mg/kg/day ET for 4 weeks with no significant change in serum glucose (Rupp and Jacob 1992). Here the
difference may be attributable to the dose (the lower dose showing no change in glucose) or to the duration of dosing (the longer duration providing more time for the body to become tolerant to the drug). The effects of ET on lipid metabolism vary depending on the duration of dosing. The acute effect consists of a time and dose-dependent increase in NEFA, which is inversely correlated with the
decrease in glucose. This effect occurs only in fasted subjects and is presumed to be due to the epinephrine-induced hormone-sensitive lipase. Because NEFA cannot be oxidized while cells are under the influence of ET, they are
re-esterified in the liver and released into the blood packaged as very low density lipid cholesterol (VLDL). When nicotinic acid, an inhibitor of lipolysis, is
heart and liver, which causes an increase in clearance of triglycerides from plasma (Agius and Alberti 1985; Rogers 1987). ET also causes an increase in intracellular hepatic and cardiac triglyceride content (Abdaleem and el-Merzabani 1997; Koundakjian et al. 1984; Schmitz et al. 1995; Spurway et al.
1997; Yotsumoto et al. 2000).
The biochemical effects associated with ET are directly associated with the inhibition of FAO. Blockage of CPT-1 leads to the following intracellular
biochemical alterations: decrease in acetyl-CoA and NADH/NAD ratio, and an increase in the long-chain fatty acyl-CoA/long-chain acylcarnitine ratio (LCFA-CoA/LCFA-carn). The combination of decreased acetyl-CoA and NADH/NAD ratio cause inhibition of PDK, which allows full activation of PDH, thus increasing flux through glycolysis. Decreased acetyl-CoA also deactivates pyruvate
carboxylase, a key enzyme in gluconeogenesis; and decreases
but also causes feedback inhibition of lipolysis and fatty acid synthesis (Spurway
et al. 1997; Wolf 1992).
There is some evidence that high and low concentrations of ET may have
opposite effects on lipid metabolism in hepatocytes. According to Spurway, et al. 1997, low concentrations of ET increase NEFA esterification and TG secretion, and inhibit TG depletion by inhibition of FAO. High concentrations of ET inhibit lipolysis, esterification and TG secretion (Spurway et al. 1997). The inhibitory effects of ET on fatty acyl esterification and TG secretion may be attributable to activation of PPARα and the associated increase in peroxisomal fatty acid oxidation, but this was not addressed in these studies.
ET and other CPT-1 inhibitors are reported to increase peroxisomal FAO, both directly and indirectly, via the peroxisome proliferator activated-receptor α
(PPARα) (Forman et al. 1997; Intrasuksri et al. 1998; Kaikaus et al. 1993; Portilla
et al. 2000; Skorin et al. 1992). Upon activation by one of several ligands, PPARα can heterodimerize with the retinoid X receptor, bind to the peroxisome proliferator response element (PPRE) and initiate transcription of numerous lipid metabolizing genes. The latter include those genes concerned with mitochondrial and peroxisomal β-oxidation, cholesterol synthesis and fatty acid transport
which then act as ligands to further activate PPARα. The following genes contain PPREs and serve as markers of PPARα activation by their up regulation: acyl-CoA oxidase (AOX), acyl-acyl-CoA synthetase, cytochrome P450 4A family (CYP4A), multifunctional protein, 3-ketoacyl-CoA thiolase (3KACT), CPT-1, HMG-CoA synthase (HMGCS), fatty acid binding protein, malic enzyme, acyl-CoA
dehydrogenases, phosphoenolpyruvate carboxykinase (PEP-CK), and steroyl-CoA desaturase (SCD). Other genes with PPREs down regulated by PPARα include fatty acid synthase (FAS), apolipoprotein AI, and apolipoprotein CIII (Latruffe and Vamecq 1997; Yu et al. 1998). Obviously, PPARα controls a large
portion of the lipid metabolism pathways. The administration of ET and other CPT-1 inhibitors to rodents has been associated with gene expression changes similar to those described above (Anderson 1998; Asins et al. 1994; Djouadi et al. 1998; Hegardt et al. 1995; Ouali et al. 2000; Portilla et al. 2000).
the hepatic hypertrophy is secondary to the activation of PPARα, oxidative stress, accumulation of intrahepatocellular lipid or another etiology.
Cardiac hypertrophy has been both the bane and the possible boon for CPT-1 inhibitors. In studies where CPT-1 inhibitors were administered to normal, aortic constricted and diabetic rats, there was a statistically significant increase in heart weight (Bressler et al. 1989; Kato et al. 1999; Rupp et al. 1992; Rupp and Jacob 1992; Turcani and Rupp 1997). TDGA, POCA, oxfenicine and ET are reported to cause cardiac hypertrophy in rodents secondary to the inhibition of CPT-1. This link was elucidated in a study by Rupp and associates (1995). Medium-chain fatty acids (MCFA) do not require CPT-1 to enter the mitochondrion, therefore, FAO can continue at a high level despite CPT-1 inhibition. In the study by Rupp, feeding a (MCFA) diet abrogated cardiac hypertrophy caused by ET-induced CPT-1 inhibition. Early in the development of CPT-1 inhibitors, their intended use was in the treatment of hyperglycemia in diabetic patients. However, after
reported in humans with chronic heart failure (Schmidt-Schweda and Holubarsch 2000). Etomoxir is currently in Phase 2 clinical trials for use as a therapeutic entity for congestive heart failure (MediGeneTM website:
http://www.medigene.com/englisch/projekte.php).
Although the association between ET and hypertrophy of both the heart and liver are well documented in the literature, the specific changes underlying the
respective hypertrophies have not been elucidated. Several theories have been forwarded but none have clearly and indisputably explained the pathogenesis of ET-induced changes. Because ET is known to be a weak to moderate
peroxisome proliferator (Cabrero et al. 1999; Forman et al. 1997; Mascaro et al.
1998; Portilla et al. 2000), the hepatic hypertrophy may be directly related to PPARα related alterations in cell proliferation control. Other possible theories to explain the pathogenesis of ET-induced hepatic hypertrophy include: 1) the shift from fatty-acid oxidation to glycolysis, mimicking the fetal phenotype, 2)
accumulation of some substrate of CPT-1, engaging a cell proliferation script, or 3) inhibition of the mevalonate pathway, possibly exerting cell proliferation control (Johnson and Ledwith 2001).
has been shown to reduce hyperglycemia in diabetic humans and animals (Wolf 1990), and hyperglycemia has been shown to increase oxidative stress (Rosen
et al. 2001); therefore, etomoxir might theoretically decrease oxidative stress. A CPT-1 inhibitor, tolbutamide, was found to up regulate oxidative stress gene transcripts GSR and SOD2 in HepG2 cells (Morgan et al. 2002). Cabrero and associates determined that ET caused oxidative stress in C2C12 skeletal muscle cells (Cabrero et al. 2002). A PPARα-agonist, Wy-14,643, has been shown to
stimulate the production of superoxide in Kupffer cells via a protein kinase C pathway. The overproduction of superoxide is linked with the activation of NFκB and TNFα which play a role in cell proliferation (Rose et al. 1999). If ET truly causes oxidative stress, what role might this oxidative stress play in the pathogenesis of the hepatic and/or cardiac hypertrophy?
The purpose of the present research was to better understand the toxic mechanisms associated with the administration of ET by examining the
transcriptional and biochemical alterations and to elucidate specific modulation of homeostatic gene expression. To this end, two hypotheses were put forth 1) Oxidative stress is generated in hepatocytes dosed with ET and this oxidative stress plays a role in the toxicity of ET; and 2) ET-induced hepatic hypertrophy is associated with a unique, PPARα-related and/or oxidative stress-related
ET-induced hepatic hypertrophy in the rat with liver gene expression profiles spanning a 12 week period. Part I manuscript has been published in
References
Abdel-aleem, S., and el-Merzabani, M. M. (1997). Acute and Chronic effects of adriamycin on fatty acid oxidation in isolated cardiac myocytes. J. Mol. Cell. Cardiol. 29, 789-97.
Agius, L., and Alberti, K. G. (1985). Regulation of flux through pyruvate
dehydrogenase and pyruvate carboxylase in rat hepatocytes. Effects of fatty acids and glucagon. Eur. J. Biochem. 152, 699-707.
Anderson, R. C. (1998). Carnitine Palmitoyltransferase: A Viable Target for the Treatment of NIDDM? Curr. Pharm. Design 4, 1-16.
Asins, G., Serra, D., and Hegardt, F. G. (1994). The effect of etomoxir on the mRNA levels of enzymes involved in ketogenesis and cholesterogenesis in rat liver. Biochem. Pharmacol. 47, 1373-9.
Bone, A. J., Sherratt, H. S., Turnbull, D. M., and Osmundsen, H. (1982).
Increased activity of peroxisomal beta-oxidation in rat liver caused by ethyl 2(5(4-chlorophenyl)pentyl)-oxiran-2-carboxylate: an inhibitor of
mitochondrial beta-oxidation. Biochem. Biophys. Res.Commun. 104, 708-12.
the peroxisome proliferator-activated receptor alpha. J. Biol. Chem. 273, 23786-92.
Bressler, R., Gay, R., Copeland, J. G., Bahl, J. J., Bedotto, J., and Goldman, S. (1989). Chronic inhibition of fatty acid oxidation: new model of diastolic dysfunction. Life Sciences 44, 1897-906.
Cabrero, A., Alegret, M., Sanchez, R., Adzet, T., Laguna, J., and Vazquez, M. (1999). Etomoxir, sodium
2-[6-(4-chlorphenoxy)hexyl]oxirane-2-carboxylate, up-regulates uncoupling protein-3 mRNA levels in primary culture of rat adipocytes. Biochem. Biophys. Res.Commun. 263, 87-93.
Cabrero, A., Alegret, M., Sanchez, R. M., Adzet, T., Laguna, J. C., and Carrera, M. V. (2002). Increased reactive oxygen species production
down-regulates peroxisome proliferator-activated alpha pathway in C2C12 skeletal muscle cells. J. Biol. Chem. 277, 10100-7.
Declercq, P. E., Falck, J. R., Kuwajima, M., Tyminski, H., Foster, D. W., and McGarry, J. D. (1987). Characterization of the mitochondrial carnitine palmitoyltransferase enzyme system. I. Use of inhibitors. J. Biol. Chem.
262, 9812-21.
Djouadi, F., Weinheimer, C. J., Saffitz, J. E., Pitchford, C., Bastin, J., Gonzalez, F. J., and Kelly, D. P. (1998). A gender-related defect in lipid metabolism and glucose homeostasis in peroxisome proliferator- activated receptor alpha- deficient mice. Journal of Clinical Investigation 102, 1083-91.
Eistetter, K., and Wolf, H. (1986). Etomoxir. Drug Fut. 11, 1034-1036.
Forman, B. M., Chen, J., and Evans, R. M. (1997). Hypolipidemic drugs,
polyunsaturated fatty acids, and eicosanoids are ligands for peroxisome proliferator-activated receptors alpha and delta. Proc. Natl. Acad. Sci. U.S.A. 94, 4312-7.
Gonzalez, F. J., Peters, J. M., and Cattley, R. C. (1998). Mechanism of action of the nongenotoxic peroxisome proliferators: role of the peroxisome
proliferator-activator receptor alpha. Journal of the National Cancer Institute 90, 1702-9.
Hegardt, F. G., Serra, D., and Asins, G. (1995). Influence of etomoxir on the expression of several genes in liver, testis and heart. Gen. Pharmacol. 26, 897-904.
Intrasuksri, U., Rangwala, S. M., O'Brien, M., Noonan, D. J., and Feller, D. R. (1998). Mechanisms of peroxisome proliferation by perfluorooctanoic acid and endogenous fatty acids. Gen. Pharmacol. 31, 187-97.
biosynthesis. Journal of Steroid Biochemistry & Molecular Biology 77, 59-71.
Kaikaus, R. M., Sui, Z., Lysenko, N., Wu, N. Y., Ortiz de Montellano, P. R., Ockner, R. K., and Bass, N. M. (1993). Regulation of pathways of
extramitochondrial fatty acid oxidation and liver fatty acid-binding protein by long-chain monocarboxylic fatty acids in hepatocytes. Effect of
inhibition of carnitine palmitoyltransferase I. J. Biol. Chem. 268, 26866-71.
Kashfi, K., and Cook, G. A. (1999). Topology of hepatic mitochondrial carnitine palmitoyltransferase 1. Adv. Exp. Med. Biol. 466, 27-42.
Kato, K., Chapman, D. C., Rupp, H., Lucas, A., and Dhalla, N. S. (1999). Alterations of heart function and Na+-K+-ATPase activity by etomoxir in diabetic rats. J. Appl. Physiol. 86, 812-8.
Koundakjian, P. P., Turnbull, D. M., Bone, A. J., Rogers, M. P., Younan, S. I., and Sherratt, H. S. (1984). Metabolic changes in fed rats caused by chronic administration of ethyl 2[5(4-chlorophenyl)pentyl]oxirane-2-carboxylate, a new hypoglycaemic compound. Biochem. Pharmacol. 33, 465-73.
Latruffe, N., and Vamecq, J. (1997). Peroxisome proliferators and peroxisome proliferator activated receptors (PPARs) as regulators of lipid metabolism.
Mascaro, C., Acosta, E., Ortiz, J. A., Marrero, P. F., Hegardt, F. G., and Haro, D. (1998). Control of human muscle-type carnitine palmitoyltransferase I gene transcription by peroxisome proliferator-activated receptor. J. Biol. Chem. 273, 8560-3.
Moran, L. A., and Scrimgeour, K. G., eds. (1994). Biochemistry. Prentiss-Hall, Inc., Upper Saddle River, NJ.
Morgan, K., Ni, H., Brown, R., Yoon, L., Qualls, C., Crosby, L., Reynolds, R., Gaskill, B., Anderson, S., Kepler, T., Brainard, T., Liv, N., Easton, M., Merrill, C., Creech, D., Sprenger, D., Conner, G., Johnson, P., Fox, T., Tyler, R., Sartor, M., Richard, E., Kuruvilla, S., Casey, W., and Benavides, G. (2002). Mechanism of action combined with cDNA microarray
technology to select genes for a real time RT-PCR-based screen for oxidative stress in HepG2 cells. Toxicol. Pathol. 30, 435-51.
Morillas, M., Clotet, J., Rubi, B., Serra, D., Arino, J., Hegardt, F. G., and Asins, G. (2000). Inhibition by etomoxir of rat liver carnitine octanoyltransferase is produced through the co-ordinate interaction with two histidine residues.
Biochem. J. 351, 495-502.
Murray, R. K., Granner, D. K., Mayes, P. A., and Rodwell, V. W. (2000). Harper's Biochemistry. Appleton & Lange, Stamford, CT.
mitochondrial outer membrane as a protein distinct from the malonyl-CoA-insensitive carnitine palmitoyltransferase of the inner membrane.
Biochem. J. 268, 599-604.
Ouali, F., Djouadi, F., Merlet-Benichou, C., Riveau, B., and Bastin, J. (2000). Regulation of fatty acid transport protein and mitochondrial and
peroxisomal beta-oxidation gene expression by fatty acids in developing rats. Pediatric Research 48, 691-6.
Park, E. A., Mynatt, R. L., Cook, G. A., and Kashfi, K. (1995). Insulin regulates enzyme activity, malonyl-CoA sensitivity and mRNA abundance of hepatic carnitine palmitoyltransferase-I. Biochem. J. 310, 853-8.
Portilla, D., Dai, G., Peters, J. M., Gonzalez, F. J., Crew, M. D., and Proia, A. D. (2000). Etomoxir-induced PPARalpha-modulated enzymes protect during acute renal failure. American Journal of Physiology - Renal Fluid and Electrolyte Physiology 278, F667-F75.
Reaven, G. M., Chang, H., and Hoffman, B. B. (1988). Additive hypoglycemic effects of drugs that modify free-fatty acid metabolism by different
mechanisms in rats with streptozocin-induced diabetes. Diabetes 37, 28-32.
Rose, M. L., Rivera, C. A., Bradford, B. U., Graves, L. M., Cattley, R. C.,
Schoonhoven, R., Swenberg, J. A., and Thurman, R. G. (1999). Kupffer cell oxidant production is central to the mechanism of peroxisome proliferators. Carcinogenesis. 20, 27-33.
Rosen, P., Nawroth, P. P., King, G., Moller, W., Tritschler, H. J., and Packer, L. (2001). The role of oxidative stress in the onset and progression of diabetes and its complications: a summary of a Congress Series
sponsored by UNESCO-MCBN, the American Diabetes Association and the German Diabetes Association. Diabetes Metab. Res. Rev. 17, 189-212.
Rupp, H., Elimban, V., and Dhalla, N. S. (1992). Modification of subcellular organelles in pressure-overloaded heart by etomoxir, a carnitine palmitoyltransferase I inhibitor. FASEB J. 6, 2349-53.
Rupp, H., and Jacob, R. (1992). Metabolically-modulated growth and phenotype of the rat heart. Eur. Heart J. 13, 56-61.
Rupp, H., Schulze, W., and Vetter, R. (1995). Dietary medium-chain triglycerides can prevent changes in myosin and SR due to CPT-1 inhibition by
etomoxir. American Journal of Physiology 269, R630-40.
Schmitz, F. J., Rosen, P., and Reinauer, H. (1995). Improvement of myocardial function and metabolism in diabetic rats by the carnitine
palmitoyltransferase inhibitor Etomoxir. Horm. Metab. Res. 27, 515-22.
Schudt, C., and Simon, A. (1984). Effects of sodium 2-[5-(4-chlorophenyl)pentyl]-oxirane-2-carboxylate (POCA) on carbohydrate and fatty acid metabolism in liver and muscle. Biochem. Pharmacol. 33, 3357-62.
Skorin, C., Necochea, C., Johow, V., Soto, U., Grau, A. M., Bremer, J., and Leighton, F. (1992). Peroxisomal fatty acid oxidation and inhibitors of the mitochondrial carnitine palmitoyltransferase-1 in isolated rat hepatocytes.
Biochem. J. 281, 561-7.
Spurway, T. D., Pogson, C. I., Sherratt, H. S., and Agius, L. (1997). Etomoxir, sodium 2-[6-(4-chlorphenoxy)hexyl]oxirane-2-carboxylate, inhibits triacylglyerol depletion in hepatocytes and lipolysis in adipocytes. FEBS Lett. 404, 111-4.
Turcani, M., and Rupp, H. (1997). Etomoxir improves left ventricular performance of pressure-overloaded rat heart. Circulation 96, 3681-6.
Watson, R. T., and Pessin, J. E. (2001). Subcellular compartmentalization and trafficking of the insulin-responsive glucose transporter, GLUT4.
Experimental Cell Research 271, 75-83.
Wolf, H. P. (1990). Aryl-substituted 2-oxirane Carboxylic Acids: A New Group of Antidiabetic Drugs. In New Antidiabetic Drugs (C. Baily and P. Flatt, eds.), pp. 217-229. Smith-Gordon, London.
Wolf, H. P. (1992). Possible new therapeutic approach to diabetes mellitus by inhibition of carnitine palmitoyltransferase 1 (CPT1). Horm. Metab. Res.
Suppl.26, 62-7.
Yotsumoto, T., Naitoh, T., Kitahara, M., and Tsuruzoe, N. (2000). Effects of carnitine palmitoyltransferase I inhibitors on hepatic hypertrophy. Eur. J. Pharmacol. 398, 297-302.
Yu, G. S., Lu, Y. C., and Gulick, T. (1998). Co-regulation of tissue-specific alternative human carnitine palmitoyltransferase Ibeta gene promoters by fatty acid enzyme substrate. J. Biol. Chem. 273, 32901-9.
Manuscript I
Etomoxir-induced Oxidative Stress in HepG2 Cells Detected by
Differential Gene Expression is Confirmed Biochemically
Christine L. Merrill 1,2, Hong Ni 2, Lawrence W. Yoon 2, Mark A. Tirmenstein3, Padma Narayanan3,
Gina R. Benavides 2, Marilyn J. Easton 2, Donald R. Creech 2, Catherine X. Hu3, David C.
McFarland3, Laura M. Hahn3, Heath C.Thomas3 and Kevin T. Morgan 4
1. Safety Assessment, GlaxoSmithKline, RTP, NC 27709
2. Toxicogenomic Mechanisms US, GlaxoSmithKline, RTP, NC, 27709
3. Cellular Pathology, GlaxoSmithKline, King of Prussia, PA, 19406
4. Department of Safety Evaluation, Aventis, Bridgewater, NJ 08807
Abbreviated Title:
ETOMOXIR-INDUCED OXIDATIVE STRESS IN HEPG2 CELLS
Corresponding author:
Christine L. Merrill
Five Moore Drive
RTP, NC 27709
clm70753@gsk.com
Tel. 919-483-9336
32
Abstract
Although known to be effective antidiabetic agents, little is published about the
toxic effects of carnitine palmitoyltransferase-1 (CPT-1) inhibitors, such as
etomoxir (ET). These compounds inhibit mitochondrial fatty acid β-oxidation by irreversibly binding to CPT-1 and preventing entry of long chain fatty acids into
the mitochondrial matrix. Treatment of HepG2 cells with 1 mM etomoxir for 6 h
caused significant modulations in the expression of several redox-related and cell
cycle mRNAs as measured by microarray analysis. Upregulated mRNAs
included heme oxygenase 1 (HO1), 8-oxoguanine DNA glycosylase 1 (OGG1),
glutathione reductase (GSR), cyclin-dependent kinase inhibitor 1A (CDKN1
[p21waf1]) and Mn+ superoxide dismutase precursor (SOD2); while cytochrome
P450 1A1 (CYP1A1) and heat shock 70kD protein 1 (HSPA1A) were
downregulated. Real time quantitative PCR (RT-PCR) confirmed the significant
changes in 4 of 4 mRNAs assayed (CYP1A1, HO1, GSR, CDKN1), and identified
3 additional mRNA increases; 2 redox-related genes, γ-glutamate-cysteine ligase modifier subunit (GCLM) and thioredoxin reductase (TXNRD1) and 1 DNA
replication gene, topoisomerase IIα (TOP2A). Temporal changes in selected
mRNA levels were examined by RT-PCR over eleven time points from 15 mins to
24 h post-dosing. CYP1A1 exhibited a 38 fold decrease by 4 h which rebounded
to a 39 fold increase by 20 h. GCLM and TXNRD1 exhibited 13 and 9 fold
increases, respectively at 24 h. Etomoxir-induced oxidative stress and impaired
mitochondrial energy metabolism were confirmed by a significant decrease in
mitochondrial membrane potential (MMP), and ATP levels, and by concurrent
increase in oxidized glutathione (GSSG) and superoxide generation. This is the
first report of oxidative stress caused by etomoxir.
Key words: Etomoxir; toxicity; oxirane-carboxylates; oxidative stress; gene
expression
Introduction
Etomoxir is a member of a family of substituted 2-oxirane-carboxylic acids that
inhibit mitochondrial long-chain fatty acid β-oxidation (FAO), ketogenesis and gluconeogenesis (Wolf, 1992). Once converted to its CoA ester, etomoxir
irreversibly binds to the CPT-1 catalytic site and prevents long chain fatty acids
from entering the mitochondrion. Along with this inhibition of FAO, etomoxir
causes a shift in energy substrate utilization from fatty acids to glucose, leading
to systemic hypoglycemia, hypoketonemia, and hypotriglyceridemia (Wolf, 1992).
These effects make etomoxir potentially useful in the treatment of
non-insulin-dependent diabetes mellitus (NIDDM). However, the compound has been shown
to induce cardiac and hepatic hypertrophy in animals and therefore has not been
fully developed as an antidiabetic agent to date (Rupp and Jacob, 1992; Vetter et
al., 1995; Yotsumoto et al., 2000). The mechanism(s) of the respective
hypertrophies have not yet been worked out, but are shown to be different from
those involved in hyperthyroidism and hypertension (Rupp et al., 1992; Vetter et
34
Reactive oxygen species (ROS) are implicated in the development of numerous
pathological conditions including inflammatory disease, cancer,
ischemia-reperfusion injury, and metabolic diseases such as diabetes mellitus. Emerging
evidence links the presence of free radicals to the progression of diabetes and its
complications. There is much evidence that hyperglycemia and advanced
glycation end products (AGE) promote the formation of ROS in the diabetic
patient and several markers of oxidative stress, such as
8-hydroxydeoxyguanosine, hydroperoxide and oxidized lipoprotein (oxLDL), are
increased in these patients (Rosen et al., 2001).
In one study, hyperglycemia was shown to induce mitochondrial superoxide
overproduction which in turn activated the hexosamine pathway, thought to be a
major factor in the pathogenesis of diabetic complications (Du et al., 2000). Lipid
peroxidation and antioxidant depletion, which strongly contribute to the
development of atherosclerosis, are both present in diabetes mellitus
(Cominacini et al., 1994; Dimitriadis et al., 1995; Leonhardt et al., 1996; Schoen
and Cotran, 1999; Srinivasan et al., 1997). In addition to vascular dysfunction,
oxidative stress is involved in the pathogenesis of diabetic polyneuropathy,
retinopathy and the expansion of extracellular matrix components, type IV and VI
collagen, fibronectin, and laminin (Rosen et al., 2001). Diabetes appears to be
associated with increased levels of oxidative stress. It would be best, therefore, if
Etomoxir has been shown to reduce hyperglycemia in diabetic humans and
animals (Wolf, 1990), and hyperglycemia has been shown to increase oxidative
stress (Rosen et al., 2001); therefore, etomoxir might theoretically decrease
oxidative stress. Morgan, et al., however, determined that another CPT-1
inhibitor, tolbutamide, caused upregulation of the oxidative stress gene
transcripts GSR and SOD2 in HepG2 cells (Morgan et al., 2002).
The purpose of this study was to evaluate mRNA expression to determine
ET-induced mechanisms of toxicity in HepG2 cells, with special emphasis on
oxidative stress. Gene expression strongly suggestive of oxidative stress was
observed and supported by decreased levels of reduced glutathione,
reduced/oxidized glutathione ratio (GSH/GSSG), concurrent increase in oxidized
glutathione (GSSG) and superoxide generation. Impairment of mitochondrial
energy metabolism was implicated by a significant decrease in mitochondrial
membrane potential and ATP levels. Other gene expression findings suggested
activation of p53, DNA repair and cell cycle arrest. This is the first report of
oxidative stress caused by etomoxir.
Materials and Methods
Chemicals
Etomoxir was obtained from Research Pharmaceuticals, Allensbach, Germany
and other chemicals were obtained from Clontech Laboratories, Research
36
Cell Culture
Human hepatocellular carcinoma (HepG2) cells (ATCC 1998, CRL-10741, Homo
sapiens, HepG2/C3A,Rockville, MD) were maintained in Dulbecco’s Modified
Eagle Medium (DMEM) with Glutamax and 10% fetal bovine serum (FBS), under
standard cell culture conditions (37°C, humidified, 5% CO2) without antibiotics.
For this experiment, time zero (T0) represents thetime at which treatment was
first begun. At time -48 h, HepG2 cells were seeded at a density of 1x10⁷ in 3
control and 3 treated collagen coated (Vitrogen-100, Cohesion, Palo Alto, CA)
150 mm diameter cell culture dishes (Nontreated, Non-Pyrogenic, Polystyrene,
Corning, Inc., NY) with 26 ml medium. A sterile, numbered, collagen-coated
glass coverslip was placed in the bottom of each dish for use in the light
microscopic determination of cell morphology. Cells were fed at -24 h and re-fed
at 0 h with either untreated media (control) or 1 mM etomoxir in media (treated).
Treatment duration in the first experiment was 6 hours. In the second
experiment, multiple time points were used (0.25 h, 0.5 h, 1 h, 2 h, 4 h, 6 h, 8 h,
12 h, 16 h, 20 h, 24 h) in order to track mRNA expression changes
chronologically (timecourse study).
Selection of Exposure Concentration
As previously described (Morgan et al., 2002), ET exposure concentration was
selected to be that which caused 50% reduction in MTS assay (Cell Titer 96®
24h. MTS is bioreduced by dehydrogenase enzymes in cells into a formazan that
is soluble in cell culture medium. The quantity of formazan product as measured
by 490 nm absorbance is directly proportional to the number of living cells in
culture (Cory et al., 1991; Marshall et al., 1995). HepG2 cells were cultured in 96
well plates with 20,000 cells and 50 µL of DMEM+10% FBS per well. ET was added in fresh medium at serial 10 fold dilutions (6 replicates per dilution).
Following exposure for 24 h, 10 µL of MTS reagent were added to each well, the plate was incubated for 1 h at 37°C and the spectrophotometric absorbance read at 490 nm. A 1mM exposure concentration was selected and confirmed in six
150mm plates seeded with 1x10⁷ cells (per RNA collection protocol) and MTS
assay was run on media collected from plates. Light microscopy was used to
confirm the toxic responses in the cells as measured by the MTS assay.
Cell Morphology and Viability
Coverslips were removed from plates at 6 h time point or at timecourse
timepoints (listed above) and fixed in ethanol. Coverslips were hematoxylin and
eosin (H&E) stained and evaluated by light microscopy. Using standard cell
counting procedures, cell counts were performed at 5 reproducible sites on each
6 h and 24 h timecourse coverslip (control and 1mM ET) (n=3). Utilizing an
Olympus 25 grid reticle (total area 25 mm2), cell nuclei within each of the 5 sites
were counted for total cell counts. Mitotic figures and apoptotic/necrotic cells
within the same sites comprised the mitotic index or apoptotic/necrotic index
38
by cell shrinkage, chromatin condensation, formation of cytoplasmic blebs and
phagocytosis by adjacent healthy cells. Necrotic cells exhibited loss of nuclear
integrity, increased eosinophilia, +/- cell swelling. It was frequently difficult to
distinguish these two forms of cell death, therefore apoptotic and necrotic cells
were lumped together during cell counts. Release of lactate dehydrogenase
(LDH) enzyme activity was used as a measure of cell viability. LDH activity was
determined by monitoring the enzymatic formation of NADH from NAD+ in the
presence of L-lactic acid. At the indicated time points, media samples were
withdrawn and centrifuged to remove viable cells. Post-centrifugation
supernatants were diluted five times with phosphate buffered saline (PBS), pH
7.4. An aliquot of 100 µl diluted sample was mixed with 100 µl reagent to give a
final concentration of 3.75 mM NAD+ and 25 mM L-lactic acid in 125 mM
Tris-HCl buffer, pH 8.9 in a 96 well plate. The increase in absorbance at 340 nm was
immediately monitored at room temperature using a SPECTRAmax 250
microplate spectrophotometer (Molecular Devices, Sunnydale, CA). The percent
LDH leakage was calculated by comparing values with total LDH activity. Total
LDH activity was measured from untreated HepG2 cells lysed with a final
concentration of 0.2% Triton X-100 in phosphate buffered saline (PBS).
Gene expression arrays:
Cultured cells, after removal of overlying media, were lysed with Trizol Reagent
and lysate was frozen at -80
°
C until use. Total RNA was isolated by aassessed using agarose gel electrophoresis and spectrophotometric 260/280 nm
absorbance. 33P-labelled cDNA probes were prepared using a modification of the
Clontech™ (Palo Alto, CA) protocol and hybridized to Clontech Atlas™ Human
Stress Toxicology cDNA Arrays (234 genes). Denaturation (4 µl) was carried out
at 70
°
C for 10 min using 6 µg total mRNA and 1 µl CDS Atlas™ specific primers(0.2 µM each). The annealing and extension reactions (22 µl, 35 min at 49
°
C)contained 0.5 mM each dATP, dGTP, dTTP, 50 mM Tris-HCl pH 8.3, 75 mM KCl,
3 mM MgCl2, 4.5 mM, 100µCi 33P-α-dCTP (3000 Ci/mmol, 10 µCi/µl, NEN) and
200 units Super Script II™ reverse transcriptase (Gibco-BRL, MD). Extension
was terminated by heating to 94
°
C for 5 min. Unincorporated 33P-α-dCTP wasremoved using G-50 MicroSpin columns (Pharmacia Biotech, NJ). Hybridization
was carried out at 64
°
C for 16 h, in 6.5 ml MicroHybe™, 3.25 µl poly-dA (1 µg/µl,Research Genetics, AL) and 6.5 µl Human Cot-1 DNA (1 µg/µl, Clontech, CA)
and heat denatured 33P-cDNA . Arrays were washed at 64
°
C followingmanufacturer’s instructions. Phosphor imaging screens were exposed to the
arrays for 24-48 h and the optical density was acquired using OptiQuant and a
Cyclone scanner (Packard BioScience Co, CT). Image files generated from
phosphorimager scans were analyzed using Clontech AtlasImage Softwareä.
After background subtraction, non-normalized data were analyzed statistically
using Normalization and Local Regression (NLR) software (Tom Kepler, Sante
40
ftp://ftp.santafe.edu/pub/kepler/. NLR was used to compare control with treated
groups (n=3/group), generate p-values, mean log intensity (MLI) to provide an
indication of signal strength, and ratio of differences between groups.
Quantitative Real Time PCR:
Total RNA prepared above from 3 control and 3 ET-treated samples was
DNAase-treated (Ambion DNAase I) according to the manufacturer’s protocol.
RNA was quantified using the Molecular Probes Ribogreenä assay and a
Cytofluor 2350 fluorometer. Samples were diluted to 10 ng/µL prior to Taqmanä
analysis (Perkin Elmer ABI Prism 7700 Sequence Detection system). A 7-gene
plate, described by Morgan, et al. was used to quantitate the mRNA expression
of the following genes: HO1, CYP1A1, TOP2A, CDKN1, GSR, GCLM, and
TXNRD1 (Morgan et al., 2002). The plate was arranged with one row allotted for
each gene to be assayed and one row of water blanks, and duplicate columns
assigned to each treated or control sample. Primers were designed with Perkin
Elmer Primer Expressä software. Forward and reverse primers and probes were diluted to the appropriate concentrations to make the probe/primer master mix.
The master mix was prepared according to the manufacturer’s protocol (without
probes and primers) and 30 µL of master mix, 5 µL of RNA and 15 µL of
probe/primer mix were aliquotted per well into the seven-gene plate. The plate
was sealed with Optical Adhesive Covers (PE Biosystems), centrifuged at 3000xg for 10 secs and the reaction was incubated at 48°C for 30 min (reverse
RT denaturation), and then subjected to 40 PCR cycles of 94°C for 15 sec and
60°C for 1 min. Values of fold change in expression were graphed for
comparison purposes. Statistical significance was determined for control versus
treated groups using a t-test (two-tailed, pooled, assuming normal distribution
and variances equal) and significance selected at p<0.05.
Oxidative stress assays:GSH and GSSG levels were assayed by HPLC
according to the method of Martin and White (1991). Superoxide radical:
Hydroethidine (HE), a sodium borohydride-reduced form of ethidium bromide
(EB) was used to evaluate generation of superoxide (O2-•) upon exposure to
etomoxir in HepG2 cells. HE, a specific and sensitive indicator of O2-• (Rothe
and Valet, 1990) is cell permeable and can be directly oxidized to EB by
O2-• produced by the cell (Carter et al., 1994). Intracellular EB tightly binds DNA,
and is fluorescent (610 nm) on excitation with the 488 nm line of a FACSCalibur
(Becton-Dickinson, San Jose, CA). Ten µM HE was added to the cell suspension
for dye-loading. Fifteen minutes after incubation at 37°C with HE, HepG2 cells
were incubated for an additional 6 h in the presence or absence of ET (500 and
1000 µM) after which sample collection was started immediately on the
FACSCalibur bench-top flow cytometer (Becton-Dickinson, San Jose, CA).
Mitochondrial energy metabolism assays: ATP: Cellular ATP levels were
measured with an ATP Bioluminescent Somatic Cell Assay Kit obtained from
42
modifications. HepG2 cells plated on a 96-well plate were incubated with 500 µM
etomoxir in media with serum. After 24 h, the media was removed and cells
were lysed by adding 100 µl of ATP releasing reagent and 100 µl of water.
Aliquots of 100 µl were transferred to white 96 well assay plates. Luminescence
was monitored on a Gemini XS SPECTRAmax dual scanning microplate
spectrofluorometer (Molecular Devices, Sunnyvale, CA) in the luminescence
mode following the addition of 100 µl luciferin and luciferase. Mitochondrial
membrane potential (MMP): Disruptions in MMP can be measured using cationic
lipophilic fluorochromes such as Mitotracker Red (Chloromethyl-X-Rosamine,
MR). These probes diffuse passively across the plasma membrane and
accumulate in the negatively charged mitochondrial matrix. The extent of dye
uptake depends on the potential difference (∆ψ); dissipation of MMP results in a
decrease in cell-associated fluorescence that can be detected by flow cytometry.
To determine changes in MMP, 1 x 10⁶ cells were incubated with 100 nM
Mitotracker Red for 15 min at 37°C in the dark and then treated with ET (250,
500 and 1000 µM) for 1 h at 37°C. Samples were analyzed immediately by flow
cytometry on a FACSCalibur.
Results
Morphology and cell viability: Examination of HepG2 cells treated with 1 mM
ET for 6 and 24 h revealed clear morphologic changes (Figure 1.1) including loss
significant increases in apoptotic/necrotic cells and a marked decrease in mitotic
figures were present only at the 24 h timepoint (Table 1.1). Many cells exhibited
concurrent mitotic spindles and necrosis. In cell count assays at 24 h, the
number of cells was reduced 34% relative to the time-matched controls; mitotic
figures dropped from 21.6/1000 cells to 0/1000 cells and apoptotic/necrotic cells
were increased ~1200%. LDH enzyme activity was used as a measure of cell
viability at 6 and 24 h with significance determined by Dunnett’s Test (n=3). Of
the 3 concentrations evaluated (0.25, 0.5 and 1 mM), only the 24 h, 1 mM
combination caused significant cell death (21%, p < 0.05).
Clontech Human Stress arrays: Statistically significant (p<0.05) changes
(Table 1.2) in mRNA levels relative to controls were induced by treatment of
HepG2 cells with 1mM ET for 6h. Redox-related genes: HO1, GSR, OGG1 and
SOD2 were upregulated and CYP1A1 was downregulated. Cell cycle/apoptosis
genes: growth arrest- and DNA damage-inducible gene 153 (GADD153), growth
arrest- and DNA damage-inducible gene 45 (GADD45), CDKN1, mouse double
minute 2 homolog (MDM2), ubiquitin and ubiquitin protein ligase were
upregulated, while proliferating cell nuclear antigen (PCNA), extracellular
signal-regulated kinase 1 (ERK1) and mitogen-activated protein kinase P38 (aka MAP
kinase 14, MAPK14) were downregulated. Heat shock proteins: heat shock
protein 40 homolog (HSP40 homolog) and heat shock 70kD protein 5 (HSPA5,
aka 75-kD glucose-regulated protein) were upregulated. DNA synthesis and
44
complementation group 2 (ERCC2, aka xeroderma pigmentosum group D
complementing protein) and UV excision repair protein (RAD23A) were
upregulated. Peroxisome proliferator activated receptor (PPAR) genes:
PPAR-alpha mRNA was decreased.
Quantitative Real Time-PCR: RT-PCR was used to confirm selected mRNA
expression changes identified by microarray analysis. The following RT-PCR
(fold expression) changes in the 6 h, 1mM ET experiment indicate oxidative
stress and cell cycle modulation: CYP1A1 (-9.6), HO1 (+1.5), TOP2A (-1.6), GSR
(+1.3), CDKN1 (+2.6), GCLM (+3.4) and TXNRD1 (+2.7) (Figure 1.2, Table 1.2).
Direction of change and statistical significance (p<0.05) of the expression of 4
mRNA transcripts (HO1, CDKN1, and GSR upregulated, and CYP1A1
downregulated) present on the Clontech Human Stress Arrayä were confirmed by RT-PCR. The mRNA expression of TOP2A was downregulated on both
platforms (RT-PCR and microarray), but only exhibited statistical significance on
RT-PCR. The two genes not present on the arrays (GCLM and TXNRD1) were
both significantly (p<0.05) upregulated at 6 h.
The ET timecourse study followed expression of these 7 genes over 11 eleven
timepoints from 0.25 h to 24 h (Figure 1.3). Note the severe swing of CYP1A1
from a decrease of 38 fold at 4 h to an increase of 39 fold at 20 h. GCLM and
significantly increased above controls at 6 h and continued to rise through the 24
h timepoint to 13 and 9 fold increases, respectively.
Oxidative stress assays:GSH and GSH:GSSG ratio: Intracellular reduced
glutathione (GSH) levels decreased relative to time-matched controls upon
treatment with ET (Figure 1.4). At 6 h, only the 1 mM dose group was
significantly decreased; control 53.7±6.4 nmol/mg protein and 1mM ET group 40.1±11.1 nmol/mg protein (-25%). The GSH depletion was more pronounced at the 24 h timepoint with significant reduction in the 0.5 and 1 mM groups; control
55.0±13.5 nmol/mg protein, 0.5 mM ET 24.6±2.8 nmol/mg protein (-55%) and 1 mM ET 24.3±3.9 nmol/mg protein (-56%). There was a significant increase in GSH at 24 h with 0.25mM ET. The ratio of GSH:GSSG, an accepted measure of
oxidative stress (Armstrong, 1998), mirrored GSH changes with significant
declines at 6 h 1 mM (-56%), and at 24 h 0.5mM ET (-93%) and 1mM ET (-84%).
Superoxide radical: At 6 h, superoxide radical generation was increased in 0.5
mM ET-treated cells by ~350% vs untreated controls (Figure 1.5).
Mitochondrial energy metabolism assays: ATP: Treatment of HepG2 cells for
24 h with 0.5 mM ET was associated with an 84% decrease in ATP levels (Figure
1.6). This dose was chosen because it was the highest non-toxic dose (0.5 mM)
of ET as measured by lactate dehydrogenase activity. Mitochondrial membrane