SPENCER, JESSICA ADRIENNE. Molecular Marker Analysis of Primocane-Fruiting Traits in Raspberry. (Under the direction of Dr. Gina Fernandez and Dr. Bryon Sosinski).
Raspberry, or Rubus idaeus, is a perennial shrub whose roots produce biennial canes. While commercially valuable, characteristic softness of the fruit limits its shelf life while the length of its fruiting season also limits its local fresh market availability. Most cultivars of
group 7 when analyzed with MapQTL 5. When lateral and tip fruiting was analyzed,
separate loci appeared on LGs 5 and 7, respectively. This suggests that there are three genes for the primocane fruiting trait; one which controls the primocane fruiting ability and two which control whether fruit appear on the tips and/or lateral branches of the canes. In addition, markers normally found on LG 5 were instead found on LG 1 for NC493,
by
Jessica A. Spencer
A thesis submitted to the Graduate Faculty of North Carolina State University
in partial fulfillment of the requirements for the degree of
Master of Science
Horticultural Science
Raleigh, North Carolina 2012
APPROVED BY:
_______________________________ ______________________________
Dr. Gina E. Fernandez Dr. Bryon R. Sosinski
Committee Chair Committee Co-Chair
________________________________ ________________________________
DEDICATION
BIOGRAPHY
Jessica Adrienne Spencer was born and raised in High Point, North Carolina. Although a self-described fantasy/sci-fi book worm, she was always most curious about the natural sciences, greatly enjoying field trips to learn about local flora and fauna and often reading fiction about survival in the wild. Biology was a favorite subject in high school at
ACKNOWLEDGMENTS
It’s been an exciting 2 3 years time, and it would not have been possible to overcome many of the challenges I faced without the help of many experienced people. First and foremost I’d like to thank Ramon Molina Bravo, a former graduate student, colleague and sincere friend, for showing me the ropes. You always gave me sound advice, although I didn’t always heed it (and usually regretted it!). Mil gracias por tu apoyo. Espero que ahora puedas ayudarme con el español. Tengo intenciones de pasar mucho tiempo contigo en Costa Rica. Siempre tu jota.
Secondly, my effusive and never ending thanks to Nicholas George who not only convinced me to like Indian food, carpooled with me from Durham, and helped me with revisions, but also helped me make a didgeridoo and learn to play it—because it’s always a good idea to have a back-up plan.
My friends and family were also an instrumental part of the process for supporting me at every step, and hopefully one day I can show my thanks for all that support with as much generosity as they showed me.
TABLE OF CONTENTS
LIST OF TABLES ... vii
LIST OF FIGURES ... viii
CHAPTER I: Literature Review Introduction ... 1
A Brief Overview of Rubus idaeus ... 2
Traditional Breeding ... 3
Molecular Breeding Molecular markers ... 4
Genetic modification ... 8
Specific Trait of Interest Primocane-Fruiting ... 9
Literature Cited ... 13
CHAPTER II: Molecular Marker Analysis of Primocane-Fruiting Traits in Raspberry Introduction ... 18
Materials and Methods Field Research ... 20
Linkage Map Development ... 21
Results and Discussion ... 24
Conclusion ... 29
Literature Cited ... 30
APPENDIX : QTL Mapping of Hue, Chroma, Anthocyanins and Phenolics Introduction ... 47
Materials and Methods ... 48
Results ... 48
Discussion ... 49
LIST OF TABLES
Chapter II
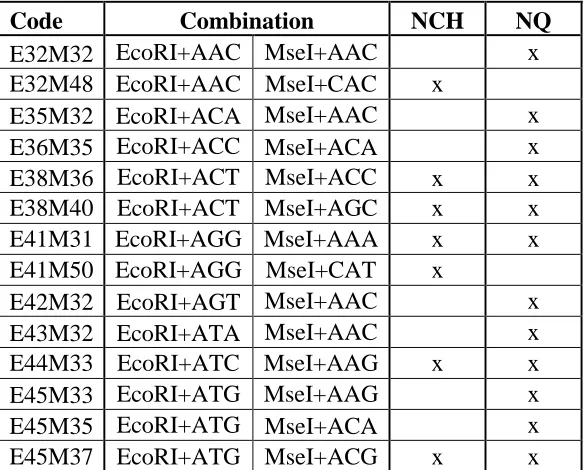
Table 1: AFLP primer codes and combinations used in NC493 x ‘Chilliwack’ (NCH) in comparison with Molina-Bravo's (2009) NC497 x Qualicum
population (NQ). ... 34 Table 2: List of polymorphic SSR markers ran in NCH as compared to
Molina-Bravo's (2009) NC497 x Qualicum population (NQ) and the associated
linkage groups (LG). "X" indicates mapping data acquired. ... 35 Table 3: SSR allele size and annealing temperature data from research population
(in italics) for comparison with allele sizes from Graham et al (2004) ... 36 Table 4: Summary of QTL detected for traits primocane fruiting (PF), tip fruiting
(Tips), lateral fruiting (Lats),Vigor, spread of canes (Spread) and growth habit (Growth) along with the associated linkage group (LG), significant
LOD scores and the percent variation explained by the QTL. ... 37 Table 5: PF numbers and % by type, expected % and Chi-square test for 1:3:1
segregation ratio ... 39 Table 6: Summary of QTL detected for traits primocane fruiting (PF), tip fruiting
(Tips), lateral fruiting (Lats),Vigor, spread of canes (Spread) and growth habit (Growth) along with the associated linkage group (LG), significant LOD scores and the percent variation explained by the QTL ... ... 39
Appendix
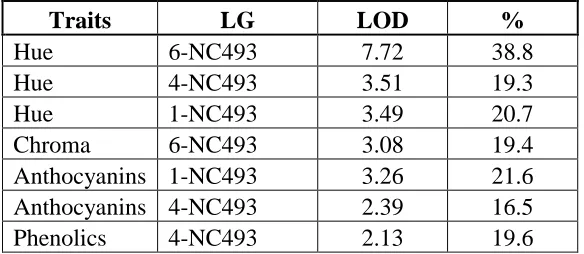
Table 7. Summary of QTL detected for Hue, Chroma, Anthocyanins and
Phenolics, along with the associated linkage group (LG), significant LOD
LIST OF FIGURES
Chapter II
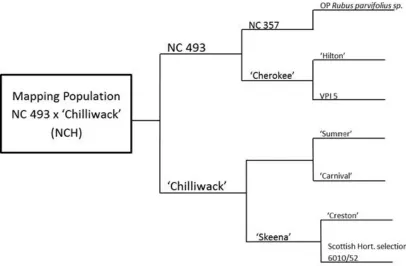
Figure 1. Dendrogram of mapping population ancestry ... 33 Figure 2. Comparison of non-primocane fruiting and primocane-fruiting divisions
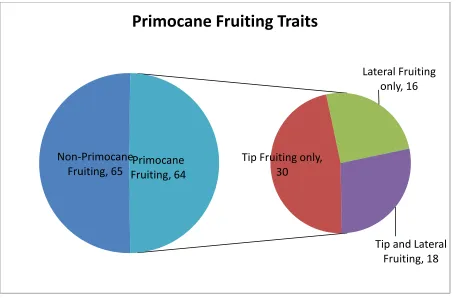
within the population NCH. ... 38 Figure 3. Spread of primocanes outward from center of plant. 1= no spread, 8= very
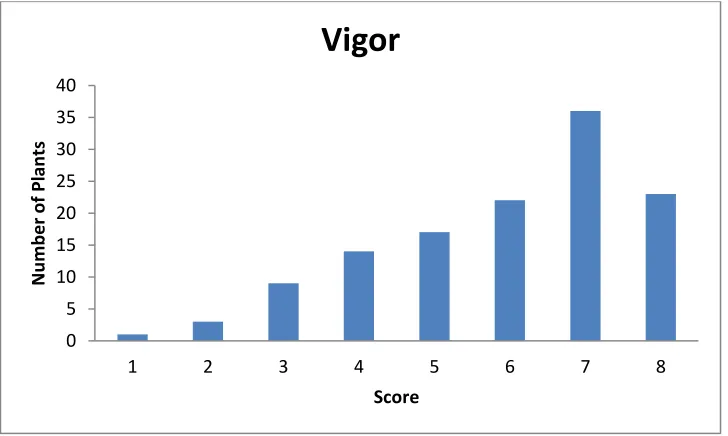
wide spread. ... 40 Figure 4. Growth habit, from decumbent to erect. 1= decumbent, 9= erect. ... 41 Figure 5. Subjective vigor of plants. 1= weak/struggling, 8= very vigorous growth. ... 41 Figure 6. Linkage maps and relative QTL positions (1 lod intervals) for Vigor,
spread of canes (Spread), growth habit (Growth), primocane fruiting (PF), tip fruiting (Tips) and lateral fruiting (Lats). Figure 7. Hue and chroma scatter plot for data taken for underripe, ripe and overripe berries and their average. Background conveys a sense of the general color of individual
berries. ... 42
Appendix
Figure 7. Hue and chroma scatter plot for data taken for underripe, ripe and overripe berries and their average. Background conveys a sense of the
CHAPTER I
Literature Review
Introduction
Raspberry (Rubus idaeus L.) is one of the world’s most important berry crops and global production has steadily increased for the past fifty years (FAOSTAT, 2011). It is a popular fruit due to its flavor, bright color, and its recent positive health associations (Halvorsen et al., 2002; Ross et al., 2007; Scheuller et al., 2006). Approximately 38 raspberry breeding programs in 21 countries have released more than 160 cultivars of raspberry in the past 30 years (Dossett et al., 2009). Breeding programs aim to develop new raspberry cultivars that are high yielding and adapted to more diverse production
environments. Most raspberry breeding is done using traditional methods, which can often take 5 to 10 years. Novel breeding methods can decrease the turnaround time in producing new cultivars by using molecular markers (Lande & Thompson, 1990). Although markers have not yet been used comprehensively in raspberry breeding, it is inevitable that they will soon be used to facilitate the more rapid development of raspberry cultivars. Herein the literature to date on raspberry breeding and genetics is reviewed as it pertains to the
A Brief Overview of Rubus idaeus
Red raspberry is a popular fruit with ancient origins, first described by Pliny the Elder around 45 A.D. as “ida” fruits gathered near Mount Ida in Turkey, from which originates its classification Rubus idaeus (Jennings, 1988). Seeds buried in Roman ruins around Britain may represent the first attempts at cultivation and breeding, although physical documentation of cultivation did not occur until the 16th century. Today’s varieties are mainly European and Asian in origin, but many cultivars also have the North American subspecies strigosus in their ancestry. Rubus idaeus has a genome of approximately 275Mb comprised of 7 diploid chromosomes (2n=2x=14) (Jennings, 1988). This small genome makes raspberry especially suitable for genetic research.
Most commercial varieties of raspberry are deciduous shrubs with perennial roots and crowns that produce biennial canes. In the first year the canes are called primocanes and are vegetative. After overwintering, these canes produce flowers, consequently named
greater than vegetables (Halvorsen et al., 2002). Phenolic compunds found in berries, which also contribute to color, can inhibit cancer cell proliferation in vitro and have
anti-inflammatory and antimicrobial effects (Ross et al., 2007; Scheuller et al., 2006).
Traditional Breeding
There are almost 200 wild and cultivated species in the Idaeobatus subgenera, of which 40 or more have been incorporated into raspberry breeding (Dossett et al., 2009). The
pedigrees of 137 cultivars released since 1961 trace back to 50 original parental clones, and only 15 of these contributed more than 1% of their genetic material (Dale et al., 1993). This shows that the gene pool of raspberries is relatively limited and that the genetic base needs to be broadened if new cultivars are to be developed. Wild raspberry species represent a large source of genetic diversity for developing improved traits and have been utilized in the past to develop new raspberry cultivars. For example, R. kuntzeanus and R. parvifolius were successfully used to breed for traits such as low chilling requirement and adaptation to warmer temperatures (Ballington, JR, 2008; Jennings, 1988). Another example is the
not only a problem for interspecific breeding, but intraspecific raspberry breeding as well, and each selection cycle for raspberry may take up to 2 or more years while raspberry plants reach maturity. Modern molecular techniques, such as genetic markers, could speed up this process significantly by enabling the breeder to screen for traits while the raspberries are still seedlings.
Molecular Breeding
Molecular markers
Molecular markers are DNA fragments, proteins, or other molecules that can provide a means of identifying the approximate location of genes without genome sequencing, a method which, at present, is costly and time consuming. There are several types of DNA molecular markers and the most common of these include amplified fragment length
polymorphism (AFLP), restriction fragment length polymorphism (RFLP), simple sequence repeat (SSR), random amplification of polymorphic DNA (RAPD), and single nucleotide polymorphism (SNP) (Pang et al., 2005). Most of these markers are created through variations in the procedure of amplifying DNA of an organism through polymerase chain reaction (PCR) and sorting the products by size, usually by visualizing the markers as bands on a gel.
presence or absence between siblings and between other markers forms the basis for genetic mapping. During meiosis, crossover events between homologous chromosome pairs may occur, and the further apart markers are on a chromosome, the higher the chance that this will occur. When several markers appear together across 50% or more of the siblings, these can be inferred to be linked due to a high likelihood of being present on the same chromosome. The lower the occurrence of crossover events, then the closer together these markers lie.
These linked markers are called a linkage group, and in this way a rough genetic map of a chromosome may be formed. Similarly, when numeric, phenotypic data for a trait of interest from the segregating population is included in the analysis, the relationships between traits and markers can be revealed. This marker trait analysis, often called quantitative trait loci (QTL) analysis, does not identify the genes themselves but a general area where related genes may lie. These markers are tested against other individuals in that species and are deemed transferable if they reliably appear in association with the investigated trait. These can then be used in marker assisted breeding (MAB) or selection (MAS). Marker assisted breeding has already proven its utility in several crop breeding programs by allowing selection for traits that may vary with season or environment, and by reducing linkage drag by selecting against undesirable alleles. This time saving method can be especially valuable in perennials where years may pass before a fruit crop is produced (Dirlewanger et al., 2004). In addition, markers will help locate genomic regions where the actual genes may lie once an organism is sequenced (Bernardo, 2008).
(Marshall et al., 2001). This research confirmed previous studies on the diversity of cultivated raspberry by showing that wild raspberry is much more genetically diverse than cultivated raspberry with little evidence for gene flow between the two. Molecular markers were also used to construct the first genetic linkage map of red raspberry. Thus far there have been four linkage maps of raspberry produced from four separate research groups (Graham et al., 2009; Molina Bravo, 2009a; Pattison et al., 2007; Sargent et al., 2007). In three of these maps, SSR’s were used to provide a consensus between the linkage groups of the separate maps.
The first molecular map of raspberry was produced using 94 progeny from a ‘Glen Moy’ × ‘Latham’ (GMxL) cross (Graham et al., 2004). A combination of 432 AFLP, SSR, and EST-SSR primers were used to create a 465.8 cM map with 9 linkage groups, although later maps consolidated these to 7 linkage groups (Woodhead et al., 2008). The first QTL in raspberry were found when spininess, root sucker density and root sucker spread were
‘Latham’ is homozygous for gene s. While this means that the exact location of gene s could not be determined, variation in the number of spines among progeny was mapped to two locations near several markers on linkage group (LG) 2 (Graham et al., 2004). Later research in the same population also mapped the spininess trait to LG 2 and also to LG 3 near gene H, which controls cane hairiness (Graham et al., 2006). The sucker production gene is simple in comparison, possibly controlled by three genes sk1, sk2, and sk3. It was theorized that suckers are produced when gene sk1 is recessive or when sk2 and sk3 are both present (Knight and Keep, 1960). Graham et al., (2004) mapped root sucker spread to two locations on LG 8, one of which overlapped with sucker density, a pattern that corresponds with the actions of genes sk1, sk2, and sk3.
Using traditional breeding methods, Jennings (1990) explored the genes that control cane hairiness and anthocyanin production in stems and fruits, named H and T respectively. Both of these are usually present at intermediate frequencies, suggesting a linkage to a recessive lethal trait. Gene H is also shown to be associated with small, abundant spines and fungal resistance (Jennings and Brydon, 1990). In molecular marker research, gene H was shown to be located on linkage group 2 and confirmed to be associated with resistance to cane botrytis and spur blight (Graham et al., 2006). Other fungal resistances for cane spot and yellow rust studied on the GMxL progeny showed no association with gene H, and mapped to LG 2 and 4, and LG 3 and 5, respectively.
(generation means) to hypothesize that PRR is controlled by 2 dominant genes. Using AFLP, RAPD and RGAP (Resistant Gene Analog Polymorphism) markers to map the population, Pattison et al. showed that most PRR resistance variance is located on two linkage groups, which corresponds with their previous population analysis. However, Pattison’s mapping methods did not use any previously mapped codominant markers so a consensus map between other existing maps is unavailable.
A third genetic map was created from 94 seedlings from a cross between 'Malling Jewel' × 'Malling Orion' (Sargent et al., 2007). This 505 cM genetic map of 7 linkage groups was made using 95 AFLP and 22 SSR markers in order to map the A1 resistance gene and dw, the dwarf phenotype described as possibly being linked to genes H and T.
Amphorophora idaei, the large raspberry aphid, is a vector for four viruses: Rubus yellow net virus, Raspberry leaf spot virus, Raspberry leaf mottle virus and Black raspberry necrosis virus. There are four described biotypes of this aphid and one resistance gene, A1, is widely used although it only imparts resistance to the first biotype, which is now nearly extinct. In response, biotype 2 aphids are more prevalent. By mapping the A1 gene, alternate sources of resistance can be found. Sargent et al. mapped A1 to LG 3 in the same area as rust resistance in the Graham et al map. Gene dw mapped to LG 6, contradicting the hypothesis that dw is linked to gene H (Sargent et al., 2007).
contained seven linkage groups which were found to be analogous to an existing map
produced by Graham (2006) through SSR markers. Using chlorophyll fluorescence to assess heat tolerance, three QTL located on LGs 1, 5 and 7 were found that explained 15.9, 10.4 and 8.8% of the variation within the mapping population. Variability of chilling requirements was explained by up to 69% through several QTL mainly located on LGs 1, 3 and 7.
The NCxQ population also segregated for spiney and completely spineless raspberry (Molina-Bravo, 2009). Gene s was mapped to LG 7, and while this does not correspond to Graham’s finding of spine density on LGs 2 and 3, it is important to note that the Graham population did not contain any spine-free progeny (Graham et al., 2006). This does, however, confirm the hypothesis that spines are a complexly inherited trait and could use clarification with further research. Molina-Bravo (2009) also located QTL for fruit size and shape on LGs 1, 3, 4 and 5. These data are in accord with findings of fruit quality QTL in the GMxL population which located on LGs 1, 4, and 5 and fruit size on LG 5 (Graham et al., 2008).
Specific Trait of Interest
The work described in this thesis uses molecular markers to discover QTL associated with primocane-fruiting in raspberries. The following section provides an overview of this trait and the genetic and molecular data in literature to date.
Most raspberries produce fruit from second year canes during the early to mid-summer, limiting the availability of local fresh fruit to one short season in locations where raspberries can be readily grown. During non-peak seasons and in areas unsuited to raspberry production, consumers must rely on raspberries shipped from other regions; long distance transportation of raspberry fruit is problematic, particularly due to the fruit’s short shelf life. Ideally raspberries would be grown close to markets and for an extended growing season. Producing raspberries in a greenhouse would solve both these problems but is costly in relation to field production. To grow raspberries close to local markets outside of
greenhouses, cultivars need to be bred for those climates. As described earlier, work is being done on traits such as heat tolerance and chill requirements, which will result in raspberry cultivars adapted to grow in warmer climates. Recent popular methods of lengthening the growing season use row covers, which can force earlier ripening, and tipping, which can delay ripening, but these only extend the fruiting season by a few weeks (Pritts, 2008).
A solution to extending the fruiting season is introducing more varieties of
the floricane in the spring after overwintering. Using these cultivars along with other methods could provide fresh fruit to local markets for the majority of the year.
This valuable trait occurs naturally in several wild species, including R. idaeus, R. occidentalis, and R. strigosus, although yield is often very low and limited to the tips of the canes in late fall (Keep, 1988). Despite the low yield, primocane fruiting types have been cultivated in gardens across Europe and America for over 200 years (Hall et al., 2009). This trait had no commercial importance until primocane-fruiting ‘Lloyd George’ (R. idaeus) and various R. strigosus selections were interbred in 1934 at the New York State Experiment Station, Geneva (Keep, 1988). There are now many popular primocane fruiting varieties, such as ‘Heritage’, ‘Ruby’, ‘Autumn Bliss’, ‘Caroline’ and ‘Chinook’. However, PF
cultivars still yield less when compared with floricane fruiting raspberries and PF often ripen over several weeks. For this reason, the majority of breeding for PF cultivars has been focused on increasing yield.
season, while genotypes expressing more fruiting laterals produced smaller fruit. Lawrence (1976) also showed a large correlation between extensive branching and early flowering in PF raspberry, which he attributed to two complimentary genes. Further evidence that the expression of the PF trait is linked to plant architecture was documented by Keep (1988), who showed that selecting for early bearing PF raspberries resulted in the selection of shorter or dwarf plants (Keep, 1988).
It appears that primocane-fruiting is a complex trait controlled by both genetic and environmental factors. Traditional breeding is slowly improving primocane-fruiting traits, but this process could be enhanced through earlier screening methods, specifically those using genetic markers (Hall et al., 2009). Further research in genetic markers for the PF trait will not only give insight into the genetics behind it, but could also lead to the development of markers for use in rapid screening methods.
Literature Cited
Ballington, JR. and G. Ferandez. 2008. Breeding raspberries adapted to warm climates with fluctuating temperatures in winter. Acta Hort (ISHS) (777):87-90.
Bernardo, R. 2008. Molecular Markers and Selection for Complex Traits in Plants: Learning from the Last 20 Years. Crop Sci. 48(5):1649-1664.
Dale, A., T. Sjulin, R. Mcnicol, P. Moore, and L. Burmistrov. 1993. Genetic diversity of red raspberry varieties throughout the world. J. Am. Soc. Hort. Sci. 118(1):119-129.
Dirlewanger, E., E. Graziano, T. Joobeur, F. Garriga-Calderé, P. Cosson, W. Howad, and P. Arús. 2004. Comparative mapping and marker-assisted selection in Rosaceae fruit crops. Proc. Natl. Acad. Sci. U. S. A. 101(26):9891.
Dossett, M., C. Finn, K. Lewers, and N. Bassil. 2009. Transferability of Rubus microsatellite markers for use in black raspberry. HortScience 44(4):1092-1092.
Food and Agriculture Organization of the United Nations (FAOSTAT). (2011). Retrieved Oct 2011. http://faostat.fao.org/
Graham, J., K. Smith, K. MacKenzie, L. Jorgenson, C. Hackett, and W. Powell. 2004. The construction of a genetic linkage map of red raspberry (Rubus idaeus subsp. idaeus) based on AFLPs, genomic-SSR and EST-SSR markers. Theor. Appl. Genet. 109(4):740-749.
Graham, J., C.A. Hackett, I. Tierney, K. MacKenzie, and K. Smith. 2006. Mapping gene H controlling cane pubescence in raspberry and its association with resistance to cane botrytis and spur blight, rust and cane spot. Theor. Appl. Genet. 112(5):818-831.
Graham, J., I. Hein, K. Smith, S. McCallum, M. Woodhead, and C.A. Hackett. 2009. Mapping QTLs for developmental traits in raspberry from bud break to ripe fruit. Theor. Appl. Genet. 118(6):1143-1155.
Graham, J., M. Woodhead, S. McCallum, K. Smith, L. Cardle, and L. Mazzitelli, and 2008. Identification, characterisation and mapping of simple sequence repeat (SSR) markers from raspberry root and bud ESTs. Mol. Breed. 22(4):555-563.
Halvorsen, B.L., M.C.W. Myhrstad, A.B. Wold, D.R. Jacobs, K. Haffner, K. Holte, L.F. Andersen, H. Baugerod, I. Barikmo, E. Hvattum, S.F. Remberg, R. Blomhoff, and J.O. Moskaug. 2002. A systematic screening of total antioxidants in dietary plants. J. Nutr. 132(3):461-471.
Jennings, D.L. 1988. Raspberries and blackberries: their breeding, diseases and growth. Academic Press, San Diego.
Jennings, D.L. and E. Brydon. 1990. Variable inheritance of spinelessness in progenies of a mutant of the red raspberry cv. Willamette. Euphytica 46(1):71-77.
Keep, E. 1961. Autumn-fruiting in raspberries. J.Hort.Sci 36:174-185.
Keep, E. 1988. Primocane (autumn)-fruiting raspberries: A review with particular reference to progress in breeding. J.Hort.Sci 63(1):1-18.
Knight, R. and E. Keep. 1960. The genetics of suckering and tip rooting in raspberry. Report of East Malling Research Station for 1959:57.
Marshall, B., R. Harrison, J. Graham, J. McNicol, G. Wright, and G. Squire. 2001. Spatial trends of phenotypic diversity between colonies of wild raspberry Rubus idaeus. New Phytol. 151(3):671-682.
Molina Bravo, R. 2009a. Genetic and quantitative analysis of red raspberry (Rubus idaeus) for heat tolerance and longer chilling requirement. D., NORTH CAROLINA STATE UNIVERSITY.
Ourecky, D.K. 1976. Fall-bearing red raspberries, their future and potential. Acta Hort. 60:135-14
Pang, E.C.K., B.C.Y. Collard, M.Z.Z. Jahufer, and J.B. Brouwer. 2005. An introduction to markers, quantitative trait loci (QTL) mapping and marker-assisted selection for crop improvement: The basic concepts. Euphytica 142(1):169-196.
Pattison, J., C. Weber, and S. Samuelian. 2007. Inheritance of Phytophthora root rot
resistance in red raspberry determined by generation means and molecular linkage analysis. Theor Appl Genet. 115:225-236.
Ross, H.A., G.J. McDougall, and D. Stewart. 2007. Antiproliferative activity is
predominantly associated with ellagitannins in raspberry extracts. Phytochemistry 68(2):218-228.
Sargent, D.J., D.W. Simpson, F. Fernández-Fernández, V.H. Knight, K.R. Tobutt, and A. Rys. 2007. Mapping of A1 conferring resistance to the aphid Amphorophora idaei and dw (dwarfing habit) in red raspberry (Rubus idaeus L.) using AFLP and microsatellite markers. BMC Plant Biology 7(1):15-15.
Scheuller, H.S., R. Lee, D. Sand, Y. Zhang, D. Heber, L.S. Adams, and N.P. Seeram. 2006. Blackberry, Black Raspberry, Blueberry, Cranberry, Red Raspberry, and Strawberry Extracts Inhibit Growth and Stimulate Apoptosis of Human Cancer Cells In Vitro. J. Agric. Food Chem. 54(25):9329-9339.
CHAPTER II:
Molecular Marker Analysis of Primocane-Fruiting Traits in Raspberry
Introduction
Raspberry is an economically important fruit crop due to its flavor, bright color, and beneficial nutritional components. Berry fruits contain on average four times more
antioxidants than non-berry fruits and ten times more than vegetables, creating a large consumer demand for berries as concerns over health increase (Halvorsen et al., 2002). New ways of meeting this demand must be found as the monetary and environmental costs of shipping increase. One way that local growers can help meet the demand for raspberries is by using primocane-fruiting plants to extend the harvest season.
Moreover, PF usually occurs from the tip of the most mature canes and moves down the cane until cold temperatures set in, creating a prolonged harvest when compared to floricane fruiting raspberries. Parts of the cane that have not budded will overwinter to produce fruit the next spring. This prolonged harvest may be an asset to hand-picked operations, but is not as desirable for larger operations. The largest reason that PF varieties are not used
extensively is the fruit lacks in quality and yield in comparison to FF varieties (Graham and Woodhead, 2009).
Although primocane-fruiting raspberries have come a long way in terms of earliness, yield, and quality when compared to their wild relatives, traditional breeding methods could be accelerated with the use of molecular markers for marker assisted selection (MAS). To date, there are several linkage maps of Rubus idaeus available, mapping traits such as spininess, color, anthocyanin content, fungal resistance, dwarfing, aphid resistance, heat tolerance, chill requirement, height, fruit set timing, and ripening stages. The goal of this study is to add to this knowledge by analyzing a population segregating for PF traits and locating loci that will give insight into how the PF mechanism functions and help identify useful markers associated with the trait for MAS.
Materials and Methods:
Field Research:
Plant Materials
Primocane Fruiting Evaluation:
In 2008, NC 493 and the 131 progeny of NC 493 ‘Chilliwack’ were assessed on a biweekly basis from July to September for the presence or absence of primocane fruiting by determining whether flowers or fruit were present on the primocanes. Two individuals died over the winter, and in 2009 the rest of the population and the PF parent NC 493 were again evaluated for primocane fruiting on a weekly to biweekly basis from 1 June to 3 August. Notations were also made as to whether the plants were fruiting on the tip of canes, the lateral branches, or both as a distinct segregation occurred. The relative fruitfulness was also scored as being more or less than 15 nodes that were bearing flowers.
Other Screening:
The architecture and growth of canes were scored as spread, habit, and vigor in August 2009. Each trait was scored on a scale of 1-9, with 1 being least spread/most compact growth of canes, least vigorous growth, and canes that grew low to the ground. A score of 9 indicated a large spread of canes, very vigorous growth, and erect growth of canes.
Linkage map development:
DNA Extraction
Genomic DNA was extracted from young freeze dried leaves using the 2% CTAB method described by Graham (2003). Approximately 20 mg of ground tissue was added to 1 ml 2x CTAB buffer then heated at 65°C for 30 minutes. To this sample, 800 ul of 24:1 chloroform-isoamyl alcohol was added, the sample was agitated for 5 minutes, then
tube with an equal volume of ice-cold propanol. After incubating for 15 minutes, DNA was pelleted by centrifugation at 3500 rpm for 10 minutes. The supernatant was decanted and the pellet allowed todry before the DNA was suspended in 50 ul TE buffer and headed to 65°C for 5 minutes. 0.5 ul RNase A (10 mg/ml) was added and samples were incubated at 37°C for one hour before being stored in the refrigerator or -80°C freezer.
AFLP Analysis:
Amplified fragment length polymorphisms were generated using 250 to 500 ng of DNA from the parents and progeny based on the protocol described by Vos et al. (1995). Modifications of DNA digestion include using New England Biolabs (Ipswich, MA) Buffer 4, 8 U of EcoR1, and 5 μg of BSA for a total 30 μl reaction. The ligation step was modified by adding 5 μl of solution containing 60 U of T4 ligase per reaction and NEB T4 buffer. The rest of the amplification process was performed as described by Vos et al. (1995) with the exception of using IRDye™ 800 (LICOR, Lincoln, Nebraska) infared dye labeled to the 5’ end of the EcoRI selective primer in the second amplification step to visualize the fragments. Selective primer combinations with three base extensions (Table 1) were chosen according to the number of polymorphic markers seen in screening plates and from previous work by Molina-Bravo (2009). AFLP products were denatured and visualized in an 8% acrylamide gel that ran in a 4300 DNA Analysis System (LI-COR, Lincoln, Nebraska) for approximately 3 hours. Markers were scored by hand with the help of Cross Checker (J.B. Buntjer, 1999) and a genotype table was produced using population type CP with parents present.
and in cases where both segregation types possessed significant χ2
, the highest score was used.
SSR Analysis:
Simple sequence repeat (SSR) markers developed by Graham et al. (2004) were used to anchor linkage groups to maps produced by Graham et al (2006), Sargent et al (2007) and Molina-Bravo (2009). Polymerase chain reactions (PCR) for SSRs were carried out using the three-primer tailing system described by Schuelke (2000), where either 6-FAM, VIC, NED, or PET florescent dyes were bound to the 5’ end of the M13 universal primer. Each 10 μl PCR reaction was comprised of 20 to 50 ng of DNA, 0.2 pmol forward primer, 1.0 pmol reverse primer, 1.0 pmol M13-universal florescent dye labeled primer, 0.2 mM of dNTPs, 1X standard buffer with MgCl2, 0.5 U Taq DNA polymerase (Roche). Due to unclear PCR results using temperatures suggested in literature, a gradient temperature trial was performed using parental DNA with temperatures ranging from 50°C to 65°C in order to find ideal annealing temperatures. PCR’s were then run in a Gene Amp PCR System 9700 thermal cycler (Applied Biosystems) for 15 cycles with the steps as follows: denaturing at 94.0°C for 30 s, annealing at ideal temperature for 30 s, extension at 72.0°C for 1 min. This was
Of the 48 SSR primer pairs tested on the parents for polymorphisms, 23 were run on the entire population and parents. Scoring was performed using Genemarker 1.95 software by SoftGenetics LLC (State College, PA).
Linkage and QTL Analysis:
Segregation analysis of 208 polymorphic markers on 129 individuals of the
population was performed using JoinMap 4 (Van Ooijen, 2006). Settings include population type CP for cross pollinated crops and default calculation option with the exceptions of Kosambi’s mapping function instead of Haldane’s and use of Maximum Likelihood (ML) mapping instead of Regression Mapping. Linkage groups were formed at a minimum logarithm of odds (LOD) of 5.0. Quantitative trait loci analysis was conducted using MapQTL 5 under default conditions (Van Ooijen, 2004). A Kruskal-Wallis test for single point analysis was used to identify the most likely areas for trait loci and was followed by interval mapping to calculate the explained variation and LOD scores. Permutation testing was performed using 500 permutations to identify significant LOD levels.
Results and Discussion
Linkage Mapping:
‘Latham’ and ‘Glen Moy’ (Table 3). Two or more polymorphisms appeared on each SSR primer product and while most could be scored as codominant, errors involving linkage phases were resolved when they were also scored as dominant markers. These SSRs made up the rest of the 208 markers used in analysis and were used to anchor the map to linkage groups previously identified by Graham et al. (2006).
Maximum likelihood (ML) mapping and regression mapping were both performed on the population but only ML maps were used in the final analysis. Regression mapping was used first to create a linkage map of the entire population. This first map did not produce linkage group (LG) 2 and produced two LGs 4 as well as three small unidentified LGs. When parental maps were produced, these linkage groups did not differ significantly in marker placement from the whole population maps except for LG 2, which resolved itself from ‘Chilliwack’. The three unknown linkage groups remained. In addition, when these linkage groups were applied to QTL mapping, results between Kruskal-Wallis (KW) and Interval Mapping (IM) analyses were inconsistent.
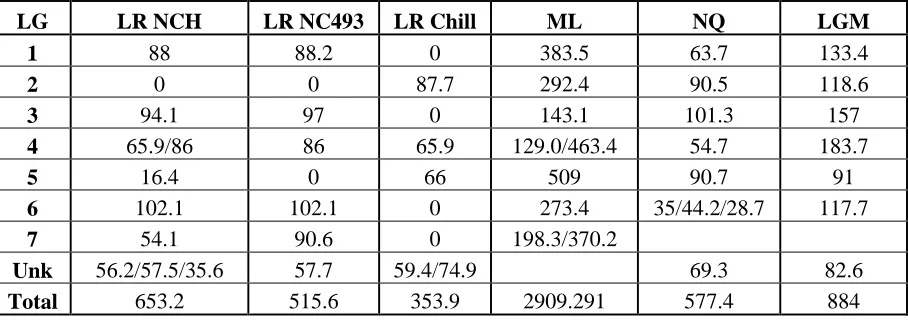
did not concur with map distances found by other researchers. A comparison can be found in table 4.
The final map consisted of 9 linkage groups divided between NC 493 and
‘Chilliwack’. NC 493 produced linkage groups 1, 3, 4, 6, and 7 and placed 82 markers while ‘Chilliwack’ produced LGs 2, 4, 5, and 7 and only placed 34 markers. This uneven
placement of markers is not unusual as Molina-Bravo (2009) and Graham (2006) also found that marker segregation favored one parent, likely due to one parent being more heterozygous and therefore contributing more polymorphisms to the progeny. The female parent of NC 493 was selected from an open pollinated population of Rubus parvifolius (Figure 1). The mapping population is therefore at least 12.5% R. parvifolius , and may partially explain the increased heterozygosity of NC 493 observed relative to ‘Chilliwack’ based on the number of segregating molecular markers.
The majority of SSR markers segregated according to previously found linkage groups with one exception; linkage group 1 from NC 493 contained markers from both LG’s 1 (Rub166b and Rub210a) and 5 (Rub35a) from the previous published maps. Grouping at a LOD of 7.0 separated out Rub166b and 7 other markers, but Rub210a and Rub35a stayed firmly linked. The ‘Chilliwack' map did not map LG 1 but did map LG 5 with both Rubus35a and Rubus105b contained therein.
Primocane Fruiting:
fruiting, and tip and lateral fruiting plants in a 1:2:1 ratio, respectively (Figure 2). Thus the PF trait seems to be influenced by three genes; one which controls whether PF appears and two others which control whether PF occurs in the tips or laterals. A χ2 analysis supports this three gene hypothesis (Table 5). Additionally, this three gene effect may explain the additive nature of PF found by prior researchers. Tip fruiting appeared in a 3:1 ratio, suggesting that the trait is heterozygous for both NC 493 and ‘Chilliwack’, which corresponds to the finding of significant loci on LG 7 of ‘Chilliwack’ as well as that of NC 493. Lateral fruiting
appeared in a 2:1 ratio, suggesting heterozygosity in NC 493 only.
A Kruskal-Wallis analysis revealed several significant markers, but the most significant K*-values for primocane fruiting fell on LG 7 of NC 493. When only lateral fruiting was analyzed, significant loci were found on the ‘Chilliwack’ LG 5, and when only tip fruiting was analyzed, significant loci were found on the upper half of LG 7 of NC 493. Interval mapping was also performed and showed a QTL on LG 5 and two QTL on LG 7 of NC 493 for the PF trait. A short significant group of markers also appeared on the
‘Chilliwack’ LG 7 using the interval mapping method. Table 6 displays the mapped traits, significant LOD scores, and the percent variation explained by these QTL.
until flowering and the fewer nodes per cane were produced. This also resulted in shorter plants which concurs with previous research showing that primocane fruiting plants selected for earlier ripening show more lateral branching and are often shorter or dwarfed (Keep, 1988; Ourecky, 1976; Lawrence, 1976). This evidence suggests that height and chilling likely play important roles in the PF mechanism. In addition, loci on LG 1 and 5 have been associated with cane height by Graham (2009) and from the appearance of Rubus35a on LG1 in NC493, there is evidence that a crossover event occurred at some point between LGs 1 and 5 in this population. It is possible that this event caused a deletion of a gene involved in the signaling of flower bud initiation, helping to give rise to primocane-fruiting traits.
Other Traits:
The spread of canes, growth habit, and vigor of growth were also mapped. Kruskal-Wallis analysis showed spread linked to loci on LG 1, although less significant K-values also showed a few loci on LG’s 3, 4, and 5. Subsequent interval mapping showed QTL at LGs 1 and 3. Spread also displays a bimodal distribution within the population, possibly suggesting two competing genes for this trait (Figure 3).
Growth habit also mapped to LG 3, close to the location where spread occurred. Molina-Bravo (2009), mapped the growth habit trait as well, but QTL for that population were found on LG’s 2 and 5. While growth habit for other populations has not been
examined, QTL for height, which could be related to growth habit, were found on LG 3 by Graham (2009).
Conclusion
Literature Cited
Fejer, S. 1977. Inheritance of yield, yield components, and fall-fruiting habit in red raspberry diallel crosses. Genome 19(1):1-13.
Graham, J., K. Smith, K. MacKenzie, L. Jorgenson, C. Hackett, and W. Powell. 2004. The construction of a genetic linkage map of red raspberry (Rubus idaeus subsp. idaeus) based on AFLPs, genomic-SSR and EST-SSR markers. TAG Theoretical and Applied Genetics
109(4):740-749.
Graham, J. and M. Woodhead. 2009. Raspberries and Blackberries: The Genomics of Rubus. p. 507-524. In: Anonymous Springer.
Graham, J., C.A. Hackett, I. Tierney, K. MacKenzie, and K. Smith. 2006. Mapping gene H controlling cane pubescence in raspberry and its association with resistance to cane botrytis and spur blight, rust and cane spot. Theor. Appl. Genet. 112(5):818-831.
Graham, J., M. Woodhead, S. McCallum, K. Smith, L. Cardle, and L. Mazzitelli, and 2008. Identification, characterisation and mapping of simple sequence repeat (SSR) markers from raspberry root and bud ESTs. Mol. Breed. 22(4):555-563.
Halvorsen, B.L., M.C.W. Myhrstad, A.B. Wold, D.R. Jacobs, K. Haffner, K. Holte, L.F. Andersen, H. Baugerod, I. Barikmo, E. Hvattum, S.F. Remberg, R. Blomhoff, and J.O. Moskaug. 2002. A systematic screening of total antioxidants in dietary plants. J. Nutr. 132(3):461-471.
Kao, C.H. 2000. On the differences between maximum likelihood and regression interval mapping in the analysis of quantitative trait loci. Genetics 156(2):855.
Keep, E. 1988. Primocane (autumn)-fruiting raspberries: A review with particular reference to progress in breeding. J.Hort.Sci 63(1):1-18.
Molina-Bravo, R. 2009. Genetic and quantitative analysis of red raspberry (Rubus idaeus) for heat tolerance and longer chilling requirement. D., North Carolina State University.
USDA National Agricultural Statistics Service (USDA-NASS). (2011). Retrieved Oct 2011. http://www.nass.usda.gov/
Schuelke, M. 2000. An economic method for the fluorescent labeling of PCR fragments. Nat. Biotechnol. 18(2):233-234.
Vos, P., R. Hogers, M. Bleeker, M. Reijans, T. Lee, M. Hornes, A. Friters, J. Pot, J. Paleman, and M. Kuiper. 1995. AFLP: a new technique for DNA fingerprinting. Nucleic Acids Res. 23(21):4407.
Van Ooijen, J.W. (2006). JoinMap® 4, Software for the calculation of genetic linkage maps in experimental populations. Kyazma B.V., Waginingen, Netherlands.
TABLES AND FIGURES
Table 1: AFLP primer codes and combinations used in NC493 x ‘Chilliwack’ (NCH) in comparison with Molina-Bravo's (2009) NC497 x Qualicum population (NQ).
Code Combination NCH NQ
E32M32 EcoRI+AAC MseI+AAC x
E32M48 EcoRI+AAC MseI+CAC x
E35M32 EcoRI+ACA MseI+AAC x
E36M35 EcoRI+ACC MseI+ACA x
E38M36 EcoRI+ACT MseI+ACC x x
E38M40 EcoRI+ACT MseI+AGC x x
E41M31 EcoRI+AGG MseI+AAA x x
E41M50 EcoRI+AGG MseI+CAT x
E42M32 EcoRI+AGT MseI+AAC x
E43M32 EcoRI+ATA MseI+AAC x
E44M33 EcoRI+ATC MseI+AAG x x
E45M33 EcoRI+ATG MseI+AAG x
E45M35 EcoRI+ATG MseI+ACA x
Table 2: List of polymorphic SSR markers ran in NCH as compared to Molina-Bravo's (2009) NC497 x Qualicum population (NQ) and the associated linkage groups (LG). "X" indicates mapping data acquired.
Code NCH NQ LG
Rub166b x x 1
Rub210a x 1
Rub107h x 2
Rub157 x 2
Rub194h x x 2
Rub103a x 3
Rub228a x x 3
Rub259f x x 3
Rub126b x 4
Rub236b x 4
Rub105b x x 5
Rub214b x 5
Rub222e x 5
Rub25a x 5
Rubr35a x x 5
Rub118b x 6
Rub123a x x 6
RubLeaf102 x 6
RubLeaf97 x 6
Rub116a x x 7
Rub263f x 7
Table 3: SSR allele size and annealing temperature data from research population (in italics) for comparison with allele sizes from Graham et al (2004).
Latham Glen Moy NC493 Chilliwack
Rubus116a (ct)12-(t)10 L: ccaacccaaaaaccttcaac 185, 190 193 201, 298 211, 289 58
R: gttgtggcatggccttttat
Rubus166b (tc)15 L: ccgcaagggttgtatcctaa 215, 221 219, 224 221,229 229 56
R: gcatgagggcgatataaagg
Rubus123a (ag)8 L: cagcagctagcattttactgga 170, null 140, 150 152, null 162 51.1
R: gcactctccacccatttcat
Rubus228a (ga)41 L: tggacagctttgtgcagagt 118, 128 150 147, 165 165 60
R: gcttgcttgtatctccattgc
Rubusr35a (ct)8 L: ttggaagcacaaaagcgata 210, 226 226 238 226, 232 60.2
R: gcgacagccaaaacaaaagt
Rubus126b (ct)31(ca)22 L: cctgcatttttctgtattttgg 150, 164 164, 201 187,203 157,183 56.2
R: tcagttttcttcccacggtta
Rubus259f (ct)4-(ag)8 L: tggcacaagaagcctgtaac 244, 252 247 264,269 264 60.2
R: tcccatatccctcagcattc
Rubus194h (ga)12 L: tgtgttgttctctgcaacca 100, 111 111, 115 188, null 188,224 60.2
R: agcccttacttttcctgcaa
Rubus118b (ct)25 L: ccgcaaaacaaaaggtcaag 104, 112 137 100,121 58
R: ggattcttgccaaagtcgaa
Rubus105b (ag)8 L: gaaaatgcaaggcgaattgt 158, 190 158, 164 190,211 182 56
R: tccatcaccaacaccaccta
Rubus26a (ct)11(ca)29 L: aacaccggcttctaaggtct 122, 150 150 132,138 138 60.2
R: gatcctggaaagcgatgaaa
Rubus210a (ct)25 L: tcctgatggttgtctggttg 101, 115 101, 115 93,131 119 52.5
R: ttcgaggcttttcagaaacaa
Repeat motif Primer sequences Allele Sizes Annealing
Table 4: Comparison of linkage group sizes from mapping using linear regression analysis (LR) of the population NCH and parents NC 493 and Chilliwack, and maximum likelihood (ML) analysis. Linkage group sizes from Molina-Bravo’s 2009 map (NQ) and Graham’s 2007 map (LGM) are also included.
LG LR NCH LR NC493 LR Chill ML NQ LGM
1 88 88.2 0 383.5 63.7 133.4
2 0 0 87.7 292.4 90.5 118.6
3 94.1 97 0 143.1 101.3 157
4 65.9/86 86 65.9 129.0/463.4 54.7 183.7
5 16.4 0 66 509 90.7 91
6 102.1 102.1 0 273.4 35/44.2/28.7 117.7
7 54.1 90.6 0 198.3/370.2
Unk 56.2/57.5/35.6 57.7 59.4/74.9 69.3 82.6
Figure 2. Comparison of non-primocane fruiting and primocane-fruiting divisions within the population NCH.
Non-Primocane Fruiting, 65
Tip Fruiting only, 30
Lateral Fruiting only, 16
Tip and Lateral Fruiting, 18 Primocane
Fruiting, 64
Table 5: PF numbers and % by type, expected % and Chi-square test for 1:3:1 segregation ratio.
PF type n %
Expected %
Total 64 48.85 50
lateral 16 12.21 12.5
tips 30 22.9 25
both 21 16.03 12.5
Chi-Square Test
for Specified Proportions
Chi-Square 1.5802
DF 3
Pr > ChiSq 0.6639
Table 6: Summary of QTL detected for traits primocane fruiting (PF), tip fruiting (Tips), lateral fruiting (Lats),Vigor, spread of canes (Spread) and growth habit (Growth) along with the associated linkage group (LG), significant LOD scores and the percent variation
explained by the QTL.
Traits LG LOD %
PF 7-NC493 24.04 94.3
Lats 5-Chilliwack 3.64 31
Tips 7-Chilliwack 4.74 28.7
Tips 7-NC493 13.07 43.7
Spread 1-NC493 2.28 11
Spread 3-NC493 3.69 22.3
Vigor 1-NC493 3.3 13.5
Figure 3. Spread of primocanes outward from center of plant. 1= no spread, 8= very wide spread.
0 5 10 15 20 25 30 35
1 2 3 4 5 6 7 8
N
u
m
b
e
r
o
f Pl
an
ts
Score
Figure 4. Growth habit, from decumbent to erect. 1= decumbent, 9= erect.
Figure 5. Subjective vigor of plants. 1= weak/struggling, 8= very vigorous growth. 0 5 10 15 20 25 30 35 40
1 2 3 4 5 6 7 8 9
N u m b e r o f Pl an ts Score
Growth Habit
0 5 10 15 20 25 30 35 401 2 3 4 5 6 7 8
QTL Mapping of Hue, Chroma, Anthocyanins and Phenolics
Introduction
Recent research has focused on anthocyanins and other phenolic compounds which not only give fruit their color but also impart many healthful benefits. Anthocyanins and other antioxidant compound in berry extracts have been found to inhibit cancer cell proliferation in vitro and have anti-inflammatory and antimicrobial effects (Ross et al., 2007; Scheuller et al., 2006). Raspberry (Rubus idaeus) is a popular fruit known to have significant levels of these beneficial compounds (Moyer et al., 2002), but research into the controlling genetics behind color and antioxidants is incomplete.
Gene T is the most significant gene controlling anthocyanin content and therefore color in raspberry, with the recessive homozygous tt displaying yellow fruits and stems and the least amount of anthocyanin (Jennings, 1963). Kassim et al. (2009) analyzed 8 anthocyanins from the ‘Glen Moy’ x ‘Latham’ (GML) population and mapped them to locations on LG 1 and 4; however, no color analysis was performed and this population produced fruit only in the red color range. Further research with the GMxL population analyzed ripening through color characteristics and hypothesized that results would be similar to those of Kassim et al, but instead markers were identified on LG 5 with significant QTL's also found on LGs 2, 3 and 6 (Graham et al., 2009). Molina-Bravo’s (2009) population from the cross (R.
on LG 5. These conflicting data indicate complex genetics behind color and anthocyanins, with color traits perhaps more related to ripening than the anthocyanin genes themselves.
Materials and Methods
The population, plant materials collected, DNA extraction, linkage map development, and QTL analysis were all previously described in Chapter II.
Fruit Color:
Fruit samples of approximately 15 berries were collected in the summer of 2009. A total of 82 samples were first evaluated using a Royal Horticultural Society color chart, and then whole berries were analyzed by an Ultrascan Pro by HunterLab which produced CIE LAB scores and wavelength intensity scores. The LAB scores were then converted into hue and chroma for ease of reference. Berries were scored as ripe, under ripe or overripe before being measured.
Total Anthocyanins and Phenolics:
Analysis of anthocyanins and phenolics from 73 freeze dried samples was performed courtesy of Christine Bradish and Dr. Penelope Perkins-Veazie at the NCRC, PHHI,
Kannapolis NC.
Results
describes the relative color and chroma is the lightness of that color. Figure 7 gives a general idea of this concept with regards to the analysis results.
QTL for hue were found on LGs 1, 4, and 6 of NC493, although the most significant scores were on LG 6. Significant LOD scores for chroma were only found on LG 6. There were no appreciable differences in QTL scores or locations when underripe, ripe, and overripe berries were accounted for.
Average phenolics of the raspberry samples were 2078.9 mg/kg FW (fresh weight) and 590.1 mg/kg FW for anthocyanins. Significant QTL were found on LGs 1 and 4 for both components. A summary of QTL and their significant LOD score along with percent
variation explained can be viewed in table 6.
Discussion
Literature Cited
Graham, J., I. Hein, K. Smith, S. McCallum, M. Woodhead, and C.A. Hackett. 2009. Mapping QTLs for developmental traits in raspberry from bud break to ripe fruit. Theor. Appl. Genet. 118(6):1143-1155.
Jennings, D.L. 1963. Some evidence on the genetic structure of present-day raspberry varieties and some possible implications for further breeding. Euphytica 12(2):229-243.
Kassim, A., J. Poette, A. Paterson, D. Zait, S. McCallum, M. Woodhead, K. Smith, C. Hackett, and J. Graham. 2009. Environmental and seasonal influences on red raspberry anthocyanin antioxidant contents and identification of quantitative traits loci (QTL). Molecular nutrition & food research 53(5):625-634.
Molina Bravo, R. 2009. Genetic and quantitative analysis of red raspberry (Rubus idaeus) for heat tolerance and longer chilling requirement. D., North Carolina State University.
Ross, H.A., G.J. McDougall, and D. Stewart. 2007. Antiproliferative activity is
predominantly associated with ellagitannins in raspberry extracts. Phytochemistry 68(2):218-228.
Tables and Figures
Figure 7. Hue and chroma scatter plot for data taken for underripe, ripe and overripe berries and their average. Background conveys a sense of the general color of individual berries.
0 10 20 30 40 50 60 70 80
10 20 30 40 50 60
Ch
ro
m
a
Hue
Color Data
Table 7. Summary of QTL detected for Hue, Chroma, Anthocyanins and Phenolics, along with the associated linkage group (LG), significant LOD scores and the percent variation explained by the QTL
Traits LG LOD %
Hue 6-NC493 7.72 38.8
Hue 4-NC493 3.51 19.3
Hue 1-NC493 3.49 20.7
Chroma 6-NC493 3.08 19.4
Anthocyanins 1-NC493 3.26 21.6
Anthocyanins 4-NC493 2.39 16.5