DOI: 10.1534/genetics.107.081794
A Statistical Model for Testing the Pleiotropic Control of Phenotypic
Plasticity for a Count Trait
Chang-Xing Ma,*
,1Qibin Yu,
†,1Arthur Berg,
‡Derek Drost,
†Evandro Novaes,
†Guifang Fu,
§John Stephen Yap,
‡Aixin Tan,
‡Matias Kirst,
†Yuehua Cui** and Rongling Wu
‡,2*Department of Biostatistics, University at Buffalo, SUNY, Buffalo, New York 14214,†School of Forest Resources and Conservation,‡Department of Statistics,§Department of Mathematics, University of Florida, Gainesville, Florida 32611 and**Department of Statistics and Probability,
Michigan State University, East Lansing, Michigan 48824 Manuscript received September 11, 2007 Accepted for publication February 14, 2008
ABSTRACT
The differences of a phenotypic trait produced by a genotype in response to changes in the environment are referred to as phenotypic plasticity. Despite its importance in the maintenance of genetic diversity via genotype-by-environment interactions, little is known about the detailed genetic architecture of this phenomenon, thus limiting our ability to predict the pattern and process of microevolutionary responses to changing environments. In this article, we develop a statistical model for mapping quantitative trait loci (QTL) that control the phenotypic plasticity of a complex trait through differentiated expressions of pleiotropic QTL in different environments. In particular, our model focuses on count traits that represent an important aspect of biological systems, controlled by a network of multiple genes and environmental factors. The model was derived within a multivariate mixture model framework in which QTL genotype-specific mixture components are modeled by a multivariate Poisson distribution for a count trait expressed in multiple clonal replicates. A two-stage hierarchic EM algorithm is implemented to obtain the maximum-likelihood estimates of the Poisson parameters that specify environment-specific genetic effects of a QTL and residual errors. By approximating the number of sylleptic branches on the main stems of poplar hybrids by a Poisson distribution, the new model was applied to map QTL that contribute to the phenotypic plasticity of a count trait. The statistical behavior of the model and its utilization were investigated through simulation studies that mimic the poplar example used. This model will provide insights into how genomes and environments interact to determine the phenotypes of complex count traits.
O
NE of the most important challenges facingmod-ern biology is to understand the genetic mech-anisms underlying the adaptation of biological traits to environmental factors and use this knowledge to pre-dict the response of biological structure, organization,
and function to changing environments (Frankset al.
2007; Huntley2007). When grown in different
envi-ronments, an organism may show a range of phenotypes. Such a capacity of the organism to alter its phenotypes in response to changing environment, defined as phe-notypic plasticity, has been recognized by many early
biologists (Waddington1942; Schmalhausen1949).
Some earlier theoretical models, including homeosta-sis, were useful for explaining why some individuals are
insensitive to changes in environment (Waddington
1942). With a rapid and dramatic change in global
cli-mate stimulated by human activities (Grether2005),
the study of phenotypic plasticity has received a resurgence of interest and a renaissance in its
funda-mental role in shaping evolutionary adaptation and
con-sequences (Scheiner1993; Viaet al.1995; Schlichting
and Smith2002; West-Eberhard2003, 2005; Wuet al.
2004; De Jong 2005). Because different genotypes
display a wide range of variation in the level of their
plasticity response (Ungereret al.2003), there must be
a genetic basis for phenotypic plasticity to environmen-tal change. For this reason, the identification of specific genes that contribute to plastic responses has now become an important research area for understanding the genetic and developmental machineries of
organ-ismic adaptation and evolution (Gibertet al.2007).
Genetic mapping of complex traits with molecular markers has been proven powerful for the genomewide characterization of quantitative trait loci (QTL) that
regulate phenotypic plasticity (Wu 1998; Leips and
Mackay 2000; Kliebenstein et al. 2002; Ungerer et al. 2003; Guttelinget al. 2007). The statistical test that measures differences in genetic effects of a QTL across different environments provides meaningful procedures for investigating the genetic mechanisms hypothesized to explain the genetic basis of phenotypic plasticity. The overdominance hypothesis proposes that 1These authors contributed equally to this work.
2Corresponding author:Department of Statistics, University of Florida,
409 McCarty Hall C, Gainesville, FL 32611. E-mail: [email protected]
a heterozygote at relevant genes shows higher stability, or lower plasticity, than a homozygote and the degree of stability is proportional to heterozygosity for these loci
(homeostasis; Gillespieand Turelli1989). The
pleio-tropic hypothesis states that differential expression of the same loci across environments causes phenotypic plasticity (allelic sensitivity; Viaand Lande1985). The epistatic hypothesis suggests that specific plasticity genes exist that interact epistatically with the loci for the mean value of the trait to regulate environmental
sensitivity (gene regulation; Scheiner and Lyman
1989). These hypotheses have been tested with results from QTL mapping in different species from
Arabidop-sis (Kliebenstein et al. 2002; Ungereret al. 2003) to
Populus (Wu1998; Raeet al.2008), Drosophila (Leips
and Mackay2000; Geiger-Thornsberryand Mackay
2002; Anholtand Mackay2004), and Caenorhabditis
(Guttelinget al.2007). All these studies were based on the phenotypic plasticity of continuously varying traits. The genetic control of phenotypic plasticity for count traits—another group of important traits to agriculture, biology, and biomedicine—is still poorly understood.
Statistical models for genetic mapping of continuous traits that are normally distributed have been well
de-veloped in the past two decades (Landerand Botstein
1989; Jansenand Stam1994; Zeng1994; Kaoet al.1999;
Wuet al. 2007; Raeet al. 2008). The idea of mapping
continuous traits has been extended to map binary or ordinal traits that vary in a discontinuous manner on the basis of a threshold model by assuming a continuously
distributed liability underlying these traits (Visscher
et al.1996; Xuand Atchley1996; Yiand Xu1999; Li et al.2006). Different from continuous traits (taking an infinite number of trait values) and ordinal traits (taking a fixed number of discrete trait values), there is also a group of traits measured in counts that are discrete yet may take an infinite number of values. Count data, such as cell numbers, branch numbers, or bristle numbers, play a unique role in determining the phenotypic plasticity of a biological system (Norgaet al.2003).
More recently, Cuiet al.(2006) generalized a
para-metric mapping strategy, as proposed by Rebaı¨(1997),
Shepelet al.(1998), and Senand Churchill(2001), to map and test QTL controlling count traits. Different from traditional treatments based on normality or
threshold assumptions, Cui et al. (2006) and others
(Rebaı¨1997; Shepel et al.1998; Sen and Churchill
2001) modeled count data by incorporating an intrinsic Poisson distribution, thus leading to more reasonable biological interpretations about the genetic effects of a
‘‘count’’ QTL. Cui et al.’s model can be used as a
standard procedure for mapping QTL contributing to the genetic control of complex count traits.
In this article, we integrate the Poisson distribution into a general mapping framework for the identification of QTL that control the phenotypic plasticity of a count trait through their environment-dependent expression.
A particular study of phenotypic plasticity should make use of the advantages of a randomized complete block design with two or more different treatment levels and multiple replicates per each treatment level. Traditional interval mapping generally takes the means of a phenotypic trait over different replicates under each treatment level and then compares the difference in the genetic effect of each detected QTL across different
treatment levels (Hayeset al.1993). However, by taking
averages over replicates, the averaged count traits may no longer be integer valued. Additionally, the covari-ance structure among the replicates cannot be utilized when averages are taken. To overcome these drawbacks, count observations in individual replicates are incorpo-rated into the mapping model by invoking a multivar-iate Poisson distribution with dimension equal to the number of replicates. The estimation of the parameters that describe the multivariate Poisson distribution is obtained by the EM algorithm. The implementation of this algorithm into a mixture-based mapping model generates a two-stage hierarchical EM algorithm in which the Poisson parameters that define the environ-ment-dependent genetic effects of a QTL can be esti-mated. The new model was used to map the QTL that affect sylleptic branch counts and their plasticity across two different fertilization regimes in a Populus hybrid population. Computer simulations are further used to study the performance of the method for mapping environment-sensitive QTL for complex count traits.
MODEL
Model structure and estimation: Consider a
back-cross population withnprogeny in which there are two
different genotypes at each locus. We assume that a genetic linkage map is constructed with polymorphic markers for this backcross. In many plants, such as poplar trees, clonal propagation is possible, thus allow-ing the same progeny to be genotypically replicated. Suppose the backcross considered is planted in a randomized complete block design with two treatment
levels (e.g., low and high fertilization) and R clonal
replicates within each treatment level. Each of the plants studied is measured for a count trait of interest, e.g., the number of branches on a main stem. This experimental design allows the characterization of genetic factors that control the response of each backcross progeny to different treatment levels.
Suppose there is a putative QTL segregating with two
different genotypesQq(coded by1) andqq(coded by2)
in the backcross that affects the phenotypic plasticity of the trait across two treatment levels. This QTL is located somewhere in the genome, which can be detected by the linkage map. Assume the QTL resides between a pair of
flanking markers M1andM2each with two genotypes
coded by 1 and 0. For each backcross progeny, it may
probability with which a particular progeny (i) carries
QTL genotype1or2depends on the marker genotypes
of this progeny at the two flanking markers (M1andM2)
that bracket the QTL. Under the assumption of in-dependent crossovers, the probability of a QTL geno-type given a marker genogeno-type can be derived in terms of
the recombination fractions between M1 and QTL,
between QTL andM2, and between the two markers.
Given that each progeny has a known marker genotype, 11, 10, 01, or 00, the conditional probability of QTL
genotype Qq for a given progeny i given its marker
genotype is denoted asv1jiand the conditional
proba-bility of QTL genotypeqq isv2ji¼1v1ji (Wuet al.
2007).
The trait values of backcross progenyiinRdifferent
replicates under treatment levelk(k¼1, 2), arrayed in
Xik ¼ (Xik1,. . ., XikR), are distributed as a mixture
function with two different groups of QTL genotypes; i.e.,
XikPðXikjQkÞ ¼v1jiP1ðXikjQ1jkÞ1v2jiP2ðXikjQ2jkÞ; ð1Þ
whereQk¼(Q1jk,Q2jk) contains parameters specific to
QTL genotypejfor treatmentk, and Pj(XikjQjjk) is a
probability density function for the count trait, which can be described by a multivariate Poisson distribution, expressed as
PjðXikjQjjkÞ ¼exp XR
r¼1
ujjkr !
YR
r¼1
uXikr
jjkr
Xikr! Xsik
r¼0 YR
l¼1
Xikl
r
3r! QRujjk0
r¼1ujjkr !r
sik¼minðXik1; . . .;XikRÞ; ð2Þ
where eachXikrfollows a Poisson distribution with mean
parameterujjkrthat is the genotypic mean of the count
trait for QTL genotypejin replicaterat treatment level
k and covariance parameter ujjk0 that is the QTL
genotype- and treatment level-specific covariance of the count trait between all the pairs of replicates. Ifujjk0¼0, then the variables are independent and the multivariate Poisson distribution reduces to the product of indepen-dent Poisson distributions.
Assuming that the trait values from different levels of treatment are independent, we construct a likelihood of the unknown parameters given the trait values and
marker information (M) in terms of the mixture model
(1) by combining the two treatment levels; that is
Lðv1ji;v2ji;QkjXik;MÞ ¼Y
n
i¼1
½v1jiP1ðXi1jQ1j1Þ1v2jiP2ðXi1jQ2j1Þ
3Y n
i¼1
½v1jiP1ðXi2jQ1j2Þ1v2jiP2ðXi2jQ2j2Þ: ð3Þ
The maximum-likelihood estimates (MLEs) of the parameters can be obtained by maximizing the likeli-hood (3). In this clonal design, it is reasonable to assume that genotypic means of the count trait are equal among different replicates at each treatment level; that is,
ujjk1¼ . . . ¼ujjkR[ujjk: ð4Þ
Equation 4 suggests that, unlike the general multivariate Poisson model in which different variables are assumed to have different means, our QTL mapping model assumes the same mean for all the variables. Thus, the set of parameters being estimated in the likelihood (3) isQjjk¼(ujjk0,ujjk) (j¼1,2;k¼1, 2). The EM algorithm
can be implemented to estimate the maximum-likeli-hood estimates (MLEs) of these parameters as follows.
E step: Given the data and the current values of the
estimates after the tth iteration Qð1tjÞk and Qð2tjÞk, we calculate the conditional expectations of the complete
data, which include the pseudovalues of progeny i
within treatment levelk,
s1ðtjÞik¼P1 Xik1jQ
ðtÞ
1jk
P1 XikjQ
ðtÞ
1jk
;
s2ðtjÞik¼
P2 Xik1jQ
ðtÞ
2jk
P2 XikjQ
ðtÞ
2jk
;
and the posterior probabilities, with which progenyiat
treatment levelkcarries QTL genotypej,
Vð1tjÞik¼
v1jiP1 XikjQ
ðtÞ
1jk
v1jiP1 XikjQ
ðtÞ
1jk
1v2jiP2 XikjQ
ðtÞ
2jk
;
Vð2tjÞik¼
v2jiP2 XikjQð2tjÞk
v1jiP1 XikjQ
ðtÞ
1jk
1v2jiP2 XikjQ
ðtÞ
2jk
:
M step: The estimates of parameters are updated by
using
u1ðtj1k01Þ¼uð1tjÞk0
Pn i¼1V
ðtÞ
1jiks
ðtÞ
1jik Pn
i¼1V
ðtÞ
1jik ;
u2ðtj1k01Þ¼uð2tjÞk0
Pn i¼1V
ðtÞ
2jiks
ðtÞ
2jik Pn
i¼1V
ðtÞ
2jik ;
uð1tj1k1Þ¼ Pn
i¼1V
ðtÞ
1jikXik Pn
i¼1V
ðtÞ
1jik
uð1tj1k01Þ;
uð2tj1k1Þ¼ Pn
i¼1V
ðtÞ
2jikXik Pn
i¼1V
ðtÞ
2jik
whereXik¼ ð1=RÞPRr¼1Xikr. Both the E and the M steps
are iterated until the estimates converge to stable values according to some prespecified convergence criterion. As usual, the QTL position is estimated via a fixed approach with which the existence of a QTL is scanned at every 2 cM within a marker interval. Significant peaks of the log-likelihood ratio value profile across the genome are thought to be the estimated location of a QTL (see below).
Hypothesis testing: After the genetic parameters are obtained, we need to test whether there is a QTL that affects the count trait at the two levels of treatments. The existence of a QTL can be tested by formulating the hypotheses
H0:u1j1¼u2j1¼u1andu1j2¼u2j2¼u2 vs: H1: Not H0; ð5Þ
where the null hypothesis H0states that the data can be
fit with only one mean for each treatment level, whereas
in the alternative hypothesis H1there are two distinct
means showing that there is a segregating QTL for the trait. The test statistic is the log-likelihood ratio (LR) of
the full (H1) over reduced model (H0), expressed as
LR¼ 2 log Lð
˜
Q1;Q˜2Þ
Lðvˆ1ji;vˆ2ji;Qˆ1j1;Qˆ0j1;Qˆ1j2;Qˆ2j2Þ
" #
;
where the tildes and the circumflexes denote the
MLEs of the unknown parameters under H0and H1,
respectively. Note that the estimation ofðvˆ1ji;vˆ2ji;Qˆ1j1;
ˆ
Q2j1;Qˆ1j2;Qˆ2j2Þdepends on both phenotypic values and
marker data, whereas the estimation of ðQ˜1;Q˜2Þ
de-pends only on phenotypic values. The critical threshold for the declaration of a QTL can be determined from
permutation tests (Churchilland Doerge1994).
If a significant QTL is found, then we can test whether this QTL has a different effect on trait values at two different treatment levels. This test is formulated as
H0: u1j1 ¼u2j1 ¼u1 vs: H1: Not H0; ð6Þ
and
H0: u1j2 ¼u2j2 ¼u2 vs: H1: Not H0: ð7Þ
If the null hypotheses above are both rejected, this implies that the significant QTL detected affects pleio-tropically trait phenotypes at two different treatment levels. Otherwise, this QTL is operational only at one treatment level, which causes genotype-by-environment interactions for the trait.
In practice, although the QTL is pleiotropic, its effect on the trait may depend on the level of treatment. This means that the same QTL has different effects in different environments. Differential expression of a QTL across two different environments can be tested using
H0:u1j1u2j1¼u1j2u2j2
H1:u1j1u2j16¼u1j2u2j2: ð8Þ
The rejection of the above null hypothesis means that a significant genotype-by-environment interaction exists due to allelic sensitivity to a varying environment. Significant genotype-by-environment interactions are one of the genetic causes of phenotypic plasticity. The log-likelihood-ratio test statistics for hypotheses (6)–(8) can be determined from simulation studies.
RESULTS
A worked example: An interspecific hybrid family (designated as 52-124) was generated by crossing Populus deltoides(genotype ILL101) toP. trichocarpa
(ge-notype Gf93-968). One F1 female clone (52-225) was
then crossed with a different P. deltoides individual
(D124), which resulted in a pseudobackcross progeny of 397 individuals. Family 52-124 was genotyped with 171 microsatellite (SSR) markers. The linkage map was
constructed using MapMaker version 3.0 (Landeret al.
1987) following the two-way pseudotestcross mapping
strategy (Grattapagliaand Sederoff1994),
generat-ing a separate map for each of the parents. Markers were assigned to linkage groups at a minimum threshold of LOD 3 and a recombination fraction of 0.35. The re-sulting linkage was mapped onto 19 linkage groups, equivalent to the Populus chromosome number, with all markers displaying internally consistent linkage patterns. Greenwood cuttings (clonal replicates) from each individual of family 52-124 were produced. All plants
were initially grown for 3 weeks under 5 mmof nitrogen
(N) fertilizer, in a modified Hockings solution (Cooke
et al.2003). Next, plants were subjected to two different
N treatment levels (0 and 25 mm) in a randomized
complete block design, with three replicates per level. The number of sylleptic branches derived from the main stem (i.e., those derived from lateral buds without
an intervening stage of rest; Wuand Hinckley2001)
were counted for each tree 30 days later.
We use the pseudotest backcross mapping strategy
proposed by Grattapaglia and Sederoff (1994) to
map branch numbers. This strategy constructs two different sets of linkage maps with molecular markers that are segregating in one parent but not in the other. Although it does not take into account all types of markers segregating in the family, the pseudotest back-cross strategy has been useful for mapping QTL con-trolling quantitative traits in forest trees (Grattapaglia
et al.1996). The number of branches on the main stems
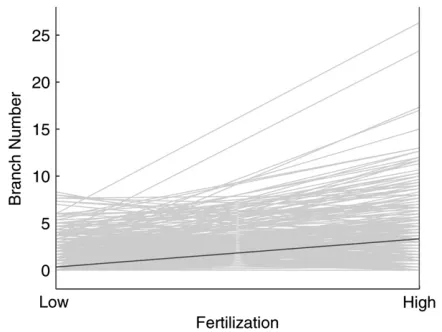
distribution rather than a normal distribution. Thus, existing QTL mapping models based on normality assumption may not work in this particular case. There are many more branches when trees are planted under a high than a low fertilization level, but the degree of increase for branch number with higher fertilization level seems to vary among different progeny (Figure 2), suggesting that genotype-by-environment interactions are important for branch number. The new method was used to scan for the existence and distribution of QTL that control branch numbers throughout father- and mother-based linkage maps using a joint likelihood (3). A significant QTL was detected between markers G2431 and P2855 on the mother-based linkage map since the peak of the log-likelihood ratio profile (1493.5) is beyond the genomewide critical threshold (1391.1) determined from 1000 permutation tests (Figure 3).
This significant QTL detected was further tested for its effects on branch number separately under each fertilization level according to hypotheses (6) and (7). It
displays a significant effect under high fertilization (P¼
0.02), but it is marginally significant under low
fertiliza-tion (P¼0.05). The additive genetic effect of this QTL
estimated from the pseudotest backcross is 5.968 under high fertilization, compared with 2.777 under a low fertilization level (Table 1). A hypothesis test with Equation 8 suggests that these two additive effects are
significantly different (P ¼0.03), suggesting the
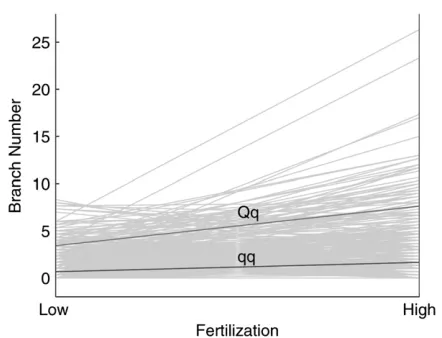
exis-tence of a QTL-by-environment interaction (Figure 4). This QTL explains 49.5 and 70.2% of the total pheno-typic variance for branch number under low and high fertilization levels, respectively.
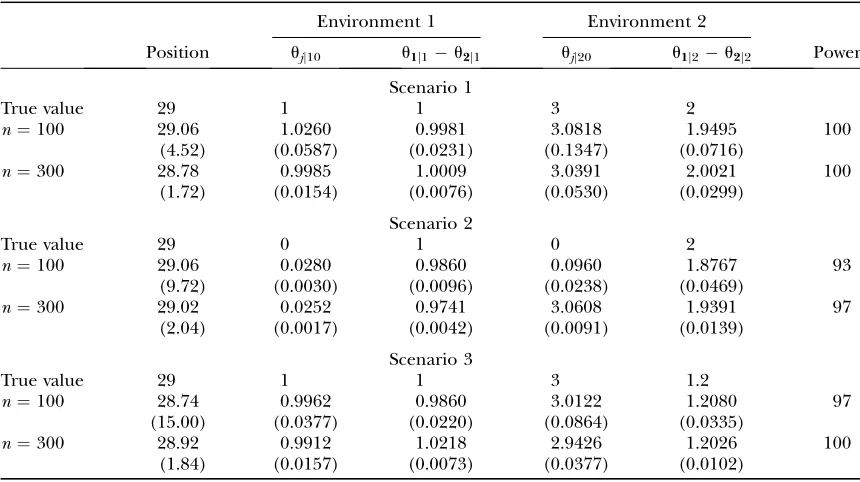
Monte Carlo simulation: To examine the statistical properties of the new model, we performed simulation studies under different scenarios. Consider a backcross for which a linkage group of length 200 cM was simulated with 11 equally spaced markers. Two different
sample sizes (n ¼ 100 and 300) were assumed to
simulate the backcross. The backcross progeny was planted in a complete randomized block design with two different treatment levels and three clonal repli-cates per treatment level. A QTL that determines a count trait was hypothesized at 30 cM from the first marker of the linkage group. The phenotypic values of each backcross at each treatment level were simulated by assuming a trivariate Poisson distribution with a mean depending on the genotype of the assumed QTL. The genetic effect of a QTL is expressed as the difference between two QTL genotypes, which is de-scribed byu1jku2jkat treatment levelk. Three different
simulation scenarios were considered: (1) The genetic effect of a QTL is large and there are covariances among the three replicates, (2) the genetic effect of a QTL is large and there is no covariance among the three replicates, and (3) the genetic effect of a QTL is small and there are covariances among the three replicates. Simulation under each scenario was repeated 1000 times to estimate the means and mean square errors of the parameter estimates.
Table 2 tabulates the results of QTL position and effect estimation by the new model. The model can provide reasonable estimates of all the parameters with
Figure1.—Histograms of the number of
sylleptic branches on the main stem in in-terspecific poplar hybrids grown under low- and high-fertilization levels.
Figure2.—Changes in the number of sylleptic branches on
a modest sample size (100) under the three simulation scenarios considered. The estimation accuracy and precision can increase dramatically when the sample size increases to 300. The Poisson parameters can be better estimated when there is no covariance among replicates (scenario 2) than when such a covariance exists (scenario 1), but the reverse is true for the estimation of the QTL position. As expected, when two QTL genotypes diverge more largely, the QTL
position can be better estimated (scenario 1 vs. 3).
The power to detect significant QTL-by-environment interactions under different simulation scenarios was also calculated. Such power is the largest under scenario 1, followed by scenarios 3 and 2. In all the cases, increasing sample sizes can improve the power for the detection of QTL-by-environment interactions.
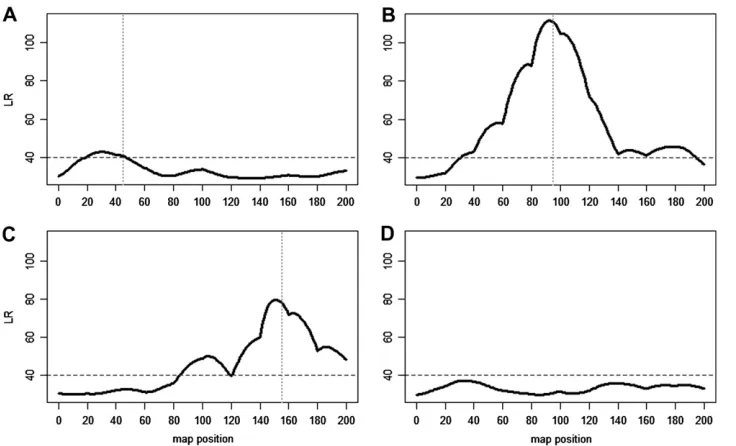
We conducted an additional simulation study in which multiple QTL are involved in the genetic control of a count trait. We simulated a genome composed of four different chromosomes (A–D), each 200 cM long,
covered by 11 equally spaced markers. Three QTL are located at 45, 95, and 155 cM from the first marker on the first three chromosomes, respectively. The pheno-typic data were simulated as trivariate Poisson random variables based on different QTL genotypes and each given treatment level. Due to the assumption in
Equa-tion 4, the simulaEqua-tion for a given treatment level k
requires only two parameters, the covariance uj1j2j3jk0 and mean parameter uj1j2j3jk, for a given three-QTL genotypej1j2j3(j1¼1, 2 for the first QTL on
chromo-some A,j2¼1, 2 for the second QTL on chromosome B,
and j3¼ 1, 2 for the third QTL on chromosome C).
Assuming no epistasis, any three-QTL genotypic mean
Figure3.—Profile of the log-likelihood ratios
(LR) across the length of linkage group 10 from the mother-based linkage map that test the exis-tence of a QTL responsible for the number of syl-leptic branches on the main stem in interspecific poplar hybrids grown under low- and high-fertil-ization levels. Solid blue lines are associated with a joint model that combines low- and high-fertil-ization levels, whereas dashed and dotted lines are associated with high- and low-fertilization lev-els, respectively. Horizontal lines indicate the ge-nomewide thresholds over a total of 19 linkage groups determined from 100 permutation tests. The vertical line with arrow indicates the location of a significant QTL detected. Names of the markers and their map distances (in centimor-gans) are given at the bottom.
TABLE 1
The estimates of the genomic position and genetic effects for the QTL detected on the mother-based linkage map for the
number of sylleptic branches in a pseudotest backcross strategy of interspecific hybrids in poplars grown
under low- and high-fertilization levels
Low High
Marker interval G2431–P2855 Genotypic value
Qq(u1jk) 3.434 7.628
qq(u2jk) 0.657 1.660
Additive effect (u1jku2jk) 2.777 5.968
Figure4.—Plots of two different genotypes at the QTL
can be expressed as the sum of genotypic means at individual QTL; that is,
u111jk¼uj1¼1jk1uj2¼1jk1uj3¼1jk;
u112jk¼uj1¼1jk1uj2¼1jk1uj3¼1jk1a3;
u121jk¼uj1¼1jk1uj2¼1jk1uj3¼1jk1a2;
u122jk¼uj1¼1jk1uj2¼1jk1uj3¼1jk1a21a3;
u211jk¼uj1¼1jk1uj2¼1jk1uj3¼1jk1a1;
u212jk¼uj1¼1jk1uj2¼1jk1uj3¼1jk1a11a3;
u221jk¼uj1¼1jk1uj2¼1jk1uj3¼1jk1a11a2;
u222jk¼uj1¼1jk1uj2¼1jk1uj3¼1jk1a11a21a3;
wherea1,a2, anda3are the additive genetic effects of the
simulated QTL, respectively. Three QTL were assumed to display different effects at two different levels of treatment. Figure 5 illustrates the profile of the LR values calculated from an arbitrary simulation run to test the distribution of QTL across all four simulated chromosomes. As shown, all three QTL can be detected from our model. Table 3 lists the MLEs of the positions and genetic effects of different QTL and the square roots of mean square errors of the MLEs when different sample sizes are assumed. Our model can estimate the positions of three different QTL and their genetic effects with reasonable accuracy and precision. As expected, QTL of larger effects can be better estimated than those of smaller effects. Also, the estimation precision can be increased with increased sample sizes.
DISCUSSION
Genetic mapping of QTL has been instrumental for the characterization of major loci that are responsible
for a variety of quantitative traits (Mackay 2001;
Anholt and Mackay2004; Li et al.2006; Paterson 2006). More recently, QTL mapping techniques have been considerably extended to approach many bi-ologically meaningful issues, among which genetic mapping of the phenotypic plasticity of a count trait has not received adequate attention as compared to its fundamental importance in statistics and biology. While most statistical models for QTL mapping are based on the normality assumption for continuous
traits (Landerand Botstein1989; Zeng1994; Jiang
and Zeng 1995; Lynch and Walsh 1998; Wu et al.
2007) or the log-normality assumption for binary or ordinal traits (Liet al.2006), there is also a group of traits in nature and of importance to agriculture and biomedicine that are expressed in counts, such as the numbers of leaves, branches, and seeds pro-duced by a plant or the number of cancer cells. These count traits are typically better described by a Poisson distribution than by a normal distribution, and thus many existing models may not be appropriate for mapping this type of trait. To fully consider the statistical nature of count traits, some authors attemp-ted to incorporate the Poisson distribution into a
standard mapping model (Rebaı¨1997; Shepel et al.
1998; Sen and Churchill 2001; Cui et al. 2006),
TABLE 2
The MLEs of the genomic position and effect for a hypothesized QTL (described asu1jku2jk) simulated under
three different scenarios to control a count trait in different environments in a pseudotest backcross strategy
Environment 1 Environment 2
Position ujj10 u1j1u2j1 ujj20 u1j2u2j2 Power
Scenario 1
True value 29 1 1 3 2
n¼100 29.06 1.0260 0.9981 3.0818 1.9495 100
(4.52) (0.0587) (0.0231) (0.1347) (0.0716)
n¼300 28.78 0.9985 1.0009 3.0391 2.0021 100
(1.72) (0.0154) (0.0076) (0.0530) (0.0299)
Scenario 2
True value 29 0 1 0 2
n¼100 29.06 0.0280 0.9860 0.0960 1.8767 93
(9.72) (0.0030) (0.0096) (0.0238) (0.0469)
n¼300 29.02 0.0252 0.9741 3.0608 1.9391 97
(2.04) (0.0017) (0.0042) (0.0091) (0.0139)
Scenario 3
True value 29 1 1 3 1.2
n¼100 28.74 0.9962 0.9860 3.0122 1.2080 97
(15.00) (0.0377) (0.0220) (0.0864) (0.0335)
n¼300 28.92 0.9912 1.0218 2.9426 1.2026 100
(1.84) (0.0157) (0.0073) (0.0377) (0.0102)
aimed to map ‘‘count’’ QTL that determine a unique aspect of biological systems.
There is no difficulty in using current-interval map-ping, composite-interval mapmap-ping, or multiple-interval mapping approaches to map the phenotypic plasticity of a biological trait, defined as the phenotypic difference of the same genotype across a range of environments
(Wu1998; Leipsand Mackay2000; Kliebensteinet al.
2002; Ungerer et al. 2003), although a mechanistic
basis of the difference of QTL expression between different environments is not considered. However, by extending these mapping approaches into a multivari-ate case in which phenotypic vales of a trait in different environments can be regarded as different ‘‘traits’’ ( Jansenet al.1995; Jiangand Zeng1995), environment-dependent genetic effects of a QTL can be estimated and tested. The idea of multitrait QTL mapping was used in this study to map a QTL that triggers a pleio-tropic effect on a count trait expressed in different environments. If such a pleiotropic effect is different between environments, genotype-by-environment
inter-actions at this QTL result (Ungereret al.2003).
Our model capitalizes on the merit of a randomized complete block design, characteristic of the study of phenotypic plasticity, in which the same genotypes are grown in different environments with multiple repli-cates per environment used to minimize microenviron-mental noises. By incorporating a multivariate Poisson distribution, our model allows the modeling of count data in individual replicates, thus avoiding losing the integer-valued structure of the data when means over replicate traits are taken. The estimation of the multi-variate Poisson distribution is a difficult issue, but a powerful EM algorithm has been implemented to
estimate the parameters (Karlis 2003; Tsiamyrtzis
and Karlis2005). We integrate this multivariate
Pois-son-based model into a standard mixture model for QTL mapping, leading to a two-stage hierarchical EM algorithm that can estimate and test the genetic effects of a QTL expressed in different environments. Through computer simulation, we investigated the statistical behavior of the new model in terms of its estimation accuracy and precision and the power to detect envi-ronment-dependent QTL for a count trait. Our simula-tion results suggest that a modest number of mapping
TABLE 3
The MLEs of the genomic positions and effects for three hypothesized QTL distributed over the genome that control
a count trait in different environments in a pseudotest backcross strategy
Position u1j1u2j1 u1j2u2j2
QTL 1 45 0 1
n¼100 45.07 0.0108 1.0320 (0.36) (0.3490) (0.5344) n¼300 45.03 0.0175 1.059
(0.36) (0.3490) (0.5344)
QTL 2 95 1 2
n¼100 94.79 0.9304 2.0807
(0.74) (0.2933) (0.4579)
n¼300 94.80 0.9819 2.0010
(0.40) (0.1651) (0.2523)
QTL 3 155 0 1.8
n¼100 154.85 0.0134 1.7965 (0.50) (0.3493) (0.5051) n¼300 154.85 0.0017 1.8017
(0.28) (0.1766) (0.2594)
Numbers in parentheses are the square roots of mean square errors of the parameters obtained from 200 simulation replicates.
Figure 5.—Profile of the
progeny (100) can offer reasonable parameter estima-tion and power that is improved with increasing genotypic differences. The application of our model to a real example for Populus genetics leads to the detection of a significant QTL for the number of sylleptic branches that increases significantly with better fertilization. By the continuous development of an axillary meristem into a branch without an intervening stage of rest, syllepsis has been thought to be an
important determinant of wood production (Wu and
Hinckley2001). The identification of an environment-sensitive QTL for the number of sylleptic branches is consistent with previous findings that this type of branch is under strong genetic control and highly plastic to
changes in environment (Wuand Stettler1998).
Our model can be used to test one of three existing hypotheses proposed to explain phenotypic plastici-ty—allelic sensitivity;i.e., different expression of a QTL in different environments causes the phenotypic
plas-ticity of a trait (Via and Lande 1985). Although the
pseudotest backcross design used, in which only two, rather than all three possible, genotypes exist, does not allow for the test of the overdominance hypothesis (Gillespieand Turelli1989), this hypothesis can be
tested by including F2-type codominant markers and
QTL, i.e., those loci that are segregating for both
parents and thus form two homozygotes and one heterozygote, in the mapping population derived from outcrossing trees (Linet al.2003). It is also possible that our model can be modified to model the gene regula-tion hypothesis of phenotypic plasticity by assuming different but epistatically interacting QTL for plas-tic responses and means of a trait across different
en-vironments (Scheiner and Lyman 1989; Weber and
Scheiner 1992). In addition, there are some other issues that deserve further investigation. In genetics, it is practically useful to implement composite-interval
mapping (Zeng 1994; Jansen and Stam 1994) and
multiple-interval mapping (Kao et al. 1999) into our
Poisson-based mapping model because these techni-ques have a capacity to remove the background noise of QTL effects and/or map a network of interacting QTL at the same time. In the current statistical model,
we used a single Poisson parameter (u0) to model the
covariance structure among different replicates, but the power of our model can increase if more sophisticated
modeling is used for the covariance structure (Karlis
2003). Also, Cui et al.(2006) recently generalized the
Poisson-based mapping model to take into account the dispersion of count data. By estimating and testing a dispersion parameter in our model, we are able to estimate the genetic effects of a QTL on the direction and degree of the dispersion of a count trait.
Characterizing how the genetic architecture of a complex trait differs across environments is an impor-tant first step toward elucidating the mechanistic basis of genotype-by-environment interactions and ultimately
predicting final phenotypes in a given environment. To achieve this goal, it is necessary to identify genes underlying quantitative variation in plastic response of various complex traits (including count traits) to changes in environments and determine how these genes act singly or interact epistatically to determine different phenotypes across ecologically relevant envi-ronments. The model proposed in this article and its extensions as discussed above will provide a powerful tool to gain insights into how genomes and environ-ments interact to determine phenotypes and further alter the evolutionary process of adaption.
We thank the graduate students in STA 6178 class of Spring 2007 at the University of Florida for their contributions to this work. The preparation of this manuscript was supported by National Science Foundation grant 0540745 to R.W.
LITERATURE CITED
Anholt, R. R., and T. F. C. Mackay, 2004 Quantitative genetic
anal-yses of complex behaviours inDrosophila.Nat. Rev. Genet.5:838– 849.
Churchill, G. A., and R. W. Doerge, 1994 Empirical threshold
val-ues for quantitative trait mapping. Genetics138:963–971. Cooke, J. E. K., K. A. Brown, R. L. Wuand J. M. Davis, 2003 Gene
expression associated with N-induced shifts in resource alloca-tion in poplar. Plant Cell Env.26:757–770.
Cui, Y. H., D.-Y. Kimand J. Zhu, 2006 On the generalized Poisson
regression mixture model for mapping quantitative trait loci with count data. Genetics174:2159–2172.
de Jong, G., 2005 Evolution of phenotypic plasticity: patterns of
plasticity and the emergence of ecotypes. New Phytol. 166:
101–117.
Franks, S. J., S. Simand A. E. Weis, 2007 Rapid evolution of
flower-ing time by an annual plant in response to a climatic fluctuation. Proc. Natl. Acad. Sci. USA104:1278–1282.
Geiger-Thornsberry, G. L., and T. F. C. Mackay, 2002 Association
of single-nucleotide polymorphisms at the Delta locus with geno-type by environment interaction for sensory bristle number in
Drosophila melanogaster.Genet. Res.79:211–218.
Gibert, J. M., F. Peronnetand C. Schlo¨ tterer, 2007 Phenotypic
plasticity inDrosophilapigmentation caused by temperature sen-sitivity of a chromatin regulator network. PLoS Genet.3:e30. Gillespie, J. H., and M. Turelli, 1989 Genotype-environment
in-teractions and the maintenance of polygenic variation. Genetics
121:129–138.
Grattapaglia, D., and R. R. Sederoff, 1994 Genetic linkage maps
ofEucalyptus grandisand Eucalyptus urophyllausing a pseudo-testcross: mapping strategy and RAPD markers. Genetics 137:
1121–1137.
Grattapaglia, D., F. L. G. Bertolucci, R. Pencheland R. R. Sederoff,
1996 Genetic mapping of quantitative trait loci controlling growth and wood quality traits inEucalyptus grandisusing a maternal half-sib family and RAPD markers. Genetics144:1205–1214. Grether, G. F., 2005 Environmental change, phenotypic plasticity,
and genetic compensation. Am. Nat.166:E115–E123. Gutteling, E. W., J. A. G. Riksen, J. Bakkerand J. E. Kammenga,
2007 Mapping phenotypic plasticity and genotype environment interactions affecting life-history traits inCaenorhabditis elegans.
Heredity98:28–37.
Hayes, P. M., B. H. Liu, S. J. Knapp, F. Chen, B. Jones et al.,
1993 Quantitative trait locus effects and environmental interac-tion in a sample of North-American barley germ plasm. Theor. Appl. Genet.87:392–401.
Huntley, B., 2007 Limitations on adaptation: Evolutionary
re-sponse to climatic change? Heredity98:247–248.
Jansen, R. C., and P. Stam, 1994 High resolution mapping of
quan-titative traits into multiple loci via interval mapping. Genetics
Jansen, R. C., J. W. VanOoijen, P. Stam, C. Listerand C. Dean,
1995 Genotype-by-environment interaction in genetic mapping of multiple quantitative trait loci. Theor. Appl. Genet.91:33–37. Jiang, C., and Z.-B. Zeng, 1995 Multiple trait analysis of genetic
mapping for quantitative trait loci. Genetics140:1111–1127. Kao, C. H., Z.-B. Zengand R. D. Teasdale, 1999 Multiple interval
mapping for quantitative trait loci. Genetics152:1203–1216. Karlis, D., 2003 An EM algorithm for multivariate Poisson
distribu-tion and related models. J. Appl. Stat.30:63–77.
Kliebenstein, D. J., A. Figuth and T. Mitchell-Olds,
2002 Genetic architecture of plastic methyl jasmonate re-sponses inArabidopsis thaliana.Genetics161:1685–1696. Lander, E. S., and D. Botstein, 1989 Mapping Mendelian factors
underlying quantitative traits using RFLP linkage maps. Genetics
121:185–199.
Lander, E. S., P. Green, J. Abrahamson, A. Barlow, M. Daleyet al.,
1987 MAPMAKER: an interactive computer package for con-structing primary genetic linkage maps of experimental and nat-ural populations. Genomics1:174–181.
Leips, J., and T. F. C. Mackay, 2000 Quantitative trait loci for
lifespan in Drosophila melanogaster: interactions with genetic background and larval density. Genetics155:1773–1788. Li, J., S. C. Wangand Z.-B. Zeng, 2006 Multiple interval mapping
for ordinal traits. Genetics173:1649–1663.
Lin, M., X.-Y. Lou, M. Changand R. L. Wu, 2003 A general
statis-tical framework for mapping quantitative trait loci in nonmodel systems: issue for characterizing linkage phases. Genetics165:
901–913.
Lynch, M., and B. Walsh, 1998 Genetics and Analysis of Quantitative
Traits.Sinauer, Sunderland, MA.
Mackay, T. F. C., 2001 Quantitative trait loci inDrosophila.Nat. Rev.
Genet.2:11–20.
Norga, K. K., M. C. Gurganus, C. L. Dilda, A. Yamamoto, R. F. Lyman
et al., 2003 Quantitative analysis of bristle number in Drosophila mutants identifies genes involved in neural development. Curr. Biol.13:1388–1397.
Paterson, A. H., 2006 Leafing through the genomes of our major
crop plants: strategies for capturing unique information. Nat. Rev. Genet.7:174–184.
Rae, A. M., M. P. C. Pinel, C. Bastien, M. Sabatti, N. R. Streetet al.,
2008 QTL for yield in bioenergy Populus: identifying G3E interactions from growth at three contrasting sites. Tree Genet. Genomics4:97–112.
Rebaı¨, A., 1997 Comparison of methods for regression interval
map-ping in QTL analysis with non-normal traits. Genetics69:69–74. Scheiner, S. M., 1993 Genetics and evolution of phenotypic
plastic-ity. Annu. Rev. Ecol. Syst.24:35–68.
Scheiner, S. M., and R. F. Lyman, 1989 The genetics of phenotypic
plasticity. 1. Heritability. J. Evol. Biol.2:95–107.
Schlichting, C. D., and H. Smith, 2002 Phenotypic plasticity:
link-ing molecular mechanisms with evolutionary outcomes. Evol. Ecol.16:189–201.
Schmalhausen, I. I., 1949 Factors of Evolution. Blakiston,
Philadelphia.
Sen, S., and G. A. Churchill, 2001 A statistical framework for
quan-titative trait mapping. Genetics159:371–387.
Shepel, L. A., H. Lan, J. D. Haag, G. M. Brasic, M. E. Gheenet al.,
1998 Genetic identification of multiple loci that control breast cancer susceptibility in the rat. Genetics149:289–299. Tsiamyrtzis, P., and D. Karlis, 2005 Strategies for efficient
compu-tation of multivariate Poisson probabilities. Commun. Stat. Simul. Comput.33:271–292.
Ungerer, M. C., S. S. Halldorsdottir, M. D. Puruggananand T. F.
Mackay, 2003 Genotype–environment interactions at
quantita-tive trait loci affecting inflorescence development inArabidopsis thaliana.Genetics165:353–365.
Via, S., and R. Lande, 1985 Genotype-environment interactions and
the evolution of phenotypic plasticity. Evolution39:505–522. Via, S., R. Gomulkievicz, G. deJong, S. M. Scheiner and C. D.
Schlichting, 1995 Adaptive phenotypic plasticity: consensus
and controversy. Trends Ecol. Evol.10:212–217.
Visscher, P. M., C. S. Haleyand S. A. Knott, 1996 Mapping QTLs
for binary traits in backcross and F2 populations. Genet. Res.68:
55–63.
Waddington, C. H., 1942 Canalization of development and the
in-heritance of acquired characters. Nature150:563–565. Weber, S. L., and S. M. Scheiner, 1992 The genetics of phenotypic
plasticity. 4. Chromosomal localization. J. Evol. Biol.5:109–120. West-Eberhard, M. J., 2003 Developmental Plasticity: An Evolution.
Oxford University Press, New York.
West-Eberhard, M. J., 2005 Developmental plasticity and the
ori-gin of species differences. Proc. Natl. Acad. Sci. USA 102:
6543–6549.
Wu, R. L., 1998 The detection of plasticity genes in heterogeneous
environments. Evolution52:967–977.
Wu, R. L., and T. M. Hinckley, 2001 Phenotypic plasticity of
syllep-tic branching: genesyllep-tic design of tree architecture. Crit. Rev. Plant Sci.20:467–485.
Wu, R., and R. F. Stettler, 1998 Quantitative genetics of growth
and development in Populus.III. The phenotypic plasticity of crown structure and function. Heredity81:299–310.
Wu, R. L., J. E. Grissom, S. E McKeand and D. M. O’Malley,
2004 Phenotypic plasticity of fine root growth increases plant productivity in pine seedlings. BMC Ecol.4:14.
Wu, R. L., C.-X. Maand G. Casella, 2007 Statistical Genetics of
Quan-titative Traits: Linkage, Maps, and QTL.Springer-Verlag, New York. Xu, S., and W. R. Atchley, 1996 Mapping quantitative trait loci for
complex binary diseases using line crosses. Genetics143:1417– 1424.
Yi, N., and S. Xu, 1999 A random model approach to mapping
quan-titative trait loci for complex binary traits in outbred populations. Genetics153:1029–1040.
Zeng, Z.-B., 1994 Precision mapping of quantitative trait loci.
Ge-netics136:1457–1468.