DOI: 10.1534/genetics.104.031666
Quantifying the Relationship Between Gene Expressions and
Trait Values in General Pedigrees
Yan Lu,* Peng-Yuan Liu,* Yong-Jun Liu,* Fu-Hua Xu* and Hong-Wen Deng*
,†,‡,1*Osteoporosis Research Center, Creighton University, Omaha, Nebraska 68131,†Key Laboratory of Biomedical Information Engineering of Ministry of Education and Institute of Molecular Genetics, School of Life Science and Technology, Xi’an Jiaotong University,
Xi’an 710049, People’s Republic of China and‡Laboratory of Molecular and Statistical Genetics, College of Life Sciences, Hunan Normal University, Changsha, Hunan 410081, People’s Republic of China
Manuscript received May 25, 2004 Accepted for publication September 13, 2004
ABSTRACT
Treating mRNA transcript abundances as quantitative traits and examining their relationships with clinical traits have been pursued by using an analytical approach of quantitative genetics. Recently, Kraft et al. presented a family expression association test (FEXAT) for correlation between gene expressions and trait values with a family-based (sibships) design. This statistic did not account for biological relationships of related subjects, which may inflate type I error rate and/or decrease power of statistical tests. In this article, we propose two new test statistics based on a variance-components approach for analyses of microarray data obtained from general pedigrees. Our methods accommodate covariance between relatives for unmeasured genetic effects and directly model covariates of clinical importance. The efficacy and validity of our methods are investigated by using simulated data under different sample sizes, family sizes, and family structures. The proposed LR method has correct type I error rate with moderate to large sample sizes regardless of family structure and family sizes. It has higher power with complex pedigrees and similar power to the FEXAT with sibships. The other proposed FEXAT(R) method is favorable with large family sizes, regardless of sample sizes and family structure. Our methods, robust to population stratification, are complementary to the FEXAT in expression-trait association studies.
I
N the past few years, there has been increasing inter- proach to mapping the determinants of variation inest in genetic studies of complex diseases by combin- gene expression. Their results suggested that the
expres-ing information on clinical traits, marker genotypes, sion of most genes is affected by more than one locus
and comprehensive gene expressions. It was proposed (Brem et al.2002). Most complex human phenotypes
that standard methods of quantitative genetics can be are also influenced by multiple genes (Chakravarti
applied to microarray data analyses (Wolfingeret al. 1999). In developing analytical tools, it is important to
2001;Kraftet al.2003). Treating mRNA transcript lev- consider genetic structure of/between gene expressions
els as quantitative traits, efforts have been pursued in or of/between gene expression and a complex trait.
examining their relationships with clinical traits and Replication is important in microarray experiments
mapping gene expression quantitative trait loci (eQTL) (KerrandChurchill2001;Nguyenet al.2002;Yang
for these traits by using an analytical approach of quanti- andSpeed2002). Technical replication, such as spotting
tative genetics (Kraft et al.2003;Schadtet al.2003). genes multiple times per array and hybridizing multiple
Gene-expression levels are represented in populations arrays to the same samples, can address only the
mea-by continuous variation. The studies in model organisms surement error of an experiment. Bakayet al.(2002)
illustrated the genome-wide view of gene-expression lev- found that major unwanted variability in expression
pro-els as heritable phenotypes (Cheung and Spielman filing experiments was from a substantial interindividual
2002). Liet al.compared transcript levels in lymphoblas- variability. Such variability can be addressed by using
toid cell lines from twins by cDNA microarray and RT- multiple individuals randomly sampled from a
popula-PCR to study the heritability of gene expression in hu- tion. However, as in genetic epidemiology studies,
ran-mans. The distribution of the heritability among all dom sampling of individuals is liable to population
strat-genes showed a moderate and homogeneous positive ification that may not only inflate type I error but also
shift that affects the majority of genes (Liet al.2003).
mask real genetic effects (Deng2001).
Brem et al. used a genome-wide genetic linkage
ap-Families generally contain more information about inherited traits than do random unrelated individuals, and family-based studies usually rely on variation and 1Corresponding author: Osteoporosis Research Center, Creighton
covariation among relatives. RecentlyKraftet al.(2003)
University, 601 N. 30th St., Suite 6787, Omaha, NE 68131.
E-mail: [email protected] made pioneering efforts to adopt a family-based design
FEXAT(R) statistic:To account for complete family
struc-in microarray studies to mstruc-inimize systematic biases such
ture—the relationships between all subjects within a
pedi-as those from stratification. Stratification wpedi-as recognized
gree—we propose here a statistic FEXAT(R), a revised version
as a confounding factor contributing to spurious associa- of the FEXAT. DenoteX
i ⫽(xi1, . . . ,xi n i)Tand Yi⫽ (yi1,
tion between transcript abundance and disease status . . . , y
i n i)Tas gene-expression levels and trait values within familyi(withnimeasured subjects), respectively. They can be
in the sample (Gibson2003;Kraftet al.2003).Kraft
expressed, respectively, as
et al. (2003) presented a stratified family expression
association test (FEXAT) to examine the correlation X
i⫽WXiX⫹UXiFXi⫹zXi⫹eXi (2)
between gene expressions and traits, which was claimed
and
to account for family structure. The FEXAT has a
smaller false-discovery rate than the standard Pearson’s Yi⫽WY
iY⫹UYiFYi⫹zYi⫹eYi, (3)
correlation coefficient test when within-family
correla-whereXandY, respectively, are the vectors of fixed effects of tion is of interest. However, it considers only sibship
gene-expression levels and trait values, which may incorporate
means and does not account for biological relationships
effects of any observable covariates (e.g., sex and age) as well
between subjects within families. In addition, for large as overall means of gene-expression levels and trait values.W
Xi
and complex pedigrees, the FEXAT uses only data from andWYiare the incidence matrices ofXandY, respectively.
FXi and FYi, respectively, are the family-mean differences of
sibships extracted from large and complex pedigrees
gene-expression levels and trait values, which may be due to
and does not utilize the information from all the
pedi-confounding factors such as population stratification (Kraft
gree members fully and simultaneously.
et al.2003);FXiⵑN(0, 2
FXiJi) andFYiⵑN(0, 2
FYiJi), whereJi
Factors such as age, genotype, sex, and habitual physi- is a matrix with all elements being 1. U
Xi and UYi are the
cal activity are important sources of variation in microar- incidence vectors ofFX iandFYiwith elements of 0 or 1,
respec-tively.zXiandzYiare the vectors of additive genetic effects of
ray experiments (Jinet al.2001;Nogalskaand
Swierc-gene-expression levels and trait values, respectively;zXiⵑN(0, zynski 2001; Roth et al. 2002; Yang et al. 2003) and
2
ZXiGi) and zYiⵑN(0, 2
ZYiGi), where Gi is the relationship
for complex traits (Denget al.2002). These factors may matrix for the n
i observed individuals within family i. The
affect statistical analyses if they are not accounted for. elements ofG
iare twice the coefficients of kinship.eXiand
Hence, covariate effects should be considered simulta- eYiare the vectors of residual effects of gene-expression levels
and trait values within family i, respectively; eXiⵑN(0,2
eXiI)
neously and explicitly for gene expression and
quantita-tive trait analyses, which is done in the FEXAT (Kraft andeYiⵑN(0,2
eYiI), whereIis anni⫻niidentity matrix. The
et al.2003) and new analyses that are being developed. variances of Xi and Yi are thus VXi⫽
2
FXiJi⫹ 2
ZXi Gi⫹ 2
eXiI
Stimulated largely by the pioneering work ofKraftet andVYi⫽
2
FYiJi⫹ 2
ZYiGi⫹ 2
eYiI, respectively. The FEXAT(R)
al.(2003), to account for family structure and potential can be expressed as
covariate effects, we propose a modified FEXAT statistic FEXAT(R)
and a bivariate analysis based on a variance-components
approach to quantify the correlation between gene-expres- ⫽ {兺i[(Xi⫺WXiXi)TV⫺Xi1/2V
⫺1/2
Yi (Yi⫺WYiYi)]}
2
兺i(1/(ni⫺1))[兺i(Xi⫺WXiXi)TVX⫺i1(Xi⫺WXiXi)兺i(Yi⫺WYiYi) TV⫺1
Yi(Yi⫺WYiYi)]
.
sion levels and complex clinical traits. The properties
(4)
of these two methods in terms of power and type I error
Similar to the FEXAT, in practical data analyses,P-values for
rate are explored in a range of situations, in comparison
this statistic can be obtained by2
1test or permutation test.
with the FEXAT.
Likelihood-ratio statistic:We present a new statistic [likeli-hood ratio (LR)] by conducting analyses in a bivariate variance-components framework (Lange and Boehnke 1983; Lange
MATERIALS AND METHODS
1997). DefineX ⫽ (X1, . . . , Xi, . . . , Xn)T andY ⫽ (Y1,
. . . ,Yi, . . . ,Yn)Tas gene-expression levels and trait values from
FEXAT statistic:As a starting point, we briefly introduce
the whole sample whereXiandYiwere defined in Equations 2
the statistic FEXAT proposed byKraftet al.(2003),
and 3.XandYcan be written in a matrix form as FEXAT⫽ [兺i兺jxi j(yi j⫺yi.)]
2
兺i(1/ni⫺1)兺i(xi j⫺xi.)2兺j(yi j⫺yi.)2
, (1)
冢
X Y冣
⫽冢
WXX
WYY
冣
⫹
冢
UXFXUYFY
冣
⫹
冢
zXzY
冣
⫹
冢
eXeY
冣
, (5)
wherei⫽1, . . . ,nindex the sibships in the study (extended
pedigrees may contribute multiple sibships) andj⫽1, . . . , where WX⫽(WX1, . . . ,WXi, . . . ,WXn) T,W
Y⫽(WY1, . . . ,WYi, niindex the subjects in a sibship.xi jis the expression level for . . . , WY
n) T, F
X⫽(FX1, . . . , FXi, . . . , FXn) T, F
Y⫽(FY1,
subjectjin familyi, which is measured as the (log of the) fold . . . ,F
Y1, . . . ,FYn) T, change of the expression for the gene under study in the
subject’s RNA relative to a reference sample as in cDNA arrays or as match-mismatch score as in oligonucleotide arrays. yi j is the trait value. This FEXAT statistic is compared with its asymptotic2
1distribution or an empirical permutation distri-bution to deriveP-values in practical data analyses (Kraftet al.2003). It accounts only for sibship means for gene expres-sion levels and trait values and does not consider family struc-ture—the biological relationship between subjects within a family. If the family structures are pedigrees, some subjects will need to be excluded to calculate the statistic, since it
.
Figure1.—Two types of pedigree structures in simulations.
X,Y,WXi,WYi,FXi, andFYiwere defined for Equations 2 and 3. Thus, the variance-covariance matrix is
article, the first number is for families and the second number for subjects within each family); and the second sample
con-V⫽J丢
冤
2
fx fxy
fxy 2fy
冥
⫹G丢冤
2
ax axy
axy 2ay
冥
⫹I丢冤
2
ex exy
exy 2ey
冥
, sisted of 8 families of size 12 (8⫻12); and the third sample consisted of 16 families of size 12 (16⫻ 12). To study the (6)effects of family structures on these three methods, we simu-where
lated three family structures: two of them were pedigrees and another was sibship. Sibship structure is a group of full-sibs without parents. The pedigree structures are illustrated in Figure 1. According to the definition of the FEXAT (Kraft
et al.2003), a large sibship of size 8 in each pedigree was used to calculate the statistic FEXAT in pedigree type A, whereas in pedigree type B, the complex pedigree should be broken .
into three sibships to calculate the statistic FEXAT. To study the effects of family sizes on these three statistical methods,
JiandGiwere defined for Equations 2 and 3.Iis an identity
we simulated another sample with 24 sibships of size 4 (24⫻ matrix.2
fxand2fydenote the family mean variances of the
4) to compare it with the situations of 8 sibships of size 12 (8⫻ studied gene-expression levels and trait values in the study
12) under the same sample size. For simplicity, we considered a population, respectively.fxydenotes the corresponding
covari-case in the simulation studies ofKraftet al.(2003);i.e.,the ance between them.2
axand2aydenote the variances of
addi-ratio of variance in family means to variance in within-family tive effects of the studied gene-expression levels and trait values
differences is 1:1. Our simulation results (not shown) indi-in the population, respectively.axydenotes the corresponding
cated that this ratio has little effect on the comparison of the covariance between them.2
exand2eydenote the variances of
three methods. Total variation of gene-expression levels and residual effects of the studied gene-expression levels and trait
trait values were fixed at 1. We studied four levels of genetic values in the population, respectively.exydenotes the
corre-correlation between gene-expression levels and trait values sponding covariance between them. The genetic correlation
(0.0, 0.3, 0.5, and 0.7) and three heritability levels for both between gene-expression levels and trait values can be
calcu-the gene-expression levels and trait values (0.2, 0.4, and 0.6), lated asaxy⫽ axy/√2ax2ay.
respectively. In addition, we considered two situations about Under the assumption of the multivariate normality of
gene-covariates: (1) there were no covariate effects;i.e.,cX⫽ cY⫽ expression levels and trait values, the ln-likelihood ofV,X,
0, wherecXandcYare the regression coefficients of the gene-andYgiven the observed data (X,Y,WX,WY) is
expression levels and trait values on a specific covariate c, respectively; and (2) there were covariate effects on the
gene-lnL(V,X,Y|X,Y,WX,WY)⫽ ⫺
t
2ln(2)⫺
1
2|V|⫺ ⌬
TV⫺1⌬,
expression levels and trait values. We assume thatcX⫽ cY⫽ 0.2 and covariate effects were drawn from a standardized nor-(7) mal distribution. When there were covariate effects on the
where gene-expression levels and trait values, the computation of
the FEXAT statistic used the adjusted (for the covariate) gene-expression levels and trait values that were implemented in t⫽
兺
n
i
ni and ⌬ ⫽
冢
X⫺WXX
Y⫺WYY
冣
.
the standard regression analyses. We also assumed that the family-mean correlation between gene-expression levels and Maximum-likelihood estimates can be obtained via a
Fisher-trait values is 0.3, which may be due to confounding factors scoring algorithm implemented in each sibship and/or
pedi-such as population stratification (Kraftet al.2003). Although gree (LangeandBoehnke1983). Once maximum-likelihood
our simulation results are presented for the above assumed estimates are available, one can test hypotheses of interest by
parameter values, our results for other parameter values (not the LR statistic,
shown here) indicated similar conclusions obtained with those presented here.
LR⫽ ⫺2 lnL(axy⫽0) L(ˆaxy)
. (8) For each scenario, we generated 10,000 replicate studies and calculated the FEXAT, FEXAT(R), and LR test statistics for two nominal significance levels of␣ ⫽0.05 and␣⫽0.01, This test statistic is approximately chi-square distributed with
1 d.f. We can test the null hypothesis axy ⫽ 0. Ifaxy ⫽ 0 respectively. The statistical power and type I error rate are used as criteria to compare the relative performance of these is accepted, one can conclude that there is no significant
relationship between the gene-expression level X and trait three statistics in quantifying the correlation between gene-expression levels and trait values. Power refers to the probabil-valueY.
Simulation study:A series of simulations were carried out ity of declaring a statistical significance when a true correlation exists. Type I error rate is the probability of declaring that to examine the effects of different factors on the performance
of these two methods, in comparison with the FEXAT. To gene-expression levels are correlated with trait values when there is no relationship between them, i.e., axy ⫽ 0. More investigate the effects of sample sizes, we simulated three
sam-ples of 48, 96, and 192 subjects, respectively. The first sample detailed descriptions of these test statistics examined are pro-vided inmaterials and methods.
RESULTS and pedigree B, respectively. The type I error rate of
the FEXAT is 10.4% with a sample size of 16 ⫻ 12
The type I error rate and power estimates over 10,000
and heritabilities of 0.4 under the family structure of replicated simulations are summarized in Tables 1–3.
pedigree B. In contrast, the type I error rates of the LR All three methods are not sensitive to the correlation
and FEXAT(R) are reasonably robust to family struc-between the family-mean expression levels and trait
val-tures and their statistical powers vary to a lesser extent ues. That is, they are robust to population stratification
than that of the FEXAT. Taking into account both type (that can generate correlation between family-mean
ex-I error rate and statistical power, we present a summary
pression levels and trait values; Kraft et al. 2003) in
of the relative performance of the three methods under association analyses between gene-expression levels and
different situations in terms of sample sizes and family trait values. The estimated type I errors of the FEXAT(R)
structures in Table 4. Table 4 also provides a recommen-are slightly conservative and those of the LR recommen-are slightly
dation for choosing different statistics in practical data inflated. The type I errors of the FEXAT vary depending
analysis. This generalization is made under a prerequi-upon family structures (see below).
site of a large family size (e.g.,⬎12). If the family size
The heritabilities of the gene-expression levels and
is small, the FEXAT(R) is overconservative along with trait values have no significant effect on type I errors
having lower powers (Table 5). of the three methods. As expected, the statistical powers
Table 6 illustrates the results when a covariate had increase with increasing heritabilities for all three
meth-effects on both the gene-expression levels and trait val-ods. The LR statistic has higher power than the other
ues under study. Because both the LR and FEXAT(R) two methods in most cases.
accommodate covariate effects in the mean value struc-Comparisons of results in Tables 1–3 show that type
ture of the models, they can correctly estimate the re-I errors of the LR approach nominal levels with
increas-gression coefficient of the gene-expression levels and ing sample sizes. For example, when the sample size of
trait values on covariates. A comparison of Tables 2 and
sibships increases from 4⫻12 (4 sibships each with 12
6 shows that both the LR and FEXAT(R) yield nearly
sibs) to 16 ⫻ 12 (16 sibships each with 12 sibs) and
identical type I error rates and powers whether or not
heritability h2⫽ 0.4, the estimated type I errors of the
there are covariate effects. The statistic FEXAT per se
LR decrease from 12.7 to 5.3% and from 5.7 to 0.9%
cannot account for covariate effects. When adjusting
under the nominal significance levels of␣ ⫽0.05 and
gene-expression levels and trait values that can be
imple-␣ ⫽0.01, respectively. In contrast, the reverse tendency
mented in the standard regression analyses, the FEXAT
is observed for the FEXAT. When the sample size in- can also obtain similar powers to those when covariate
creases, the estimated type I errors of the FEXAT have effects are absent, however, with slightly inflated type I
a slight inflation especially when␣ ⫽0.01. As expected, error rates (Tables 2 and 6). The above results are
ob-the statistical powers increase as ob-the sample size in- tained from samples with large family sizes (Table 6).
creases for all of the three methods. If the family size is small, with the same total sample
Pedigree structure affects type I error rates and pow- size, the FEXAT has relatively larger inflated type I
er-ers (Tables 1–3). The FEXAT performs relatively unsat- rors (Table 5). In comparison, the LR and FEXAT(R)
isfactorily in multigeneration complex pedigree data. are reasonably robust to family size regardless of the
Compared with the results from the same sample size presence of covariate effects (Tables 2, 5, and 6).
and family size but with different family structures, the estimated powers of the FEXAT are much lower in
com-DISCUSSION
plex pedigrees than in sibships, and the difference is
more pronounced with large sample sizes. In addition, In microarray experiments, measures of
gene-expres-the type I errors of gene-expres-the FEXAT depart far above gene-expres-the sion levels are available for members of a set of families
nominal levels for those pedigrees with small sibships. (Shannonet al.2002;Schadtet al.2003). Thus,
stan-This is largely because (1) the FEXAT uses only the dard methods of quantitative genetics can be applied
data of sibships by breaking a large pedigree into multi- to the family-based microarray data analyses. This may
ple sibs and may lose information, while the FEXAT(R) facilitate exploration of the association of gene
expres-and LR use full data in pedigrees; expres-and (2) the FEXAT sions with multifactorial phenotypes of interest.
Family-does not consider the biological relationship (covari- based designs have the advantages of being robust to
ance due to polygene effects), while the FEXAT(R) and population stratification. Recently, Kraftet al.(2003)
LR methods accounted for the biological relationships proposed a stratified FEXAT to quantify the relationship
of family members. For example, with a sample size of between gene-expression levels and clinical traits.
Stimu-16⫻12 (16 pedigrees each with 12 members), heritabil- lated by their work, we presented a modified FEXAT
ities of 0.4 (for both gene expression levels and trait statistic and a bivariate analysis based on a
variance-values), and an expression-trait correlation of 0.7, the components approach for such experimental data
anal-estimated powers of the FEXAT are 89.7, 47.6, and yses.
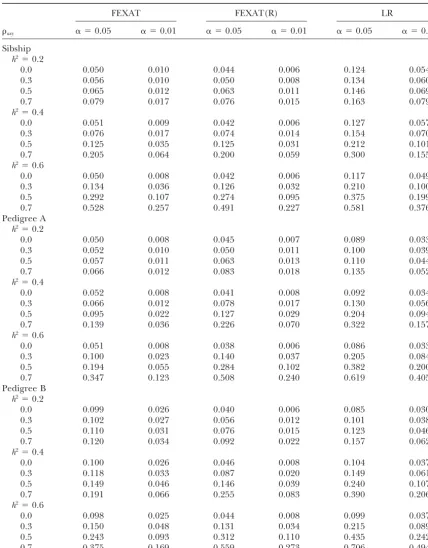
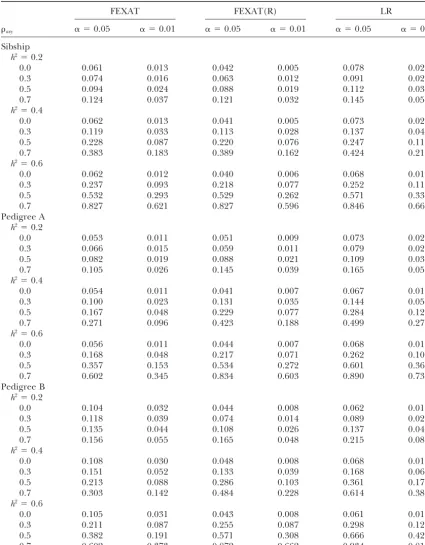
TABLE 1
Type I error rates and powers under different heritabilities (for both the gene expression levels and the trait values) with a sample size of 4⫻12
FEXAT FEXAT(R) LR
axy ␣ ⫽0.05 ␣ ⫽0.01 ␣ ⫽0.05 ␣ ⫽0.01 ␣ ⫽0.05 ␣ ⫽0.01
Sibship h2⫽0.2
0.0 0.050 0.010 0.044 0.006 0.124 0.054
0.3 0.056 0.010 0.050 0.008 0.134 0.060
0.5 0.065 0.012 0.063 0.011 0.146 0.069
0.7 0.079 0.017 0.076 0.015 0.163 0.079
h2⫽0.4
0.0 0.051 0.009 0.042 0.006 0.127 0.057
0.3 0.076 0.017 0.074 0.014 0.154 0.070
0.5 0.125 0.035 0.125 0.031 0.212 0.101
0.7 0.205 0.064 0.200 0.059 0.300 0.155
h2⫽0.6
0.0 0.050 0.008 0.042 0.006 0.117 0.049
0.3 0.134 0.036 0.126 0.032 0.210 0.100
0.5 0.292 0.107 0.274 0.095 0.375 0.199
0.7 0.528 0.257 0.491 0.227 0.581 0.376
Pedigree A h2⫽0.2
0.0 0.050 0.008 0.045 0.007 0.089 0.033
0.3 0.052 0.010 0.050 0.011 0.100 0.039
0.5 0.057 0.011 0.063 0.013 0.110 0.044
0.7 0.066 0.012 0.083 0.018 0.135 0.052
h2⫽0.4
0.0 0.052 0.008 0.041 0.008 0.092 0.034
0.3 0.066 0.012 0.078 0.017 0.130 0.056
0.5 0.095 0.022 0.127 0.029 0.204 0.094
0.7 0.139 0.036 0.226 0.070 0.322 0.157
h2⫽0.6
0.0 0.051 0.008 0.038 0.006 0.086 0.033
0.3 0.100 0.023 0.140 0.037 0.205 0.084
0.5 0.194 0.055 0.284 0.102 0.382 0.200
0.7 0.347 0.123 0.508 0.240 0.619 0.405
Pedigree B h2⫽0.2
0.0 0.099 0.026 0.040 0.006 0.085 0.030
0.3 0.102 0.027 0.056 0.012 0.101 0.038
0.5 0.110 0.031 0.076 0.015 0.123 0.046
0.7 0.120 0.034 0.092 0.022 0.157 0.062
h2⫽0.4
0.0 0.100 0.026 0.046 0.008 0.104 0.037
0.3 0.118 0.033 0.087 0.020 0.149 0.061
0.5 0.149 0.046 0.146 0.039 0.240 0.107
0.7 0.191 0.066 0.255 0.083 0.390 0.206
h2⫽0.6
0.0 0.098 0.025 0.044 0.008 0.099 0.037
0.3 0.150 0.048 0.131 0.034 0.215 0.089
0.5 0.243 0.093 0.312 0.110 0.435 0.242
0.7 0.375 0.169 0.559 0.273 0.706 0.494
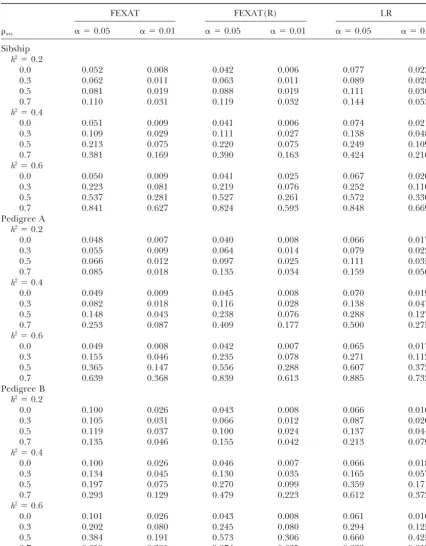
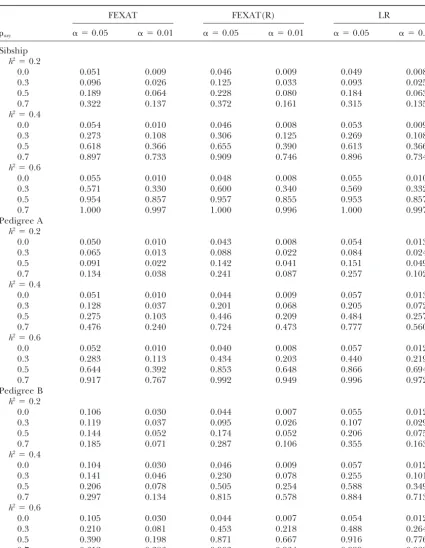
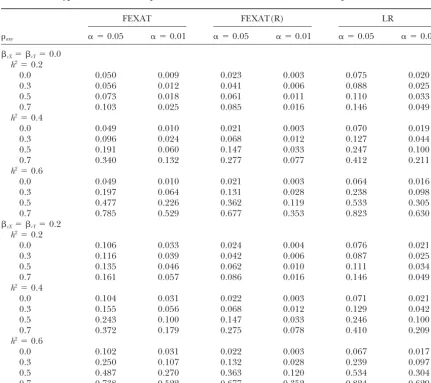
In Tables 1–3 and 5–7, whenaxy⫽0.0, which indicates no correlation between expression levels and trait values, the corresponding data are for type I error rates. When axy ⬆ 0.0, the corresponding data are for statistical powers.
I errors for the FEXAT were somewhat conservative to have slightly inflated type I errors, especially under
a large sample size. As indicated inKraftet al.(2003),
especially at stringent nominal levels in their
TABLE 2
Type I error rates and powers under different heritabilities with a sample size of 8⫻12
FEXAT FEXAT(R) LR
axy ␣ ⫽0.05 ␣ ⫽0.01 ␣ ⫽0.05 ␣ ⫽0.01 ␣ ⫽0.05 ␣ ⫽0.01
Sibship h2⫽0.2
0.0 0.052 0.008 0.042 0.006 0.077 0.023
0.3 0.062 0.011 0.063 0.011 0.089 0.028
0.5 0.081 0.019 0.088 0.019 0.111 0.036
0.7 0.110 0.031 0.119 0.032 0.144 0.053
h2⫽0.4
0.0 0.051 0.009 0.041 0.006 0.074 0.021
0.3 0.109 0.029 0.111 0.027 0.138 0.048
0.5 0.213 0.075 0.220 0.075 0.249 0.109
0.7 0.381 0.169 0.390 0.163 0.424 0.216
h2⫽0.6
0.0 0.050 0.009 0.041 0.025 0.067 0.020
0.3 0.223 0.081 0.219 0.076 0.252 0.110
0.5 0.537 0.281 0.527 0.261 0.572 0.330
0.7 0.841 0.627 0.824 0.593 0.848 0.669
Pedigree A h2⫽0.2
0.0 0.048 0.007 0.040 0.008 0.066 0.017
0.3 0.055 0.009 0.064 0.014 0.079 0.022
0.5 0.066 0.012 0.097 0.025 0.111 0.035
0.7 0.085 0.018 0.135 0.034 0.159 0.056
h2⫽0.4
0.0 0.049 0.009 0.045 0.008 0.070 0.019
0.3 0.082 0.018 0.116 0.028 0.138 0.047
0.5 0.148 0.043 0.238 0.076 0.288 0.127
0.7 0.253 0.087 0.409 0.177 0.500 0.275
h2⫽0.6
0.0 0.049 0.008 0.042 0.007 0.065 0.017
0.3 0.155 0.046 0.235 0.078 0.271 0.112
0.5 0.365 0.147 0.556 0.288 0.607 0.372
0.7 0.639 0.368 0.839 0.613 0.885 0.732
Pedigree B h2⫽0.2
0.0 0.100 0.026 0.043 0.008 0.066 0.016
0.3 0.105 0.031 0.066 0.012 0.087 0.026
0.5 0.119 0.037 0.100 0.024 0.137 0.044
0.7 0.135 0.046 0.155 0.042 0.213 0.079
h2⫽0.4
0.0 0.100 0.026 0.046 0.007 0.066 0.018
0.3 0.134 0.045 0.130 0.035 0.165 0.057
0.5 0.197 0.075 0.270 0.099 0.359 0.171
0.7 0.293 0.129 0.479 0.223 0.612 0.372
h2⫽0.6
0.0 0.101 0.026 0.043 0.008 0.061 0.016
0.3 0.202 0.080 0.245 0.080 0.294 0.125
0.5 0.384 0.191 0.573 0.306 0.660 0.425
0.7 0.619 0.381 0.874 0.665 0.932 0.812
than for small family sizes (seeKraftet al.2003, Tables families when simulating phenotypic data. In the study
ofKraftet al.(2003), data for family members (siblings) 1 and 2), but the reverse trend was observed in our
study (see Tables 2 and 4). This is presumably due to appeared to be drawn independently from a normal
distribution. Apparently, the former design is closer to different simulation designs between the two studies.
In this study, we took into account the biological rela- the nature of quantitative-trait inheritance (Lynchand
Walsh1998). It seems that the FEXAT is favored under tionship (covariances due to polygenes or shared
relation-TABLE 3
Type I error rates and powers under different heritabilities with a sample size of 16⫻12
FEXAT FEXAT(R) LR
axy ␣ ⫽0.05 ␣ ⫽0.01 ␣ ⫽0.05 ␣ ⫽0.01 ␣ ⫽0.05 ␣ ⫽0.01
Sibship h2⫽0.2
0.0 0.051 0.009 0.046 0.009 0.049 0.008
0.3 0.096 0.026 0.125 0.033 0.093 0.025
0.5 0.189 0.064 0.228 0.080 0.184 0.063
0.7 0.322 0.137 0.372 0.161 0.315 0.135
h2⫽0.4
0.0 0.054 0.010 0.046 0.008 0.053 0.009
0.3 0.273 0.108 0.306 0.125 0.269 0.108
0.5 0.618 0.366 0.655 0.390 0.613 0.366
0.7 0.897 0.733 0.909 0.746 0.896 0.734
h2⫽0.6
0.0 0.055 0.010 0.048 0.008 0.055 0.010
0.3 0.571 0.330 0.600 0.340 0.569 0.332
0.5 0.954 0.857 0.957 0.855 0.953 0.857
0.7 1.000 0.997 1.000 0.996 1.000 0.997
Pedigree A h2⫽0.2
0.0 0.050 0.010 0.043 0.008 0.054 0.013
0.3 0.065 0.013 0.088 0.022 0.084 0.024
0.5 0.091 0.022 0.142 0.041 0.151 0.049
0.7 0.134 0.038 0.241 0.087 0.257 0.102
h2⫽0.4
0.0 0.051 0.010 0.044 0.009 0.057 0.013
0.3 0.128 0.037 0.201 0.068 0.205 0.072
0.5 0.275 0.103 0.446 0.209 0.484 0.257
0.7 0.476 0.240 0.724 0.473 0.777 0.560
h2⫽0.6
0.0 0.052 0.010 0.040 0.008 0.057 0.012
0.3 0.283 0.113 0.434 0.203 0.440 0.219
0.5 0.644 0.392 0.853 0.648 0.866 0.694
0.7 0.917 0.767 0.992 0.949 0.996 0.972
Pedigree B h2⫽0.2
0.0 0.106 0.030 0.044 0.007 0.055 0.012
0.3 0.119 0.037 0.095 0.026 0.107 0.029
0.5 0.144 0.052 0.174 0.052 0.206 0.075
0.7 0.185 0.071 0.287 0.106 0.355 0.163
h2⫽0.4
0.0 0.104 0.030 0.046 0.009 0.057 0.012
0.3 0.141 0.046 0.230 0.078 0.255 0.101
0.5 0.206 0.078 0.505 0.254 0.588 0.349
0.7 0.297 0.134 0.815 0.578 0.884 0.713
h2⫽0.6
0.0 0.105 0.030 0.044 0.007 0.054 0.012
0.3 0.210 0.081 0.453 0.218 0.488 0.264
0.5 0.390 0.198 0.871 0.667 0.916 0.776
0.7 0.612 0.386 0.903 0.964 0.999 0.989
ships. Dividing extended pedigrees into multiple sib- yield spurious association results (Kraft et al. 2003).
The FEXAT(R) seems to be slightly conservative at the
ships, as suggested byKraftet al.(2003), and ignoring
covariances among family members greatly decrease the cost of a decrease in the powers, while the type I error
rates of the LR statistic are slightly higher than nominal statistical powers and inflate type I errors of the FEXAT
as shown in our simulations. levels especially with small sample size. The LR has
higher powers than the FEXAT and FEXAT(R) in most All three methods are robust to population
TABLE 4 statistics are the reverse for moderate to large sample sizes and/or pedigrees.
Summary of the performances of the three methods
It is known that maximum-likelihood estimates of the
under different situations
variance and covariance components may be biased
Sample Family when only a small number of observations are
consid-size structure Favorable method(s) ered (Hopper andMathews 1982;Amoset al. 1996).
As the sample size increases, the biases in
maximum-Small Sibship FEXAT and FEXAT(R)
likelihood estimates of variance and covariance
compo-Large Sibship FEXAT(R), FEXAT, and LR
Small Pedigree FEXAT(R) nents should be reduced; thus, the type I error rates of
Large Pedigree LR the LR statistic should approach their nominal levels
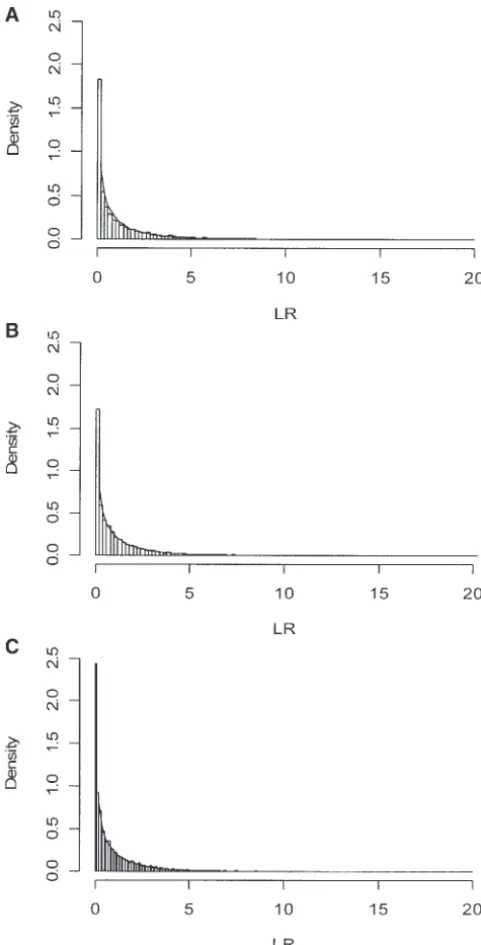
(Amoset al.1996) as reflected in our results for the LR method. We examined the empirical distribution of the LR statistic under the null hypothesis with different FEXAT(R) has the highest power. Both the LR and
sample sizes. We simulated 10,000 data sets using pedi-FEXAT(R) are favored by increasing sample sizes
re-gree A as described in Simulation study, and in each
gardless of the family structures. This is particularly
im-data set the LR statistic was calculated and shown in portant given that the decreasing costs of microarray
histograms (Figure 2). The LR statistic follows the chi-experiments make it practical for gene expression study
square distribution with 1 d.f. asymptotically. However, on a large scale in complex pedigrees. As shown in
this statistic has a slightly heavy tail under small sample
results, the FEXAT is preferable to the FEXAT(R) and
sizes. LR statistics under small sample sizes and for sibships,
while the performances and the preference of the three The methods proposed in this study can also be used
TABLE 5
Type I error rates and powers under different heritabilities with sibships 24⫻4
FEXAT FEXAT(R) LR
axy ␣ ⫽0.05 ␣ ⫽0.01 ␣ ⫽0.05 ␣ ⫽0.01 ␣ ⫽0.05 ␣ ⫽0.01
cX⫽ cY⫽0.0 h2⫽0.2
0.0 0.050 0.009 0.023 0.003 0.075 0.020
0.3 0.056 0.012 0.041 0.006 0.088 0.025
0.5 0.073 0.018 0.061 0.011 0.110 0.033
0.7 0.103 0.025 0.085 0.016 0.146 0.049
h2⫽0.4
0.0 0.049 0.010 0.021 0.003 0.070 0.019
0.3 0.096 0.024 0.068 0.012 0.127 0.044
0.5 0.191 0.060 0.147 0.033 0.247 0.100
0.7 0.340 0.132 0.277 0.077 0.412 0.211
h2⫽0.6
0.0 0.049 0.010 0.021 0.003 0.064 0.016
0.3 0.197 0.064 0.131 0.028 0.238 0.098
0.5 0.477 0.226 0.362 0.119 0.533 0.305
0.7 0.785 0.529 0.677 0.353 0.823 0.630
cX⫽ cY⫽0.2 h2⫽0.2
0.0 0.106 0.033 0.024 0.004 0.076 0.021
0.3 0.116 0.039 0.042 0.006 0.087 0.025
0.5 0.135 0.046 0.062 0.010 0.111 0.034
0.7 0.161 0.057 0.086 0.016 0.146 0.049
h2⫽0.4
0.0 0.104 0.031 0.022 0.003 0.071 0.021
0.3 0.155 0.056 0.068 0.012 0.129 0.042
0.5 0.243 0.100 0.147 0.033 0.246 0.100
0.7 0.372 0.179 0.275 0.078 0.410 0.209
h2⫽0.6
0.0 0.102 0.031 0.022 0.003 0.067 0.017
0.3 0.250 0.107 0.132 0.028 0.239 0.097
0.5 0.487 0.270 0.363 0.120 0.534 0.304
TABLE 6
Effects of covariates on type I error rates and powers with a sample size of 8⫻12
FEXAT FEXAT(R) LR
axy ␣ ⫽0.05 ␣ ⫽0.01 ␣ ⫽0.05 ␣ ⫽0.01 ␣ ⫽0.05 ␣ ⫽0.01
Sibship h2⫽0.2
0.0 0.061 0.013 0.042 0.005 0.078 0.024
0.3 0.074 0.016 0.063 0.012 0.091 0.026
0.5 0.094 0.024 0.088 0.019 0.112 0.035
0.7 0.124 0.037 0.121 0.032 0.145 0.054
h2⫽0.4
0.0 0.062 0.013 0.041 0.005 0.073 0.021
0.3 0.119 0.033 0.113 0.028 0.137 0.048
0.5 0.228 0.087 0.220 0.076 0.247 0.110
0.7 0.383 0.183 0.389 0.162 0.424 0.216
h2⫽0.6
0.0 0.062 0.012 0.040 0.006 0.068 0.019
0.3 0.237 0.093 0.218 0.077 0.252 0.111
0.5 0.532 0.293 0.529 0.262 0.571 0.331
0.7 0.827 0.621 0.827 0.596 0.846 0.665
Pedigree A h2⫽0.2
0.0 0.053 0.011 0.051 0.009 0.073 0.021
0.3 0.066 0.015 0.059 0.011 0.079 0.023
0.5 0.082 0.019 0.088 0.021 0.109 0.033
0.7 0.105 0.026 0.145 0.039 0.165 0.056
h2⫽0.4
0.0 0.054 0.011 0.041 0.007 0.067 0.017
0.3 0.100 0.023 0.131 0.035 0.144 0.050
0.5 0.167 0.048 0.229 0.077 0.284 0.127
0.7 0.271 0.096 0.423 0.188 0.499 0.277
h2⫽0.6
0.0 0.056 0.011 0.044 0.007 0.068 0.016
0.3 0.168 0.048 0.217 0.071 0.262 0.107
0.5 0.357 0.153 0.534 0.272 0.601 0.365
0.7 0.602 0.345 0.834 0.603 0.890 0.732
Pedigree B h2⫽0.2
0.0 0.104 0.032 0.044 0.008 0.062 0.015
0.3 0.118 0.039 0.074 0.014 0.089 0.024
0.5 0.135 0.044 0.108 0.026 0.137 0.046
0.7 0.156 0.055 0.165 0.048 0.215 0.080
h2⫽0.4
0.0 0.108 0.030 0.048 0.008 0.068 0.018
0.3 0.151 0.052 0.133 0.039 0.168 0.060
0.5 0.213 0.088 0.286 0.103 0.361 0.174
0.7 0.303 0.142 0.484 0.228 0.614 0.380
h2⫽0.6
0.0 0.105 0.031 0.043 0.008 0.061 0.015
0.3 0.211 0.087 0.255 0.087 0.298 0.127
0.5 0.382 0.191 0.571 0.308 0.666 0.429
0.7 0.602 0.373 0.872 0.662 0.934 0.817
cX⫽ cY⫽0.2;cXandcYdenote the regression coefficients of the gene-expression levels and trait values on a specific covariatec, respectively.
to characterize the genetic correlation between multiple expression and/or expression-expression association
studies. An initial data reduction to focus on those genes gene-expression levels. Pairwise analysis of multiple
gene expression profiles may provide a prediction of whose expressions varied nontrivially across samples is
necessary before the tests are performed. Additionally, joint expression and regulation of these genes. Due to
the high-dimensional gene-expression data from micro- systematic measurement errors may contribute to the
trait-TABLE 7
Comparison the performance of FEXAT(R) by chi-square and permutation procedures
Chi-square test Permutation test
axy ␣ ⫽0.05 ␣ ⫽0.01 ␣ ⫽0.05 ␣ ⫽0.01
0.0 0.045 0.008 0.051 0.010
0.3 0.116 0.028 0.139 0.042
0.5 0.238 0.076 0.290 0.125
0.7 0.409 0.177 0.521 0.296
h2⫽0.4, pedigree A with a sample size of 8⫻12.
ate normal distribution (Amoset al.1996). Permutation
tests can be performed in situations, particularly for small sample sizes, in which the violation of multivariate normality assumption is difficult to detect. Simulations showed that permutation tests warrant correct type I errors under violations of multivariate normality
as-sumption (Abecasis et al.2000). The procedure of
re-shuffling the original data is similar to that proposed byKraftet al.(2003). EmpiricalP-values can be com-puted by comparing the observed statistic with the per-muted statistics under the null hypothesis of no trait-expression association. We simulated 10,000 data sets using pedigree A and each data set was resampled 10,000
times to obtain the empiricalP-value of the FEXAT(R).
We found that the FEXAT(R) using a permutation test performs slightly better than that using a chi-square test (Table 7). However, the permutation test is computa-tionally demanding especially for gene-expression data. Typical microarray experiments aim at characterizing differential gene-expression patterns under distinct treatments. Quantifying trait-expression and/or expres-sion-expression associations at the population level may represent another growing trend toward high-through-put microarray data analyses. In the latter analysis, a large number of candidate genes for complex diseases can be reduced by restricting attention to genes whose
Figure2.—Histograms of the LR statistic for the data
pro-duced under the null hypothesis. Simulation was performed expression levels show associations with complex trait
under the null hypothesis as described inSimulation studyusing values. In the near future, remarkable advances in micro-pedigree A. (A) Sample size 4⫻12,h2⫽0.2, and
cX⫽ cY⫽
array technology may greatly decrease the experimental
0.0; (B) sample size 8⫻ 12,h2⫽ 0.2, and
cX ⫽ cY⫽0.0;
costs, making it practical to perform microarray
experi-and (C) sample size 16 ⫻ 12, h2 ⫽ 0.2, and 
cX ⫽ cY ⫽
ments in large sample sizes with large pedigrees. This
0.0. The histograms of the statistic are shown as bars. The
probability density function of the chi-square distribution with has been exemplified by the current burgeoning of
large-1 d.f. is shown as curves. scale whole-genome linkage scans for complex traits,
which were hampered by the prohibitory costs just about a decade ago. It is anticipated that the methods based on the variance-components approach that is advantageous which may lead to spurious association results. In a
under large sample sizes will be a good way to measure flexible variance-components framework, modeling such
quantitatively the relationship between gene expres-covariation as a covariance component in our analyses
sions and clinical traits in general pedigrees. The pro-is straightforward. Thpro-is may minimize bias in analyses.
gram for implementing the methods investigated here Variance-components methods make a critical
assump-is available, upon request, from Y.L. (yanlu@creighton. tion that the quantitative trait values within a family
Kerr, M. K., andG. A. Churchill, 2001 Statistical design and the This study was partially supported by grants from the Health Future
analysis of gene expression microarray data. Genet. Res.77:123– Foundation, the National Institutes of Health, and the State of
Ne-128. braska (LB595 and LB692). H.W.D. benefited by partial support from
Kraft, P., E. Schadt, J. AtenandS. Horvath, 2003 A family-based Hunan Province, Chinese National Science Foundation, Huo Ying
test for correlation between gene expression and trait values. Dong Education Foundation, the Cheng Kong scholar program, and Am. J. Hum. Genet.72:1323–1330.
the Ministry of Education of the People’s Republic of China. Lange, K., 1997 Mathematical and Statistical Methods for Genetic
Analy-sis. Springer-Verlag, New York.
Lange, K., andM. Boehnke, 1983 Extensions to pedigree analysis. IV. Covariance components models for multivariate traits. Am.
LITERATURE CITED J. Med. Genet.14:513–524.
Li, J., N. RischandR. M. Myers, 2003 Heritability of gene
expres-Abecasis, G. R., L. R. CardonandW. O. Cookson, 2000 A general
sion in humans: a study of lymphoblastoid cell lines from twins. test of association for quantitative traits in nuclear families. Am.
Am. J. Hum. Genet.73:S207. J. Hum. Genet.66:279–292.
Lynch, M., andB. Walsh, 1998 Genetics and Analysis of Quantitative
Amos, C. I., D. K. ZhuandE. Boerwinkle, 1996 Assessing genetic
Traits. Sinauer Associates, Sunderland, MA. linkage and association with robust components of variance
ap-Nguyen, D. V., A. B. Arpat, N. WangandR. J. Carroll, 2002 DNA proaches. Ann. Hum. Genet.60:143–160.
microarray experiments: biological and technological aspects.
Bakay, M., Y. W. Chen, R. Borup, P. Zhao, K. Nagarajuet al., 2002
Biometrics58:701–717. Sources of variability and effect of experimental approach on
Nogalska, A., andJ. Swierczynski, 2001 The age-related differ-expression profiling data interpretation. BMC Bioinformatics3:
ences in obese and fatty acid synthase gene expression in white 4.
adipose tissue of rat. Biochim. Biophys. Acta1533:73–80.
Brem, R. B., G. Yvert, R. ClintonandL. Kruglyak, 2002 Genetic
Roth, S. M., R. E. Ferrell, D. G. Peters, E. J. Metter, B. F. Hurleyet
dissection of transcriptional regulation in budding yeast. Science
al., 2002 Influence of age, sex, and strength training on human
296:752–755.
muscle gene expression determined by microarray. Physiol.
Ge-Chakravarti, A., 1999 Population genetics—making sense out of
nomics10:181–190. sequence. Nat. Genet.21:56–60.
Schadt, E. E., S. Monks, T. Drake, A. Lusis, N. Cheet al., 2003
Cheung, V. G., andR. S. Spielman, 2002 The genetics of variation
The genetics of gene expression surveyed in maize, mouse and in gene expression. Nat. Genet.32:522–525.
man. Nature422:297–302.
Deng, H. W., 2001 Population admixture may appear to mask,
Shannon, W. D., M. A. Watson, A. PerryandK. Rich, 2002 Mantel change or reverse genetic effects of genes underlying complex
statistics to correlate gene expression levels from microarrays traits. Genetics159:1319–1323.
with clinical covariates. Genet. Epidemiol.23:87–96.
Deng, H. W., F. H. Xu, Q. Y. Huang, H. Shen, H. Denget al., 2002
Wolfinger, R. D., G. Gibson, E. Wolfinger, L. Bennett, H.
Hama-A whole-genome linkage scan suggests several genomic regions
potentially containing quantitative trait loci for osteoporosis. J. dehet al., 2001 Assessing gene significance from cDNA micro-Clin. Endocrinol. Metab.87:5151–5159. array expression data via mixed models. J. Comput. Biol.8:625–
Gibson, G., 2003 Population genomics: celebrating individual ex- 637.
pression. Heredity90:1–2. Yang, Y. H., andT. Speed, 2002 Design issues for cDNA microarray
Hopper, J. L., andJ. D. Mathews, 1982 Extensions to multivariate experiments. Nat. Rev.3:579–588.
normal models for pedigree analysis. Ann. Hum. Genet.46:373– Yang, W. S., W. J. Lee, K. C. Huang, K. C. Lee, C. L. Chaoet al.,
383. 2003 mRNA levels of the insulin-signaling molecule SORBS1
Jin, W., R. M. Riley, R. D. Wolfinger, K. P. White, G. Passador- in the adipose depots of nondiabetic women. Obesity Res.11:
Gurgel et al., 2001 The contributions of sex, genotype and 586–590. age to transcriptional variance in Drosophila melanogaster. Nat.