A Study on the Financial Performance of
Select Plastic Companies in India with Special
Reference to EVA, MVA and SVA
Dr. E.Palanivel 1
Asst. Professor, Dept. of Commerce, K.C.S.Kasi Nadar College of Arts & Science, Chennai, Tamilnadu, India.
ABSTRACT: India is a favoured destination for overseas investors and offers the advantages of an open economy, increasing liberalization, a stable democratic political scenario, highly skilled work force with fluency in English. Various overseas players wish to explore the Indian market and invest in opportunities thrown open by the country. This increasing trend in foreign investments will leads to a healthy financial position of the various companies in India especially in plastic companies due to it was projected to be world number 3 in plastics consumption by 20101.The Indian plastics industry is slated to grow between 10% to 12%, in this decade. Consumption level, which is expected to reach 8 to 10 million tons. The Plast India Foundation expects business transactions worth $ 150 million per annum.This paper analyse the financial performance of EVA, MVA and SVA and also suggest suitable measures to improve plastic companies in india.
KEYWORDS: visual layout, plethora, versatile and cost effective
I.INTRODUCTION
The Petrochemical Department of the Government of India is in the process of setting up a development council to promote the development of downstream sectors in India. This clearly illustrates that the Government of India is quite positive and supportive to new investments in India. In fact, many foreign entrepreneurs have been able to set up 100% owned companies in India in the plastics processing and machinery industry sectors. Foreign equity participation in the petrochemical industry has been increased to a 51% stake (a majority stake). However, the polymer manufacturers and other downstream industries are free to set up projects 100% on their own equity.
FIGURE 1.1
USES OF PLASTIC PRODUCTS
II.REVIEW OF LITERATURE
DUBLIN, IRELAND (2007) The Portfolio Analysis - Automotive Plastic Moulders is a comprehensive evaluation of the UK market. The revised and updated 2007 edition analyses the financial performance of the companies important to the success of the business. Using the most up to date information available, the analysis is ideal both as a tool to benchmark the company's results and to study the market in more depth. Aimed at the busy manager, the Portfolio Analysis is both quick and easy to use thanks to the unique visual layout. The Analysis lays bare the performance of each company highlighting their strengths and weaknesses. Do you know which companies are best to do business with? Do you know which companies are selling at a loss and whose profit margins are plummeting? Find out the answers to all these questions and more with the newly published Portfolio Analysis7.
CRISIL report suggests HDPE to achieve 74% growth by 2012 with respect to 2005 figures. The corresponding figures for LDPE, LLDPE and PP are respectively 2 %, 75% and 141 %. Because, now-a-days plastic products has plays a vital role in part and partial of economic development of our country. This seems a very achievable position as since the past decade, the Indian plastics industry continues to grow at double digit figures. A plethora of queries plague the investor who wishes to tap the Indian market.
Few of these queries from overseas include: The raw material scenario: demand and supply
Plastics machinery sector : present technology levels and demand Finished products : Export potential
The major overseas players with base in India
Current consumption, projected growth of the Indian plastics industry
III. OBJECTIVES OF THE STUDY
The following are the objectives of the study.
1. To measure the operational efficiency, productivity and solvency of the select plastic companies in India through ratio analysis.
2. To evaluate the performance of the select plastic companies in India with reference to EVA, MVA and SVA.
3. To summarize the findings and offer suggestions to improve the performance of plastic companies in India.
IV.HYPOTHESES
The following hypotheses have been framed;
There exists significant difference in EVA, MVA and SVA among the plastic companies during the study period.
There is no significant difference in the mean operating profit among different companies during the study period.
V.DATA COLLECTION
VI. DATA ANALYSIS
TABLE 1.1
ECONOMIC VALUE ADDED (EVA)
COMPANIES MIN.VAL MAX.VAL MEAN SD C.V(%)
Acrysil Ltd -116.39 354.9 112.717 124.61 110.55
Cosmos -8811.94 3746.99 -2316.34 4032.92 -174.11
Fenoplast 116.14 718.82 368.806 210.84 57.17
Jumbo bag 114.29 262.33 189.725 56.69 29.88
Nilkamal Ltd -5478.31 944.04 -1828.16 2353.53 -128.74
Hitech 260.02 858.96 649.026 214.30 33.02
Sintex Industries -92462 -923.91 -30526.9 33720.53 -110.46
Supreme Industries Ltd
-103716 13519.19 -28891.2 36967.34 -127.95
Source: Computed from the Annual Reports
The mean EVA ranged from -30526.9 to 649.026 among the Companies and it is higher in C6 whereas it is least in C7 during the period of study. The Co-efficient of variation is least 29.88 % in C4, which indicates the consistent performance of EVA among companies during the period of study.
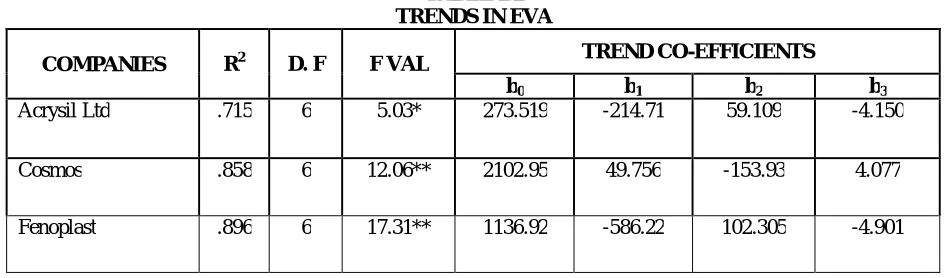
TREND ANALYSIS
To study the pattern of trend of the financial parameters during the study period, the polynomial trend equation namely, cubic trend equation of the form, Y= bo + b1 t + b2 t2 + b3 t3, where bi’s (i among the Deposits =1,2 &
3) are trend Co-efficients and bo = constant, is fitted, ti = ith year(i=1,2,…….,10) and the results are presented below.
The F-values indicate the overall significance of the trend equation fitted. The R2 the Co-efficient of determination indicates that to what extent the trend Co-efficients are able to explain the variations of the dependent variables under study.
TABLE 2.2 TRENDS IN EVA
COMPANIES R2 D. F F VAL TREND CO-EFFICIENTS
b0 b1 b2 b3
Acrysil Ltd .715 6 5.03* 273.519 -214.71 59.109 -4.150
Cosmos .858 6 12.06** 2102.95 49.756 -153.93 4.077
Jumbo bag .950 6 37.61** 213.69 -75.136 18.091 -1.015
Nilkamal Ltd .683 6 4.32 2496.22 -1510.7 212.544 -13.880
Hitech .907 6 19.54** -9.137 241.122 -19.950 0.331
Sintex Industries .971 6 67.06** -9440.8 7976.73 -1821.0 17.026
Supreme Industries Ltd
.772 6 6.75* -135541 59148.6 -7007.3 168.965
Source: Computed from the Annual Reports
*-Significant at 1 % level
The significant cubic trend equations forecast the performance of EVA in the future years.
ANOVA TABLE 2.3 GROSS PROFIT
SOURCE S S D F M S F
Between groups 480453.1 7 68636.15 12.06** Within groups 409607.5 72 5688.993
Source: Computed from the Annual Reports
** Significant at 1% level
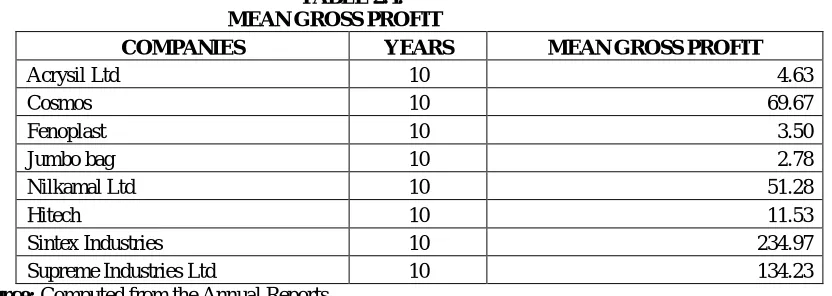
Since the F is significant the null hypothesis of no difference in the mean gross profit among the Companies is rejected and there is significant difference in the mean gross profit among the Companies. The mean gross profit among the Companies is furnished below:
TABLE 2.4. MEAN GROSS PROFIT
COMPANIES YEARS MEAN GROSS PROFIT
Acrysil Ltd 10 4.63
Cosmos 10 69.67
Fenoplast 10 3.50
Jumbo bag 10 2.78
Nilkamal Ltd 10 51.28
Hitech 10 11.53
Sintex Industries 10 234.97
Supreme Industries Ltd 10 134.23
Source: Computed from the Annual Reports
VII. FINDINGS
1. The mean EVA ranged from -30526.9 to 649.026 among the Companies and it is higher in C6 whereas it is least in C7 during the period of study.
2. The significant cubic trend equations forecast the company’s performance of EVA in the future years.
3. The mean MVA ranged from 8.682 to 105.55 among the Companies and it is higher in C8 whereas it is least in C6 during the period of study.
4. The significant cubic trend equations forecast the company’s performance of MVA in the future years. 5. The mean SVA ranged from -25.044 to 203.773 among the Companies and it is higher in C7 whereas it is
least in C1 during the period of study.
6. The significant cubic trend equations forecast the company’s performance of SVA in the future years.
7. The mean Earnings per share ratio ranged from 5.25 to 14.33 among the Companies and it is higher in Jumbo bag whereas it is least in Cosmo during the period of study.
8. The mean price to book value ratio ranged from 0.46 to 2.22 among the Companies and it is higher in Hitech whereas it is least in Fenoplast during the period of study.
9. The mean price to cash EPS ratio ranged from 2.34 to 8.91 among the Companies and it is higher in Sintex industries whereas it is least in Cosmo during the period of study.
10. The mean EV/EBIDTA ratio ranged from 3.89 to 8.21 among the Companies and it is higher in Sintex industries whereas it is least in Cosmo during the period of study.
11. There is significant difference in the mean net sales among the Companies. And the mean net sales ranged between Rs.26.82 cr and Rs. 1244.24 cr and it is higher in Supreme industries Ltd. than in other companies and stood at top whereas it is least in Acrysil Ltd. and stood at last.
VIII.SUGGESTIONS
The following are the suggestions provided by the researcher;
1. The Debt -Equity Ratio is an important tool of financial analysis to appraise the financial structure. The D/E Ratio of Acrysil Ltd. showed highest co-efficient of variation indicating the inconsistent performance. It implies low safety margin for the creditors and it is suggested that the company should strain every nerve to improve its co-efficient variation of debt equity ratio.
2. Inventory Turnover Ratio indicates the number of times the inventory is replaced during the year. The study revealed that out of the eight companies selected, the Supreme Industries Ltd. showed highest Co-efficient of variation indicating the inconsistent performance in the Inventory Turnover Ratio. It implies that the anticipated or targeted turnover has not been achieved. The company should undertake to improve its sales not only through improved quality of existing products and with new products but also through effective marketing methods.
3. The Interest Coverage Ratio is an important ratio from the lenders’ point of view. It indicates whether the business would earn sufficient profits to pay periodically the interest charges. The Supreme Industries Ltd. showed highest Co-efficient of variation indicating the inconsistent performance in covering the interest charges for its creditors. However, a high ratio may imply unused debt. Therefore, the company has two options; either the company should use the unused debt selectively and efficiently or settle it as early as possible.
IX.CONCLUSION
energy efficient, easy to process, more versatile and above all 'cost effective'. In addition to computing, no other industry has grown as rapidly as plastics. From now, it is clear that plastics will continue to be a growing industry, boosting prospects for fresh investments in plastic industry in India.
REFERENCES
1. Indian Plastic Industry Report 2011
2. India's plastics industry report New Delhi, Sep 13, 2011
3. Dublin, ‘Edition Analyses the Financial Performance of the Companies Important to the Success of Your Business’ Research and Markets,
[email protected] 2007.
4. Plimsoll Publishing Ltd., ‘The Russian Plastic Packaging Manufacturers Industry Report’ March 2012, Page: 331
5. Spi Plastic Industry Trade Association, 2009 North American Plastics Industry SPI Special Report, Plastic Industry e-store, March 28, 2012
6. Business Line, ‘UAE to Host 2 major plastic Industry’, Dubai, January,2012
7. Economic Times, Plastic industry needs facilitative policy regime for growth, TNN Dec 28, 2007, 12.05am IST
8. Plsimsoll Publishing Ltd., ‘The Global Plastic Pipe Manufacturers Industry Report ’ NEW YORK, May 19, 2011 /PRNewswire/ --
Reportlinker.com
9. Plimsoll Publishing Ltd, The Global Plastic Film & Sheet Manufacturers Industry Report, January 1, 2012.