ABSTRACT
SHARKEY, LUCAS JOHN. The Performance of Bioretention Areas in North Carolina: A Study of Water Quality, Water Quantity, and Soil Media. (Under direction of William F. Hunt III.)
Flooding, stream bank erosion, and closures of fisheries have led to increased regulation and the use of Best Management Practices (BMPs) for stormwater management. Stormwater BMPs, such as bioretention areas, are popular among developers because they fulfill both landscape and water quality needs; however, questions on design persist. A total of four bioretention areas were studied in central North Carolina investigating phosphorus (P) and nitrogen (N) removal, soil media, volume reduction, and the effectiveness of including an internal storage (IS) zone. A laboratory study investigated the affect of altering soil test-P, or P-Index, of typical bioretention soil media on phosphate (PO ) outflow concentrations. 4
Two cells in Greensboro, NC, were continuously monitored for hydrology and water quality from July, 2003, to September, 2004. Both cells were 5% of their 0.202 ha (0.5 ac.) watersheds and contained nominally 1.2 m (48 in.) of fill media underlain by a 15 cm (6 in.) drainage layer of crushed stone. One cell (G-1) contained an IS zone of 0.45 m (18 in.), and the other cell (G-2) was left conventionally drained. The sites were studied to determine the affect of an IS zone on hydrology, concentration reduction, and load reduction.
Although lower outflow frequency was found for G-1, and a greater delay of peak flow was experienced, no significant difference (p > 0.05) in outflow was prevalent. G-1 and G-2 reduced total inflow volume by 51% and 48% respectively. The cells treated
containing a high P-Index fill soil between 86 and 100, increased total phosphorus (TP) load by 39%; whereas, G-1, containing a medium P-Index fill soil between 25 and 50, reduced TP load by 16%. Total phosphorus concentrations leaving G-1 were significantly lower (p = 0.002) than G-2. The TP outflow concentrations were correlated to the soil test-P, and P-Index, of the fill soil. Median nitrate (NO ) concentrations were reduced 78% by G-1 and 35% by G-2; however, total kjeldahl nitrogen (TKN) and ammonium (NH ) concentrations were increased dramatically by both cells. TN was not significantly different (p = 0.38) between the two cells, leading to similar TN load reductions of 43% and 38%, removing 1.86 kg (4.1 lbs) and 1.77 kg (3.9 lbs) for the conventional and IS cells respectively..
3
4
Two additional cells constructed with conventional drainage in Louisburg, NC, were monitored for hydrology and water quality from May, 2004, to December, 2004. One cell (L-2) was lined with plastic and the other (L-1) was left un-lined. Both were approximately 4.5% of their watersheds and filled with identical, non-agricultural soils containing a low P-Index (1 to 2), to a media depth of 0.75 m (30 in.). Mean TP and TN concentration reduction for 14 storms measured were 33% and 30% respectively for L-1, and 47% and negative 60% respectively for L-2. Furthermore, L-2 reduced NO concentration by 60%; whereas, for L-1 it was only reduced by 14%. The differences between the cells were attributed to L-2 going anaerobic, increasing N reduction, and a low inflow TP concentration entering L-2 producing a misleading increase in TP concentration. Respectively, L-1 and L-2 reduced TN load by 65% and 58%; whereas, TP load was reduced by 69% and 10%. The high percent reduction by L-1 was attributable to the low P content within the fill soil; whereas, L-2 received a lower TP concentration and was saturated, therefore unable to reduce TP at a high rate.
3
the total inflow volume was lost to ET. Given the cells were placed side-by-side, the ET rate from L-2 was used to estimate groundwater recharge for L-1, which amounted to 8% of total inflow to L-1 leaving to groundwater. Volume reduction was significantly different (p = 0.004) between the two cells in Louisburg, confirming that a considerable portion of water was lost to groundwater even though it was placed within a tight clay in-situ soil [saturated hydraulic conductivity 0.1 – 1.2 cm/hr (0.04 - 0.47 in./hr)]. L-1 treated 77% of inflow; whereas, L-2 treated 89% of inflow.
The laboratory study compared three soil textures, (A) approximately 90% sand, (B) approximately 85% sand, and (C) approximately 75% sand. Four replicates of each were raised to four PIndex levels ranging between 3 and 120. A concentration of 0.18 mg PO -P/L was applied weekly for ten weeks at a rate of 0.5 L per week to all 48 replicates and was compared to outflow concentrations. Determined by the laboratory study, P-Index had a significant (p = 0.001) effect on outflow concentrations, which increased as P-Index was increased for all three soil textures. Soil texture also had a significant (p = 0.001) effect on outflow concentrations, which increased as percent sand increased.
4
Given the findings from the laboratory and field studies, a low to medium P-Index fill soil (less than 25) is suggested for use in bioretention areas if no concentration increase in phosphorus, and more specifically PO , is desired. Soil textures ranging between 76% sand and 84% sand are suggested to retain the greatest mass of phosphorus, and to provide a hydraulic conductivity which induces nitrogen removal.
THE PERFORMANCE OF BIORETENTION AREAS IN NORTH CAROLINA: A STUDY OF WATER QUALITY, WATER QUANTITY, AND SOIL MEDIA
by
LUCAS JOHN SHARKEY
A thesis submitted to the Graduate Faculty of North Carolina State University
in partial fulfillment of the requirements for the Degree of
Master of Science
BIOLOGICAL AND AGRICULTURAL ENGINEERING
Raleigh 2006
APPROVED BY:
__________________________________ Deanna L. Osmond
Department of Soil Science North Carolina State University
__________________________________ Robert O. Evans
Department of Biological and Agricultural Engineering North Carolina State University
________________________________
William F. Hunt III
Chair of Advisory Committee
BIOGRAPHY
Lucas J. Sharkey was born on April 9, 1976, by John and Denise Sharkey. As a young child growing up in the suburbs of Los Angeles, he was exposed to a dense urban atmosphere and spent many after-noons fascinated by the concrete lined canals and coastal estuaries of southern California. This was later transferred to outdoor activities such as kayaking in eastern North Carolina estuaries and rivers, surfing the Atlantic coast in N.C., and especially his interest and dedication to hydrology and stormwater.
During college, at N.C. State University, Lucas was active in several student organizations and was able to make the Dean’s List regularly. He filled several elected positions of the Lorax Environmental Group including president, in 1998, and the Chair and Co-chair of the Rocky Branch Streamkeepers from 1997 through 1999. He was also
dedicated to the American Water Resources Association Student Chapter and eventually held officer positions.
After receiving a Bachelor of Science degree in Environmental Science in 1999, Lucas enrolled in the Peace Corps in Paraguay, South America. While in the Peace Corps as an Agroforestry Extensionist, he was able to touch the lives of many rural farmers by
offering technological advances not previously used. The two year commitment in Paraguay was followed by a two month journey accompanied by two good friends through four other countries in South America. Upon his return two and a half years later, scares of terrorism and a damaged U.S. economy left the job market slow. Lucas decided to undertake this research project under direction of Bill Hunt with the Department of Biological and
ACKNOWLEDGEMENTS
The author would like to acknowledge all those who assisted in completing research provided in this thesis. He would especially like to thank his mentor and major advisor, Dr. Bill Hunt, with the Department of Biological and Agricultural Engineering at N.C. State for giving the opportunity to complete this research, and never giving up. Without Dr. Hunt’s continued support with technical expertise and constant assistance during the research and development of this thesis, it would not have been possible.
Robert Evans, with the B.A.E. department, and Deanna Osmond, with the Soil Sciences department at NC State, were essential in making this a meaningful thesis and a meaningful experience. Staff and students in the B.A.E. department also provided invaluable support. Jonathan T. Smith, an extension engineer, was a principal player in monitoring and sampling design, instrumentation, construction, and moral support. Bill Lord with the North Carolina Cooperative Extension in Franklin County, NC, supplied a diversity of desired skills. He was a key role in the Louisburg bioretention areas including securing a perfect project site, setting up, and helping to build, and help with sample collection. Lord’s coordination with the team from the Town of Louisburg (C.L. Gobble and Brent Cardwell), helped put the practice in the ground. L.T. Woodlief and several of the Department’s graduate students were vital in construction and laboratory work. Without their support and encouragement, getting through would have been impossible.
city of Greensboro provided valuable assistance in installing and monitoring the bioretention cells in Greensboro, NC. Funding by the EPA and North Carolina Department of
Environment and Natural Resources 319(h) grant, and that from the North Carolina Cooperative Extension at NC State.
TABLE OF CONTENTS
LIST OF TABLES ... vii
LIST OF FIGURES ... ix
CHAPTER I: INTRODUCTION ...1
CHAPTER II: LITERATURE REVIEW...3
IMPACT OF DEVELOPMENT ON THE NATURAL HYDROLOGIC CYCLE...3
Changes to Hydrology ...3
Sources of Pollution...4
Effects of Pollution...4
Pollutants Associated With Stormwater...6
PREVENTATIVE MEASURES...6
Stormwater Regulations and Policies ...6
Stormwater Best Management Practices ...8
BIORETENTION AS A STORMWATER DEVICE...10
Bioretention Function ...11
Current Bioretention Design...14
Previous Research ...16
State of the Art ...20
CHAPTER III: RESEARCH GOALS AND HYPOTHESES...21
PERTINENT QUESTIONS...21
PROPOSED HYPOTHESES...22
RESEARCH GOALS...22
CHAPTER IV: METHODS AND PROCEDURES ...24
FIELD STUDY...24
Site Descriptions ...25
Greensboro Site – Investigation of Internal Storage and P-Index ... 25
Louisburg Site – Hydrology and Fill Media... 27
Monitoring Procedures...30
Sampling and Data Storage... 31
Water Balance Methods Specific to Louisburg... 33
Comparison of Conventional vs. Internal Storage Design ... 36
LABORATORY STUDY –INVESTIGATION OF P-INDEX...37
Soils...37
Raising the P-Index... 38
Soil Preparation and Assembly of Replicate Boxes ... 39
Simulated Runoff...42
Phosphorus Concentrations in Runoff... 42
Application Load and Volume ... 43
Solution Mixing, Application, and Sampling of Effluent... 44
CHAPTER V: RESULTS AND DISCUSSION ...46
GREENSBORO SITE – INVESTIGATION OF INTERNAL STORAGE...46
Hydrologic Results...46
Estimation of Bypass ... 47
Volume Reduction ... 48
Peak Flow Reduction and Delay ... 53
Seasonal Variation ... 56
Potential Sources of Error ... 57
Water Quality Results ...59
Phosphorus... 62
Addition of Internal Storage Zone... 64
Load Reduction... 66
Seasonality ... 69
LOUISBURG SITE – HYDROLOGY AND FILL MEDIA...71
Hydrologic Results...71
Volume of Bypass... 71
Volume Reduction and Water Balance ... 73
Difficulties Encountered ... 77
Water Quality Results ...78
Concentration Data ... 79
Pollutant Load Data ... 84
EFFECT OF PHOSPHORUS IN FILL MEDIA...89
Laboratory Study Results ...89
Outflow P Concentration in Relation to Soil Media P-Index...92
CHAPTER VI: CONCLUSIONS AND RECOMMENDATIONS ...95
DESIGN RECOMMENDATIONS...99
RECOMMENDATIONS FOR FURTHER RESEARCH...100
REFERENCES...102
APPENDICES ...106
APPENDIX A: GREENSBORO HYDROLOGY DATA...107
APPENDIX B: GREENSBORO WATER QUALITY DATA...117
APPENDIX C: LOUISBURG HYDROLOGY DATA...141
APPENDIX D: LOUISBURG WATER QUALITY DATA ...149
LIST OF TABLES
Table 4.1. Summary of inflow and outflow sampling and monitoring equipment used at each
bioretention area…..……….32
Table 4.2. Source soils and quantities needed to result in the desired textures for soils A, B, and C. ... 37
Table 4.3. Resulting quantities of “P to add.”... 39
Table 4.4. Total mass of P2O5 added to each five replicate batch for three soil textures.…..39
Table 4.5. Phosphorus concentrations in runoff used for synthetic rainfall in laboratory study ... 42
Table 4.6. Load of P added to each replicate by synthetic rainfall... 43
Table 4.7. Actual load and volume of solution applied to each replicate... 44
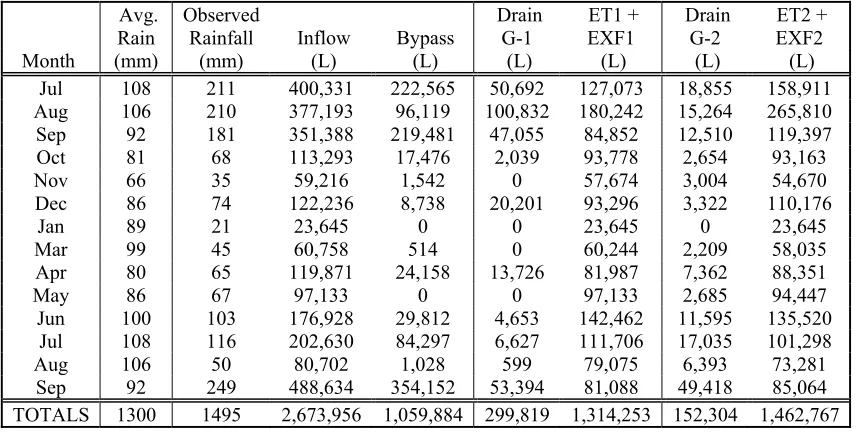
Table 5.1. Volume reduction including estimation of overflow for each cell over the entire study period (14 months, excluding February)... 48
Table 5.2. Summary of the monthly water balance for both cells in Greensboro, NC. (Jul, 2003 through Sep, 2004)... 49
Table 5.3. Volume summary of four events in June and July, 2004... 53
Table 5.4. Inflow and total outflows including estimated bypass for two cells in Greensboro starting July, 2003... 57
Table 5.5. List of inflow concentrations and t-test results from Greensboro, NC for both cells. ... 60
Table 5.6. Median concentrations for all samples taken Jul, 2003 through Sep, 2004... 61
Table 5.7. Median concentrations for all samples taken Jul, 2003, through Sep, 2004... 63
Table 5.8. Summary of outflow concentration data in mg/L and t-tests... 65
Table 5.9 Calculation of inflow and outflow loads for NO3 for Cell G-1. . ... 67
Table 5.10. Summary of total loads, estimated annual load, and percent reduction for each pollutant studied... 69
Table 5.12. Events where bypass occurred and calculation of bypass volume in inches.. .... 73
Table 5.13a. Monthly summary of water balance for L-1. ... 74
Table 5.13b. Monthly summary of water balance for L-2... 74
Table 5.14. Totals summary of water balance (June 15 –Dec, 2004)... 76
Table 5.15. Mean concentrations in Louisburg from thirteen inflow and fourteen outflow events from May to December, 2004... 79
Table 5.16. Comparison of twelve inflow concentrations to twelve outflow concentrations for L-1 using a paired T-test. . ... 82
Table 5.17. Comparison of twelve inflow concentrations to twelve outflow concentrations for L-2 using a paired T-test. . ... 83
Table 5.18. Summary of loads experienced for cell L-1 in Louisburg. ... 87
Table 5.19. Summary of loads experienced in cell L-2 in Louisburg. ... 87
Table 5.20. Resulting soil textures and P-Index levels used in lab study... 89
Table 5.21. Mean outflow PO4 concentrations experienced for three soil textures at four P-Index levels. ... 91
LIST OF FIGURES
Figure 2.1. Plan view of a typical bioretention area. ... 11
Figure 2.2. Standard cross section of a conventional bioretention area. ... 12
Figure 2.3. Design with internal storage zone (Hunt et al., 2003). ... 16
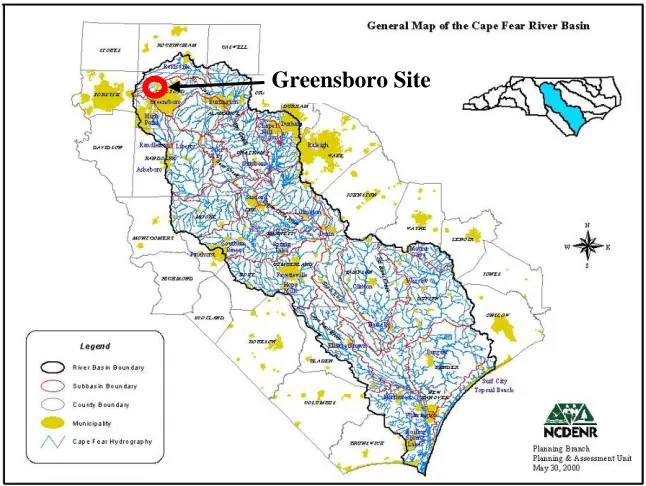
Figure 4.1. Location of Site 1. Cape Fear River Basin, North Carolina... 24
Figure 4.2. Location of site 2, Tar-Pamlico River Basin, North Carolina... 25
Figure 4.3. (a) Internal storage cell (G-1) and (b) conventional Cell (G-2) Spring 2003... 26
Figure 4.4. Plan sheet locating two bioretention areas in Greensboro... 26
Figure 4.5. Plan sheet of bioretention areas and contributing watersheds at Joyner Park, Louisburg, NC... 28
Figure 4.6. Photo showing watershed of Louisburg bioretention (L-1) ... 28
Figure 4.7. (a)L-1 and (b) L-2 Louisburg, NC. (Nov. 2003) ... 29
Figure 4.8. Design of lined bioretention cell in Louisburg, N.C. . ... 30
Figure 4.9. (a) Inflow sampling trough at edge of parking lot. (b) Outflow weir box attached to underdrain. ... 33
Figure 4.10. (a) Bypass grate for L-1, and (b) and bypass spillway for L-2... 34
Figure 4.11. Diagram of water table within both cells after a rainfall event. ... 35
Figure 4.12. (a) Final setup of laboratory study showing soil boxes, stands, (b) synthetic rainfall application, and sample collection containers... 41
Figure 4.13. Empty soil tray with screen over outlet... 42
Figure 5.1. Monthly rainfall and outflow volumes leaving cells G-1 and G-2 through underdrains and bypass... 51
Figure 5.2. Level of flow at the outlet of two cells in Greensboro comparing different inter-event dry periods for the months of (a) July, 2004, and (b) June, 2004. ... 52
Figure 5.3. Rainfall and underdrain flow intensity for both cells in Greensboro.. ... 54
Figure 5.5. TN concentrations in outflow from both cells in Greensboro. ... 61 Figure 5.6. TP concentrations in outflow leaving both cells in Greensboro... 64 Figure 5.7. Monthly rainfall, volume entering soil, and underdrain flow at Louisburg, NC, 2004... 75 Figure 5.8. Cumulative mm of rainfall and underdrain outflow for both cells at Louisburg. 75 Figure 5.9. TKN load calculation for Louisburg cell L-1. ... 86 Figure 5.10. Outflow concentrations for three lab soils at P-Index of 25... 90 Figure 5.11. Relationship of percent sand outflow concentration for three P-Index levels... 91 Figure 5.12. Curvilinear trend lines fit to soils B and C, with overlay of P-Index leading to no increase in outflow concentration. ... 92 Figure 5.13. Mean outflow PO4 concentration for field studies and non-linear trend lines fit
CHAPTER I: INTRODUCTION
Rapid development in the past few decades has increased the amount of impervious surfaces and increased stormwater runoff and surface water pollution. Rainfall-borne
pollutants and those collected when rainfall flows over hardened surfaces are carried directly to rivers, lakes, estuaries, and other coastal water bodies. Stormwater flows scour stream channels and cause downstream flooding, often resulting in the loss of habitat for aquatic life. The rapid transport of runoff allows little time for natural water treatment and limits recharge of groundwater aquifers.
Studies have shown high levels of heavy metals, nitrogen, and phosphorus concentrations in urban stormwater (Barrett et al. 1998, Wu et al. 1998). Continued contamination of coastal fisheries and the discovery of toxic Pfiesteria, a fish-killing organism found in nutrient-laden estuarine waters, have raised awareness of the nutrients delivered to water bodies by stormwater (Burkholder, 2001).
The Clean Water Act of 1972, and recent revisions to it, the EPA’s National Pollutant Discharge Elimination System (NPDES), are federal regulations that address surface water treatment and protection. Phase I and Phase II of the NPDES directly addressed non-point source pollution. Under NPDES Phases I and II, operators of municipal separate storm sewer systems (MS4’s) must implement stormwater programs that reduce pollutants in
Waters, requiring local governments to regulate N quantities exported to water bodies (NCDENR, 2004).
Stormwater best management practices (BMPs), have been developed as minimum control measures to control stormwater under these programs. The “National Menu of Best Management Practices for Stormwater: Phase II” (EPA, 2000b), along with state publications (NCDENR, 1999) were published to aid designers in selecting BMPs for MS4 operators. Some examples of BMPs include stormwater wetlands, permeable pavement, wet detention ponds, infiltration trenches, grassy swales, greenroofs, and bioretention.
Bioretention is generally a depression where stomwater is directed, stored for a short period of time and treated by physical, chemical and biological functions. Because
bioretention can be sited within current landscape ordinances and has shown to reduce pollutants (Davis et al. 2001, Kim et al. 2003, and Hunt et al. 2003), it has widespread adoption in North Carolina and much of the East Coast. In the town of Cary, NC more than twenty bioretention areas have been built since 1998 (Pearce, 2005).
CHAPTER II: LITERATURE REVIEW
IMPACT OF DEVELOPMENT ON THE NATURAL HYDROLOGIC CYCLE
Urbanization has replaced natural landscapes once covered by vegetated surfaces and permeable soils with anthropogenic surfaces such as rooftops, parking lots, driveways, roads, and walkways. Pitt et al. (1999) found that urban activities significantly compact soils. The infiltration rates of sandy soils were reduced from 33 cm/hr (13 in/hr) to 3.6 cm/hr (1.4 in/hr) after compaction. Reduced infiltration was attributed to (1) removal of topsoil, containing mature, deep rooted plants, (2) exposure of a deeper, non-infiltrating subsoil, and (3) compaction during earthmoving and construction.
Compacted soils greatly limit infiltration, resulting in the bypass of natural chemical and biological processes; moreover, pollutants are washed from the hardened surfaces directly into receiving waters. Rainfall in urbanized areas is converted into stormwater runoff associated with higher flow rates, higher volume, and increased pollution. In North Carolina and other states, non-point source pollution, such as stormwater runoff, has been recognized as an important source of water quality problems (Mallin 2000, Rose 2001, and Bay 2003).
Changes to Hydrology
and loss of habitat have also resulted (Hammer, 1972). Trimble found that 67% of sediment production in San Diego Creek, CA, with a 50% impervious watershed, resulted from stream bank erosion (1997). Disturbed surfaces increase runoff volume, reducing the amount of infiltration and evapotranspiration. As studied by Smakhtin (2001), the lack of infiltration limits aquifer recharge.
Sources of Pollution
Paerl (1993) found the combustion of fossil fuels to be the largest anthropogenic source of N emitted to the atmosphere. Wu et al. (1998) found in a study of highway runoff in Charlotte, NC that 10-30% of NO3-N and TP, 30-50% of OP, and 70-90% of TKN and
NH3 were attributable to wet and dry deposition, or bulk precipitation. Davis et al. (2001)
found cadmium (Cd), copper (Cu), and lead (Pb) to also be largely supplied by the
atmosphere. Other heavy metals such as zinc (Zn) and Cu were also attributed to brake wear, siding of houses, and roof tops. Other pollutants attributable to impervious surfaces are oil and grease from vehicle wear, bacteria from animal excrement, increased temperature from hot paved surfaces, hydrocarbons from gasoline and fuels, and sediments shed by tires and bare soil among other things (US EPA, 2000).
Effects of Pollution
noticed, beach closings and fish kills are still occurring in coastal waters such as the southern west coast and within the Pamlico Sound of NC.
A study by Bay et al. (2003) compared plumes at the mouths of two rivers leaving two distinctly different watersheds in the Santa Monica bay. The 83% developed watershed produced toxic levels in all samples after rainfall events; where as, the 4% developed
watershed did for only a few samples. Dwight et al. (2002) found twenty of twenty-two beaches in Orange County, California, to have bacterial contamination related to river discharge. The study concluded that contamination brought by stormwater poses potential health threats and impacts on tourism in coastal regions.
Although North Carolina has also experienced bacterial contamination of its waters, of most concern are the effects due to large quantities of nutrients. The coastal estuaries and rivers are highly vulnerable to eutrophication (Mallin et al., 2000). Mallin et al. (1999) stated that after passage of a major storm, the Cape Fear River can experience up to 90% declines in species abundances of coastal benthic macroinvertebrates. A very strong correlation was found between the percent imperviousness, turbidity, and bacteria within estuaries (Mallin et al., 2000). In many cases, stormwater directly enters sensitive
shellfisheries without any pre-treatment. The high siltation, high suspended particle loads, and disease associated with stormwater are primary causes to negative affects on
Pollutants Associated With Stormwater
Numerous studies have shown high levels of heavy metals such as Zn, Cu, Cd, and Pb, and increased N, and P concentrations in urban stormwater (Barrett et al. 1998, Wu et al. 1996 and 1998, Sansalone and Buchburger 1997, Davis et al. 2001, Hunt 2003). In North Carolina, N and P have been targeted by regulations due to impacted water bodies such as the Neuse and Tar-Pamlico river basins (NCDENR, 2004).
One of the few North Carolina studies on stormwater concentrations and annual loads is that published by. In a year long study on highway runoff near the city of Charlotte, (Wu et al. (1998) found event mean concentration (EMC) values for several pollutants.
Orthophosphate (OP) concentrations ranged from 0.15 mg/L to 0.3 mg/L; whereas, TP ranged from 0.43 mg/L to 0.52 mg/L. Total kjeldahl nitrogen (TKN) ranged from 1.00 mg-N/L to 1.42 mg-mg-N/L, and ammonium (NH4) ranged from 0.52 mg-N/L to 0.83 mg-N/L.
Mass loadings were also calculated and ranged from 11.3 kg/ha-yr to 35 kg/ha-yr for TN and 3.5 kg/ha-yr to 9.1 kg/ha-yr for TP.
PREVENTATIVE MEASURES
Stormwater Regulations and Policies
“satisfy the appropriate water quality requirements of the Clean Water Act” (U.S. EPA, 2000). This includes the use of six minimum control measures to reduce and protect water quality:
(1) public education and outreach, (2) public participation and involvement, (3) illicit discharge detection and elimination, (4) construction site runoff control,
(5) post construction runoff control, and
(6) pollution prevention and good housekeeping.
The measure most applicable to this research is that stated in the EPA Fact Sheet 2.7 (U.S. EPA, 2000a) as “Post-Construction Runoff Control”, or those areas of new and
re-development, includes the development and implementation of structural and non-structural BMPs, by MS4s.
Stormwater Best Management Practices
Low impact development (LID) is a strategy which employs stormwater BMPs to manage stormwater. The “National Menu of Best Management Practices for Stormwater: Phase II” (U.S. EPA, 2000b) along with state publications such as those by NCDENR (1999), were published in an effort to aid in the selection and design of BMPs.
In most states, stormwater management practices prior to the 1980’s consisted of large multi-acre basins or ponds primarily used for controlling excess flooding.
Subsequently, somewhat smaller practices were designed to capture sediment. Within the past fifteen years, practices such as infiltration trenches and basins, stormwater wetlands, vegetated swales, greenroofs, sand filters, and the focus treatment of this research, bioretention, have been employed to treat a greater suite of pollutants with greater efficiencies. Bioretention incorporates design elements from sand filters, infiltration trenches, and vegetated swales. These three practices are discussed herein as precursors to bioretention.
Sand filters, the BMP most closely related to bioretention, have been used as a water quality treatment device for many decades, initially in the waste water industry (Urbonas, 1999). In the 1980’s, sand filters were adapted to stormwater treatment by Shaver in Maryland and Delaware (Shaver, 1991), the City of Austin, Texas, in 1990, and in
bottom of the sand media that allows water to pass through the device. Sand filters are best situated in highly urban areas where land costs are high and are either surface or below ground systems.
Within the sand media some finer particles, such as dissolved solids, fine sediments, heavy metals, P and organic N, are removed. Sand filters primarily remove particulate or particle-bound pollutants such as total suspended solids (TSS). Efficiencies found by Galli (1990) were 70% for TSS, 45% for heavy metals, 33% for TP, and 46% for TKN. Sand particles in the filtration chamber capture sediment-bound particles; whereas, those in solution are able to pass through the system. Incorporating a relatively high number of soil adsorption sites may be an important part of sand filter and bioretention design.
Nitrate is rarely removed by a sand filter, and often, concentrations are increased because this BMP is not designed for NO3 removal. The city of Austin, TX, found nitrate
loadings to increase between 5% and 79% at four sites studied (City of Austin, 1990). Due to the fully aerobic design of this system and the lack of organic matter, NH4 is converted to
NO3, thus increasing the NO3 concentrations leaving the system.
Unlike the sand filter, which is completely encased in cement, an infiltration trench is open to the in-situ soil and filled with gravel or cobble (Schueler, 1987). Runoff is directed to the chamber and detained within the rock layer for later infiltration to the surrounding soil. Infiltration trenches are generally left un-planted.
periods, which allows temporary storage of runoff during rainfall events. This practice is also designed for volume and peak flow reduction; whereas, sand filters and infiltration trenches are not.
A vegetated swale is much like a grassed swale, only it is prescribed with more vegetation. Trees and shrubs extend their roots into the soil and ultimately create an
amended, infiltrating soil by aerating and adding organic matter. Its main purpose, however, is to convey stormwater while allowing for some infiltration and pollutant removal.
BIORETENTION AS A STORMWATER DEVICE
Bioretention has gained popularity among developers and landowners due to its aesthetic appeal and ability to meet stormwater and landscaping permits requirements. Other common names and similar applications for bioretention are infiltration, filter, bio-swale, and raingarden; however, “bioretention” is the standard for commercial and industrial use in North Carolina and is the terminology used herein. Although bioretention is becoming a popular practice, there are limited design standards available and most are based solely on the Prince Georges County design manual (PGC, 1993), which does not have universal application across North Carolina. The 1999, North Carolina Department of Environment and Natural Resources BMP Manual contains a bioretention chapter which is based on the PGC (1993) manual, with only minor variations.
Since the onset of bioretention use in Maryland, limited research has been published regarding bioretention performance, and design variations (Davis et al. 2001, 2003, Kim et
research are now discussed.
Bioretention Function
Bioretention is typically a small depression containing a loamy sand or sandy loam fill soil. Stormwater is directed from the surrounding disturbed surfaces to the bioretention area (Figure 2.1). Once the ponded zone becomes full, additional runoff bypasses the bioretention via a drop box spillway; concurrently, infiltration through the soil media draws down the water level to the soil surface within 6 to 12 hours of a rain event and up to 0.6m (2 ft) below the soil surface with 24-48 hours (Figure 2.2). All water that is initially captured in the ponding zone either exfiltrates to the groundwater, evapotranspires, or exits through underdrains. Larger storm events, depending on design, bypass the system through an overflow device designed to handle the flow. Once planted with vegetation, the bioretention area can become a natural ecosystem able to retain, infiltrate, and treat large quantities of polluted stormwater and enhance an urban landscape.
Figure 2.2. Standard cross section of a conventional bioretention area. Exfiltration is shown leaving the bottom and sides of the soil media.
The pollutant removal mechanisms within a bioretention area are physical, chemical, and biological. Physical include sedimentation, gross solids removal (catching of trash), trapping of oils and greases at the surface of the media, and the killing by sunlight and drying of bacteria caught on the soil surface.
Chemical removal mechanisms are often intermixed with biological functions. The most common chemical process is the bonding and sorption of heavy metals to both the organic matter contained in the mulch layer, and the mineral content within the soil itself (Essington, 2004). As discussed in more detail in the following sections, Davis et al. (2001) discovered that bioretention soils containing slightly more clay and silt than pure sand
Nutrients can also be captured by chemical processes, primarily phosphorus. Phosphorus sorption and fixation have been studied in great detail (Stevenson et al. 1999, Cox and Hendricks 1994, and Essington 2004). Phosphorus is highly attracted to iron- and aluminum-oxide minerals found in most soils. This attraction, or sorption, is generally the primary mechanism for removing phosphorus from water and fertilizers applied to soil. Iron is abundant in soils and is the primary element to which phosphorus is attached. A common measure of phosphorus content in soils in North Carolina is the P-Index system. The system relates a quantity of phosphorus to an index most often used in agricultural settings to determine the necessity of phosphorus fertilizer. Cox (1994) related the P-Index values to Melich 3 Extractable P (M3P) in units of milligrams P per kilogram of soil with the following equation:
(1)
v w
PI P
M
/ 2 . 1
3 = × ,
where PI = P-Index and w/v = weight to volume ratio of the soil. Ultimately the mass of P per mass of soil can be related to the P-Index in this manner.
some of the sites studied.
Biological functions found in bioretention areas are most commonly explained by plant and microbial activity above and within the soil. Nitrogen is the primary nutrient removed biologically. The common forms of nitrogen entering the bioretention area through rainfall and runoff are NH4, NO3, and organic N.
Once runoff has entered the bioretention area, NH4 is volatilized [transformed to
ammonia gas (NH3)] while ponding occurs on the surface (Vepraskas et al., 2001). Under
aerobic conditions, NH4 infiltrates the mulch layer and some is transformed to NO3 by
nitrification, some is immobilized by adsorption to organic matter, and some is passed through the soil. NH4 is also mineralized from within the soil media by decaying organic
matter. A major process is the transformation by nitrification to nitrite (NO2) and, ultimately,
NO3 with the aid of two microbes, nitrobacter and nitrosomonas (Stevenson et al., 1999), as
follows:
NH4 + (nitrosomonas)>> NO2 + (nitrobacter)>> NO3-.
With assumed anaerobic (saturated) conditions, NO3 is then transformed by
denitrification ultimately into N2 gas, assuming there is a suitable electron donor (carbon
source).
Current Bioretention Design
alterations are being suggested and incorporated into bioretention designs. An updated BMP manual is to be published in 2006 for North Carolina (NCDENR, 2005). Because of Phase II, smaller communities have begun adjusting BMP design standards to reflect local needs.
Bioretention designs found in both the EPA Menu of BMPs (2000b) and the
NCDENR BMP Manual (1999) are identical to those in the PGC manual (1993). They are based generically on the ability to sustain an ecological microcosm with width, length, and depth of fill soil sized to allow plant growth. A more recent publication by Hunt and White (2001) offers some alternatives to the design standards and procedures for North Carolina, such as surface area sizing criteria based on the “first-flush” treatment volume and
underdrain sizing. The “first-flush” treatment volume is most widely defined as the amount of runoff resulting from the 90% storm (Urbonas, 1999), as the elevated concentration of runoff experienced at the beginning of a storm, or as the amount of water necessary to wash off the majority of pollutants (Lee, 2002). The NCDENR manual states that the “first-flush” volume in North Carolina is the first 25 mm (1 in.) of runoff. By designing a bioretention area to capture this volume, the majority of polluted water is captured and treated. At a maximum storage depth between 15 cm and 23 cm (6 in. and 9 in.), the surface area of the bioretention generally ranges between 5% and 7% of the contributing watershed (dependent upon the watershed characteristics).
increased exfiltration. Due to the constant draw down of runoff and subsequent inter-event dry periods, it was doubtful whether anaerobic conditions formed (Hunt, 2003).
Figure 2.3. Design with internal storage zone (Hunt et al., 2003). Arrows mark storage zone of
0.35 m (14 in.).
Previous Research
A potentially outdated EPA “Menu” notes bioretention removal efficiencies for TN, NO3, NH4, and TP of 49%, 15%, 92%, and 65-87% respectively (U.S. EPA, 2000b). These
pollutant reductions are based on limited concentration data from studies at the University of Maryland. Less research has been published relating to volume and peak reduction, the only instance being that of a modeling study by McCuen et al. (2002). Current manuals discuss the reduction in stormwater peak flows but not volume reduction. Only recently, with increased interest in LID, has attention been paid to the benefits of volume reduction by bioretention areas (Coffman, 2002). Further research of bioretention areas is needed to give accurate nutrient removal efficiencies and flow volume reduction credit, as well as to investigate their volume reduction.
laboratory tests, but currently field studies have become more common. Researchers have also begun altering designs by testing the inclusion of an anaerobic zone (Hunt 2003, Kim et al. 2003) and prescription of different types of fill soil (Kim et al., 2003).
The first research published on bioretention tested small-scale, column and batch adsorption, and pilot boxes (Davis et al., 2001). It was found that using a sandy loam soil in lab studies could potentially remove > 90% of heavy metals (Cu, Zn, Pb) and moderate levels of nutrients such as: TKN (65-75%), NH4 (60-80%), and TP (~80%). Nitrate reduction did
not occur, and on occasion, concentrations increased. It was supposed that aerobic biologic activity caused the conversion of NH4 to NO3. A later study (Davis et al., 2003) examined
two sites: (1) Greenbelt, Maryland, at the time five years old and planted with grass and shrubs, and (2) Largo, one year old, mulched, and planted with shrubs. The field sites were loaded on one occasion, each with a synthetic runoff consisting of Zn, Cu, and Pb on June, 1997, and June, 1999, respectively. Outflow concentrations resulted in >95% reduction at the Greenbelt site for all metals; whereas, at the Largo site, reductions of 43% of Cu, 64% of Pb, and 70% of Zn were found. The fact that only one application was made in each case limited the findings. Davis et al. (2003) concluded by combining data from the box study and the Greenbelt field examination that metals were primarily removed within the top 20 cm (8 in.) of soil media. Effluent concentrations of lead and copper were less than 5 μg/L and zinc was less than 25 μg/L. Davis et al. (2003)estimated the lifetime capacity of metals accumulation within the bioretention media, and conservatively estimated that toxicity levels of concern would only be reached after nearly twenty years.
increase the reduction of NO3 and TN overall. Hunt (2003) applied a synthetic runoff to
twelve 30.5 cm (12 in.) diameter soil columns with 122 cm (48 in.) of loamy sand mix containing 10% hardwood mulch. These columns were designed to determine effectiveness of adding varied thicknesses of an induced anaerobic zone [30.5 cm (12 in.), and 46 cm (18 in.)]. Regardless of the configuration, NO3 was reduced from 1.8 mg/L to nearly 0.05 mg/L
(90%) and TN was reduced from 2.4 mg/L to nearly 0.6 mg/L (70%). Hunt (2003) attributed that local soil saturation may have occurred outside of the induced anaerobic zone due to the high clay content (up to 25%) explaining the lack of difference between the conventional design and anaerobic design. It was suggested from this research that bioretention containing approximately 20% clay could enhance reduction of TN and NO3 without inclusion of an
anaerobic zone.
The studies by Kim et al. (2003) were directed at increasing NO3 reduction and the
use of different carbon sources in soil media. Kim incorporated newspaper, leaf compost, sawdust and straw into an 18 cm (7 in.) deep anaerobic zone at the bottom of a 36 cm (14.2 in.) deep pilot bioretention box to affect NO3 reduction rates. A synthetic runoff was applied
with concentrations varying between 2.0 mg/L and 8.0 mg/L of NO3, and at different flow
rates. It was found that NO3/NO2 was reduced 70%-80%, but TKN and NH4 increased in the
effluent. It was suggested that ammonification and microbial activity increased NH4
Hunt tested several bioretention areas. Two conventional, 1.2 m (4 ft) deep cells, one in Greensboro, NC and one in Chapel Hill, NC. reduced TN load by approximately 40%. one .6m (2 ft) deep cell in Chapel Hill. The two cells sized to have a surface between 5% and 7% of their watersheds. Nitrate was reduced by 75% at Greensboro where in Chapel Hill it was reduced by only 13%. The lack of organic matter within the Chapel Hill fill soil was believed to have permitted less denitrification, while the possible formation of localized anaerobic zones within the Greensboro cell was believed to have elevated its denitrification. The TKN removal varied from 4.9% in Greensboro, to 45% in Chapel Hill; whereas, NH4
removal varied from 1% to 86% for Greensboro and Chapel Hill respectively. These differences were explained by the nitrogen cycle. The cells with more organic matter (Greensboro) released more nitrogen due to mineralization. No conclusions could be made when comparing the conventional cell and that containing the internal storage zone
Greensboro.
When looking at TP reductions, Hunt (2003) reported a significant increase (240%) in TP load in Greensboro of 240%, while in Chapel Hill a TP reduction of 65% was found. It was discovered that fill soil within the two cells had extreme differences in soil test
phosphorus. In North Carolina, phosphorus content is reported as a phosphorus-Index (P-Index) which is a quantification of phosphorus within the soil. Multiplying the P-Index by a factor of 1.2 results in the quantity of P (mg/dm3 or ppm). The soil in the Chapel Hill bioretention area had a P-Index ranging from 4 to 12 (4.8-14.4 ppm), whereas the
Greensboro cell had a P-Index ranging from 86 to 100 (103.2 – 120 ppm). A soil containing a high P-Index has more phosphorus within the soil available for dissolution.
results were reported regarding the IS cell’s load reduction, it was noticed that TP
concentrations were lower than those leaving the conventional cell. The IS cell contained a medium P-Index soil ranging from 35 to 50 (42 - 60 ppm), which was lower than that of the conventional cell [86-100 (103 – 120 ppm)]. This supported that the higher the P-Index within the fill soil, the higher the outflow concentration of P would be.
Hunt (2003) also found that bioretention can potentially reduce runoff volume. His findings were directed at seasonal variation in the loss by ET and exfiltration. This led Hunt to believe that a larger portion of water can be lost to ET during the Summer and Fall
seasons. In terms of quantifying volume reduction, Hunt’s study was inconclusive and is, thus, a topic of this thesis.
State of the Art
After these initial studies, it was evident that bioretention can function well for pollutant reduction. Many of the early questions relating to bioretention have been answered by these initial studies, including heavy metal reduction rates, load removal by a
conventional cell, appropriate soil depth for metals removal, and seasonal variations. Variations in drainage design suggest, although not conclusively at this point, improved N reduction, specifically NO3. Findings related to the phosphorus Index suggest that fill soil
CHAPTER III: RESEARCH GOALS AND HYPOTHESES
PERTINENT QUESTIONS
There are few studies published regarding pollutant removal and even fewer regarding volume and peak flow reduction. Despite pollutant loads being decreased by bioretention areas, increased volume reduction will further increase pollutant load reduction. More attention to volume reduction will not only create further water quality benefits, but also increase groundwater recharge in urban soils and potentially reduce stream erosion and flooding impacts. Although previous research has answered several questions related to pollutant reduction, many questions and research needs have developed. Several questions were developed for this thesis as follows:
1. What is a sufficient soil test P level that will both remove TP and sustain plant growth?
2. What are the peak flow and volume reduction benefits of a bioretention area? 3. How much volume reduction is attributable to both evapotranspiration and
groundwater recharge?
4. What are the hydrologic effects of adding an internal storage zone?
5. What is the load-based removal of TP and TN of a cell containing an internal storage zone?
6. Does an internal storage cell develop reduced soil conditions?
In order to answer these questions, several research hypotheses and goals were developed and are found in the following sections.
PROPOSED HYPOTHESES
The first three hypotheses were tested on a significance level of p = 0.05. The fourth hypothesis was tested using a water balance and has no significance level. All four
hypotheses are listed below:
1. Adding an internal storage zone significantly (p = 0.05) increases volume reduction of runoff over that of a conventional cell.
2. Adding an internal storage zone significantly (p = 0.05) increases NO3 and TN
removal from stormwater.
3. An increase in P-Index level of bioretention fill soil significantly (p = 0.05) increases effluent concentrations.
4. A considerable portion of water is lost to exfiltration and evapotranspiration from a bioretention area within a tight clay sub-soil.
RESEARCH GOALS
The following research goals were developed to test the aforementioned hypotheses and other questions on bioretention function:
(3) determine nutrient reduction, especially phosphorus, when low P-Index soils are used, (4) create bioretention water balance in terms of underdrain flow, evapotranspiration,
exfiltration, and bypass, and (5) estimate nutrient load removal.
CHAPTER IV: METHODS AND PROCEDURES
FIELD STUDY
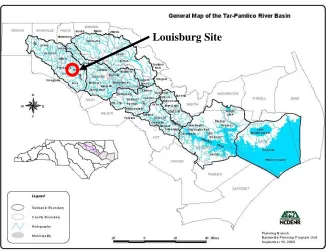
Two field sites were used in this thesis, both were located in the Piedmont region of North Carolina. The first site was located on Battleground Avenue in Greensboro, North Carolina, within the headwaters of the Cape Fear River Basin. This site was also the subject of study in Hunt et al. (2003). The second site was located at Joyner Park, in Louisburg, North Carolina within the Tar- Pamlico River Basin, designated a Nutrient Sensitive Watershed (NSW). A map locating each site is found in Figures 4.1 and 4.2.
Greensboro Site
Louisburg Site
Figure 4.2. Location of site 2, Tar-Pamlico River Basin, North Carolina (adapted from NCDENR 2000).
Site Descriptions
Greensboro Site – Investigation of Internal Storage and P-Index
Two cells were constructed in the winter of 2000 and 2001 at a shopping center which received moderate week-day traffic. Photos of each cell are found in Figure 4.3. A plan sheet of their layout is found in Figure 4.4. Both cells comprised 5% of their watersheds which consisted of a small shopping complex rooftop and parking lot containing
(a) (b)
Figure 4.3. (a) Internal storage cell (G-1) and (b) conventional Cell (G-2) Spring 2003.
G 1 (I t l St )
G 2
G-1, Internal Storage
G-2 Conventional
Figure 4.4. Plan sheet locating two bioretention areas in Greensboro.
The two bioretention areas were designed based on the PGC 1993 manual for
bioretention design, except for the inclusion of an internal storage zone in cell G-1. The two cells are approximately 5% of their 0.2 ha (0.5 ac) watersheds. Each cell has a nominal 15 cm (6 in.) drainage layer, placed at the bottom of the cell, consisting of washed No. 57 stone enveloping a pair of drain pipes. Filter fabric was placed above the drainage layer,
of 1.2 m (48 in.). Cell G-1 was located in the front of the shopping center and was constructed with a 0.6 m (24 in.) internal storage zone. The storage zone was created by placing an elbow turn where the underdrain intercepted the storm drain network (Figure 2.3). This upturned pipe forced temporary saturation within this zone, and prohibited outflow until the level of the elbow is reached. The second cell, G-2, was left conventionally drained with no IS zone.
Fill soil tested two years after construction by Hunt (2003) found the soils to have a hydraulic conductivity of 0.11 mm/s (15 in/hr) and were originally intended to have the same chemical and textural make up. Soils were tested and found that the IS design cell (G-1) soils were in the medium P-Index range (35-50), where soils in the conventional cell were in the high range (86-100). It became evident that no conclusions would be possible regarding P removal and the addition of an IS zone. The growing season was determined from the Guilford County Soil Survey to extend from March 26 through November 26 (Stephens, 1977).
Louisburg Site – Hydrology and Fill Media
(Figure 4.5) depicts the location of each cell within the park and their watersheds. Figure 4.6 shows an example of the watershed for L-1.
L-1 (un-lined) L-2 (lined)
Figure 4.5. Plan sheet of bioretention areas and contributing watersheds at Joyner Park, Louisburg, NC.
Figure 4.6. Photo showing watershed of Louisburg bioretention (L-1).
prior fill soil P-Index level findings (Hunt, 2003), care was taken to locate a fill soil source with low P-Index levels. A “ball park” mix, normally used for baseball fields, and a “mortar” mix used for concrete sand proportionally mixed to create loamy sand fill soil containing approximately 88% sand. The other fractions were primarily made up of clays. Ten pounds and fifteen pounds of dry peat moss were added to the top of the first lift of fill soil [203 mm (8 in.)] for L-1 and L-2 respectively. A cross section of their design is found in the Figure 4.8. The cells followed typical construction methods with minor adjustments to allow for monitoring. In-situ soil surrounding the cells was a tight clay with low
permeability. The vertical saturated hydraulic conductivity measured from 20 core samples ranged from 0.1 cm/hr to 1.2 cm/hr (0.04 in./hr to 0.47 in./hr) for the in-situ soils below the bioretention areas.
(a) (b)
Figure 4.8. Design of lined bioretention cell in Louisburg, N.C. The un-lined cell did not contain the 30 mil PVC liner.
Monitoring Procedures
Monitoring for both water quality and water quantity was conducted at each field site using a combination of automated sampling equipment. All bioretention cells were
abstraction of 2.0 mm (0.08 in.) for impervious surfaces (CN of 98) and 8.4 mm (0.33 in.) for pervious surfaces (CN of 86), excluding the bioretention area, were used for every break in rainfall greater than 6 hours. The volume entering from each surface was calculated separately, summed, and added to the volume falling directly on the bioretention area.
Sampling and Data Storage
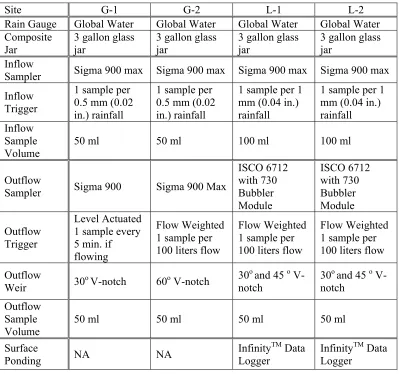
The two sites were monitored with similar approaches, although not equivalently. Table 4.1 summarizes the setup for both sites. In Greensboro one inflow setup and one outflow setup was used for each of the two cells. To collect inflow samples, rainfall was measured in five minute intervals by a Global Water tipping bucket rain gauge, RG600TM connected to an American Sigma 900 MaxTM automated sampler. For every 0.5 mm (0.02
in.) of rainfall, the sampler was triggered to collect a 50 ml sample from a trough at the edge of the parking lot (Figure 4.9a). A second sampler was used for each cell to collect outflow data and samples. A pressure transducer by SigmaTM connected to the sampling unit, was placed in a weir box containing a 30o V-notch weir for G-1 and a 60o V-notch weir for G-2 (Figure 4.9b). The sampler calculated flow and was programmed to pull 50 ml samples from the weir box through 9.5 mm (0.38 in.) I.D. polyethylene tubing for every 100 L of water passing through the weir box, taking the first sample after 100 L. The samples were composited by each sampler in a glass composite jar housed in the sampling unit.
which was switched to a 45o V-notch weir on July 26. Weighted outflow samples were collected by an ISCO 6712 with a 730 Bubbler Module for each cell. The sampler
automatically calculated flow, and was programmed to collect a 50 ml sample from the weir box for every 100 L of flow passing through, compositing samples within the housing unit.
Table 4.1. Summary of inflow and outflow sampling and monitoring equipment used at each bioretention area.
Site G-1 G-2 L-1 L-2
Rain Gauge Global Water Global Water Global Water Global Water
Composite Jar
3 gallon glass jar
3 gallon glass jar
3 gallon glass jar
3 gallon glass jar
Inflow
Sampler Sigma 900 max Sigma 900 max Sigma 900 max Sigma 900 max
Inflow Trigger
1 sample per 0.5 mm (0.02 in.) rainfall
1 sample per 0.5 mm (0.02 in.) rainfall
1 sample per 1 mm (0.04 in.) rainfall
1 sample per 1 mm (0.04 in.) rainfall Inflow
Sample Volume
50 ml 50 ml 100 ml 100 ml
Outflow
Sampler Sigma 900 Sigma 900 Max
ISCO 6712 with 730 Bubbler Module ISCO 6712 with 730 Bubbler Module Outflow Trigger Level Actuated 1 sample every 5 min. if flowing
Flow Weighted 1 sample per 100 liters flow
Flow Weighted 1 sample per 100 liters flow
Flow Weighted 1 sample per 100 liters flow
Outflow
Weir 30o V-notch 60o V-notch
30o and 45 o
V-notch
30o and 45 o
V-notch Outflow
Sample Volume
50 ml 50 ml 50 ml 50 ml
Surface
Ponding NA NA
InfinityTM Data
Logger
InfinityTM Data
(a) (b)
Figure 4.9. (a) Inflow sampling trough at edge of parking lot, and (b) outflow weir box attached to underdrain.
For each storm event, an inflow- and outflow-weighted composite sample was taken representing the entire event. Samples were collected from the composite jars in the housing units within 24 to 36 hours of the storm event. All samples were acidified with 2 drops of 36 molar H2SO4 per 50 ml of sample, reaching a total sample volume of 150 ml – 250 ml.
Samples were then taken to Soil Sciences Analytical Services in the Soil Science Department at North Carolina State University and refrigerated until analyzed. Pollutants analyzed were TKN, NO3, NH4 , TP, PO4, Zn, Cu, and Fe. The Lab used methods found in the AWWA
Standard Methods for Water and Waste Water Analysis (1992).
Water Balance Methods Specific to Louisburg
high levels of inaccuracy were experienced in measuring flow over the bypass devices (drop inlet and rectangular weir) (Figures 4.10a and 4.10b), especially when measuring depths less than 1.0 cm (0.4 in.), these data were used only to determine when water bypassed the system and not to directly calculate a bypass volume.
(a) (b)
Figure 4.10. (a) Bypass grate for L-1, and (b) bypass spillway for L-2. Using a simple water balance equation, the percent of exfiltration and
evapotranspiration was calculated. The general water balance of a bioretention area can be described as a balance of inflows and outflows (IN = OUT). The water balance equation applied to these cells was as follows:
(2) Qi = ET + Qu + EXF + ΔS,
where, Qi = inflow, ET = evapotranspiration, Qu = outflow from the underdrain, EXF =
exfiltration to groundwater, and ΔS = change in storage.
unsaturated outside the media. The un-lined cell was less saturated inside the fill soil than the lined cell, but more saturated outside the media along the perimeter of the fill zone. This confirmed that water did not penetrate the liner, and suggests that water was leaving the un-lined cell.
Sequence of water table after rainfall event
Water table of in-situ soil
Un-Lined Cell
In-Situ Soil
Auger-Hole positions Underdrain
Water table after rainfall event Plastic Liner
Lined Cell
Soil Surface Soil Surface
Sequence of water table after rainfall event
Water table of in-situ soil
Un-Lined Cell
In-Situ Soil
Auger-Hole positions Underdrain
Water table after rainfall event Plastic Liner
Lined Cell
Soil Surface Soil Surface
Figure 4.11. Diagram of water table sequence after a rainfall event within both cells. Locations of auger holes.
EXF and ΔS are also assumed to be zero for the lined cell. A volume and percentage of ET was calculated for the lined cell using the following equations:
(3) ET2 = Qi2 - Qu2
(4) ET2 / Qi2 = %ET2
Assuming the two cells experienced similar ET rates, the %ET leaving L-2 (lined cell) was equal to the %ET leaving L-1(unlined cell). By dividing by the inflow of L-1, a volume of ET for L-1 was obtained. This was applied to the general water balance equation yielding:
(6) EXF1 = Qi1 – Qu1 –ET1,
where ET1 = %ET2 x Qi1. This resulted in a volume lost to exfiltration.
Comparison of Conventional vs. Internal Storage Design
Determining hydrologic differences between the two cells in Greensboro was possible with a t-test on event and monthly outflow volumes from each cell. Although measurements of surface ponding were not taken for this site, the comparison was still possible by assuming both cells experienced equal bypass volumes. Surface ponding only occurred when the inflow rate exceeded that of the infiltration rate. Outflows through the underdrains were limited by the hydraulic conductivity of the fill soil. Since both fill soils were nearly identical in texture, they were assumed to have equal infiltration rates (Hunt, 2003). Field inspection of ponding characteristics were noted for a moderate rainfall event on September, 2003, and found that both cells behaved very similarly.
LABORATORY STUDY –INVESTIGATION OF P-INDEX
Soils
Soil textures most often used in bioretention have a United States Department of Agriculture (USDA) soil texture between loamy sand and sandy loam (typically containing 80% - 90% sand); therefore, the three soil mixes desired for the laboratory study were 80% and 90% sand with 100% sand as a control. Fines consisted primarily of clay. In order to reach the desired Index levels, it was necessary to obtain a source soil with a very low P-Index and add P. The source soils and relative amounts of each used to create the desired textures are found in Table 4.2. Both source soils were taken from the same mine in Franklin County, NC, as the soils used in the Louisburg bioretention areas. The soils were mixed by hand using plastic buckets to obtain the desired textures. Once obtained, each soil texture was raised to the four different P-Index levels 10, 25, 50, and 100 totaling twelve
combinations. The relationship of P-Index to the mass of phosphorus per mass of soil is discussed below.
Table 4.2. Source soils and quantities needed to result in the desired textures for soils A, B, and C.
Source Mortar Mix Ball Park Mix
Resulting % Sand1
P-Index 2 1 xx
Percent Sand 95-100% 65% xx
Percent Fines 0 – 5% 35% xx
Soil A 100% 0% 95-100%
Soil B 70% 30% 85-90%
Soil C 40% 60% 76-80%
Raising the P-Index
In order to raise the P-Index of the soils, triple super phosphate (P2O5) was added to
each batch of soil. The amount needed to raise index levels was determined using an
equation developed by Cox (1994) relating the amount of P fertilizer applied to a soil, % clay in the soil, and the Mehlich-3 extractable P (M3P) of the soil as follows:
(7) clay
added
e P
P
M3 =1.16× −.052×% .
It was first necessary to convert the starting and desired P-Indices. This was done using the following equation:
(1)
v w
PI P
M
/ 2 . 1
3 = × ,
where,
M3P = mg-P/kg-soil PI = P-Index
w/v = weight to volume ratio of the soil.
Soil test reports received from the North Carolina Department of Agriculture, Agronomic Division contain both the w/v ratio and the PI. The PI and w/v for the source soils can be found in Appendix E. Cox’s equation was rearranged, and the difference of the starting and desired M3P was substituted to result in the following equation:
(8)
(
3 3)
[1.16 .052%clay].toadd M Pend M Pstart e
P = − ÷ × − ×
given in Table 4.4. The soils were mixed as described in the next section before being placed in replicate boxes.
Table 4.3. Resulting quantities of “P to add.”
P to add Soil A Soil B Soil C
P-Index mg-P/kg-soil mg-P/kg-soil mg-P/kg-soil
PI 10 6.13 7.37 7.91
PI 25 17.62 19.65 21.08
PI 50 36.78 40.12 43.04
PI 100 75.10 81.06 86.96
Table 4.4. Total mass of P2O5 added to each five replicate batch for three soil
textures.
Soil A (g-P2O5)
Soil B (g- P2O5)
Soil C (g- P2O5)
kg/batch1 23.5 22.5 22
PI 10 0.72 0.87 0.93
PI 25 2.07 2.31 2.48
PI 50 4.32 4.71 5.06
PI 100 8.82 9.52 10.22
1Each batch contained soil for five replicates.
Soil Preparation and Assembly of Replicate Boxes
Four replications of each combination were made, totaling 48 replicates. A fourth engineered media, provided by Carolina StaliteTM was used where only four replicates and no alteration of P-Index were made. The fourth media was an expanded slate, typically used in greenroof medium. The procedures for mixing the soils and assembling replicates were as follows:
2 Separated four batches of approximately 25 kg (55 lbs) from each texture to prepare five replicates for each P-Index level.
3 For each texture, weighed one tray to be used in calculation of “P to add.” The mass was multiplied by five (five replicates) to reach the total mass of soil to be treated with TSP.
4 Weighed total mass of soil for each P-Index/Soil texture combination. The same five replicate weight 23.5 kg, 22.5 kg, and 22 kg for Soil A, B, and C respectively, was used for each P-Index level.
5 Weighed the mass of TSP calculated (Table 4.4) to raise each five-replicate batch to the desired P-Index levels (10, 25, 50, 100).
6 Added TSP to 5 kg lifts of soil and mixed thoroughly in the same manner as for preparing soil textures.
7 Assembled trays and filled four replicates of each texture/P-Index
combination (Figure 4.12a). Applied two 2 kg lifts, followed by one 1 kg lift, lightly tamping between layers. Soils were packed to a composite depth of nominally 76 mm (3 in.). Enough soil remained to make one extra replicate if necessary.
8 Took soil samples from each tray (a total of twelve samples) and sent soil samples to the USDA Lab for analysis of P-Index.
9 Prepared four replicates of engineered soil supplied by Carolina Stalite® in the same manner as above, without P-Index alterations. (See Appendix F)
of 464.5 cm2 (72 in.2). A two-level, wooden stand was made to house the boxes in a compact
manner (Figure 4.12a and 4.12b), with three boxes placed on the top level, and two on the bottom. To allow for draining and sample collection, a 1.3 cm x 1.9 cm (½ in. x ¾ in.) plastic, threaded hose barb secured with Liquid Nails® glue was placed in the bottom center of the box. For boxes placed on the top level, a 15.3 cm (6.0 in.) piece of 3/8th I.D.
polypropylene tubing was attached to the barb and fed into 500 ml Nalgene sample bottles for sampling of effluent. No addition of tubing was necessary for boxes on the bottom level. Once assembled, a stainless steel screen (Figure 4.13) was placed over the fitting and soils were packed in place. Each container had a semi-airtight cover to reduce evaporation.
(a) (b)
Figure 4.13. Empty soil tray used in laboratory study showing screen over outlet.
Simulated Runoff
Phosphorus Concentrations in Runoff
A concentration of phosphorus to apply as a synthetic runoff was determined from previous literature which examined parking lot runoff concentrations in North Carolina and Maryland. The concentrations in Table 4.5 were determined from a range of concentrations found in other publications (Wu et al. 1998, Davis et al. 2001) and those found anecdotally at the field site in Greensboro, which were specific to the piedmont of North Carolina.
Phosphorus was the only pollutant added to the simulated runoff. Because the organic forms of phosphorus are not easily reproducible in a lab setting, PO4 was the only form of
phosphorus tested.
Table 4.5. Phosphorus concentrations in runoff used for synthetic rainfall n laboratory study .
Field (2003)
Davis et al. (2001)1
Wu et al. (1998)
Proposed for lab
study
PO4 mg-P/L 0.01 to 0.2 0.6 0.15 to 0.3 0.1
1Supplied by Na
Application Load and Volume
The load of P in each application was based on the average annual rainfall and the PO4 concentration found in the literature. In the eastern piedmont of North Carolina this
corresponds to 114.3 cm (45 in.) of rainfall (Eder et al., 1983). Using the Curve Number (CN) Method and a typical parking lot CN of 98, 1.66 cm (0.66 in.) of runoff was calculated to enter a typical bioretention area using a weekly average rainfall of 2.2 cm (0.865 in.). It was calculated that a hypothetical bioretention area the size of the containers used [465 cm2 (72 in.2) in surface area] and 7.0% of its watershed, would treat a watershed of 6,643 cm2 (1,029 in.2). The volume of runoff entering a typical cell on a weekly basis was calculated to be 10.62 L (2.81 gal). Given that the model bioretention cells contained 7.62 cm (3 in.) of soil, or approximately 1/12 the soil depth of a typical bioretention area [91 cm (36 in.)], the runoff entering the model cell was approximately 1/12 the runoff entering the normal depth cell. The estimated volume entering the model cell was calculated to be 0.89 L (0.23 gal) per week.
Given a concentration of 0.1 mg-P/L of PO4 in rainfall, and the volume of 0.89 L
(0.23 gal), a load of 0.089 mg of PO4 was needed to be applied each week to each replicate.
Because 100 ml of effluent was needed for analysis, water volume applied was decreased. To supply a load of 0.089 mg, 0.5 L of 0.18 mg/L, versus 0.89 L of 0.1 mg/L solution was applied each week. This led to a total mass added to each replicate of 0.89 mg over the entire ten week period. Table 4.6 summarizes the load of phosphorus added to each model
replicate. Table 4.7 summarizes the actual loads and volumes applied.
Typical volume per week (1 rep.) 0.89 L/wk
Concentration 0.1 mg/L
Mass P added per week 0.089 mg/wk/rep.
Total mass P in 10 weeks 0.89 total mg/rep.
Table 4.7. Actual load of P and volume of solution applied to each replicate.
Volume per week (1 rep.). 0.5 L/wk
Concentration of application 0.18 mg/L
Total volume needed per week (52 reps.) 26 L
Total volume applied in study 260 L
Total mass P used in study (52 reps. x 10 wks.) 46.8 mg
Solution Mixing, Application, and Sampling of Effluent
Although the average number of days between rainfall events in the Piedmont of North Carolina is three to four days (Hunt, 2000), the solution was applied every seven days for ten weeks. Weekly on Tuesdays from March 1, 2005 through May 3, 2005, 30 liters of solution was produced containing 0.18 mg of PO4per liter, six liters at a time. An amount of
4.62 mg of potassium phosphate (KH2PO4) was added to each 6.0 L batch of distilled
de-ionized water and stirred by a magnetic stirrer for five minutes, yielding a final concentration of 0.18 mg-PO4/L. Immediately upon complete mixing, 0.5 L of the solution was transferred
to 1.0 L spray bottles and applied to the soil trays as a fine spray (Figure 4.12).