Analysis of Quantitative Trait Locus Effects on the Size and Shape
of Mandibular Molars in Mice
Michael Scott Workman,* Larry J. Leamy,*
,1Eric J. Routman
†and James M. Cheverud
‡*Department of Biology, University of North Carolina, Charlotte, North Carolina 28223,†Department of Biology, San Francisco State University, San Francisco, California 94132 and‡Department of Anatomy and Neurobiology, Washington University School of Medicine,
St. Louis, Missouri 63110 Manuscript received March 20, 2001 Accepted for publication December 21, 2001
ABSTRACT
While⬎50 genes have been found to influence the development of teeth in mice, we still know very little about the genetic basis for the adaptive characteristics of teeth, such as size and shape. We applied interval mapping procedures to Procrustes size and shape data obtained from 10 morphological landmarks on the mandibular molar row of the F2progeny from a cross between the LG/J and SM/J strains of mice. This revealed many more QTL for molar shape (18) than for molar centroid size (3), although levels of dominance effects were comparable among QTL for size and shape. Comparisons of patterns of Procrustes additive and dominance shape effects and ordination of QTL effects by principal components analysis suggested that the effects of the shape QTL were dispersed among the three molars and thus that none of these molars represents a genetically distinct developmental structure. The results of an analysis of co-occurrence of QTL for molar shape, mandible shape, and cranial dimensions in these mice suggested that many of the QTL for molar shape may be the same as those affecting these other sets of characters, although in some cases this could be due to effects of closely linked genes.
M
AMMALIAN teeth represent structures of consid- though more so for the first two molars than the third molar (Bader 1965a,b; Bader and Lehmann 1965; erable taxonomic, anthropological, andevolu-tionary significance (Vernon 1995; Suwa et al. 1996; Leamy and Bader 1968; Leamy and Touchberry 1974). This suggests that there may be abundant genetic Carrasco2000; Schwartz 2000;Stafford and
Sza-lay2000), and therefore it is not surprising that they variability for various tooth dimensions, that genes pro-ducing this variability may often have pleiotropic effects have been the focus of a number of genetic studies
among these dimensions, and that the third molar may (Bleicheret al. 1999). In recent years especially,
devel-be at least partially genetically independent from the opmental geneticists have discovered a number of genes
other two molars, but such studies cannot take us any that regulate specific processes leading to the formation
further than these generalizations. of teeth (Cho and Garant 1996; Aberg et al. 1997;
Fortunately, interval mapping techniques (Thoday Thesleff and Jernvall 1997; Bei and Maas 1998;
1961; Lander and Botstein 1989) now are available D’Souza et al. 1999;Yamazaki et al. 1999). Mutations
that enable us to locate and assess specific quantitative at these loci can cause rather drastic effects, such as loss
trait loci (QTL) affecting characters of interest. QTL of certain teeth (Johnson et al. 1992; Thomas et al.
studies have been successfully applied to various dimen-1997) or gross misalignment of the teeth and
deforma-sions in mouse mandibles (Cheverudet al. 1997;Leamy tion of the jaw (Fantlet al. 1995).
et al. 1997) and skulls (Leamy et al. 1999). Recently, Although such studies have been useful in adding to
Klingenberg et al. (2001) used QTL mapping to ana-our understanding of tooth development, they tell us
lyze the entire geometric configuration of a set of land-little about the genetics of specific measures on teeth
mark points. Using a Procrustes geometric approach (such as their size and shape) that tend to be of greater
with five landmark points in mandibles of mice, they interest especially to evolutionary biologists. Some early
were able to identify a number of QTL for overall quantitative genetical studies did make use of various
(centroid) size and even more QTL for shape in these dimensions in mouse teeth such as mandibular molar
mandibles, with dominance effects being relatively more widths, and these studies showed that the heritability
important for the QTL influencing shape. Further, they for these characters, as well as the genetic correlations
showed that the variation of shape effects among these among them, are moderate to high in magnitude,
al-QTL was continuous, with no evidence for distinct groups of QTL that had similar effects on mandible shape (Klingenberg et al. 2001). This suggested that 1Corresponding author:Department of Biology, University of North
the effects of these genes were not restricted to the
Carolina, Charlotte, North Carolina 28223.
E-mail: [email protected] developmentally distinct ascending ramus and alveolar
representation for the first (M1), second (M2), and third molar regions of the mandible, as had been found previously
(M3), which comprise the molar row, and because they ap-byCheverudet al. (1997) in their analysis of
interland-peared to be the most repeatable in early measurement trials
mark distances. (see below for an assessment of measurement error). This
In the study reported in this article, we searched for procedure was repeated twice for the teeth on each side of the mandible, creating a set of four replicate measures for QTL affecting size and shape of the mandibular molar
each of the F2 progeny. Altogether, 502 mice (254 males, row of the mice used byKlingenberget al. (2001). We
242 females) measured in this manner were available for the wanted to know if, as was found byKlingenberget al.
analysis.
(2001) for the mandible, we would find more QTL for Morphometric analyses:Individual variation in tooth shape tooth shape than for size and whether the QTL for was analyzed using an adaptation of the Procrustes superimpo-sition technique that has been previously described by tooth shape also would exhibit more dominance. Our
Klingenberg and McIntyre (1998). This procedure starts primary interest, however, was in discovering whether
with a set of x, ycoordinates; eliminates the effects of size, the effects of the QTL for tooth row shape would be
location, orientation, and reflection; and produces a new set localized in one or two of the three molars that comprise of coordinates that retains all remaining aspects of the original the tooth row. According to the concept of morphologi- geometric configuration. This was accomplished by the follow-ing: (a) changing the sign of thexcoordinates for both repli-cal integration (OlsonandMiller1958), such
cluster-cates of the left molar row for each mouse (creating its mirror ing of QTL effects might be expected if any of these
image); (b) scaling all four replicates for each mouse to the molars represents a developmentally distinct unit. If the
mean of their respective centroid sizes (this is the standard effects of QTL influencing tooth row shape were not measure of size for geometric morphometrics and is defined restricted to one or two molars, however, we also were by the square root of the sum of the squared distances between each landmark and the meanx and yvalues for the entire interested to know whether these QTL influenced
char-configuration); (c) subtracting the mean x and y value for acters other than the tooth row. We therefore made use
each replicate configuration from each of the landmark points of available mandible and skull QTL data in these mice
within that configuration (this superimposes the four repli-to test whether any of the QTL found for repli-tooth shape cates); and (d) rotating each of the four replicate configura-might co-occur with those influencing these other sets tions about its own centroid to minimize the sum of the
of characters. squared distances between corresponding landmarks.
The Procrustes procedure applied to the tooth row data produced values for the tooth row centroid size and 20 new shape variables for each of the four replicate measures for MATERIALS AND METHODS
each mouse. In all analyses described below, centroid size was used as an overall measure of tooth row size and was treated
The population and variables:The study made use of the
separately from shape as measured by the 20 shape variables. F2progeny from a cross between the Large (LG/J) and Small
Although the original morphospace has two dimensions (SM/J) inbred strains that originally had been selected for
(x andy) for each landmark, the shape variables have only large and small body size and subsequently inbred upon
re-2(10)⫺4⫽16 dimensions because the Procrustes procedure ceipt at the Jackson Laboratory. Previous investigations have
eliminates 4 d.f. when size, location, orientation, and rotation shown that the mean 60-day body weights are 37.4 g (LG/J)
are eliminated from the original geometric configurations. It and 13.6 g (SM/J) for these strains of mice (Goodale1941;
should be noted that the tooth size and shape measures were
MacArthur 1944; Chai 1956a,b). Single-pair matings of
produced geometrically by superimposition, and this is not Large females by Small males produced 41 F1hybrids that
equivalent to standard statistical procedures (such as principal were single-pair mated and eventually produced a total of 535
components analysis, PCA), which might render these vari-F2mice. After 21 days of age, all F2litters were weaned and
ables independent. In fact, there can be a correlation between sexes were caged separately. All F2mice were sacrificed at 70
the Procrustes size and shape tooth variables; and if this exists, days of age, their spleens were removed, and their skeletons
it would indicate allometry. were prepared by exposure to dermestid beetles.
We first adjusted tooth row centroid size and the 20 shape DNA was extracted from the spleens of mice in the F2
genera-variables for potential effects of sex, dam, block, and litter tion, and a total of 76 polymorphic microsatellite loci were
size (see Cheverud et al. 1996) by obtaining the residuals scored in all 535 F2mice following a protocol that has been
from multiple regression and then adding these values to previously described (Routman and Cheverud 1995).
Al-the overall mean for Al-the individualx andy values for each though these 76 loci adequately covered all 19 autosomes (see
landmark. To assess measurement error, these adjusted values Figure 1), the X chromosome was not included because of its
for centroid size and the shape variables were subjected to low incidence of polymorphic microsatellite loci (Routman
mixed-model, two-way ANOVAs where the main factors were and Cheverud 1995). In addition, some loci could not be
individuals and sides (Leamy1984;Palmer1994). Centroid well resolved on the gels, so the loci varied in their total
sample sizes (Cheverud et al. 1996). The positions of the size was analyzed using a conventional two-way ANOVA while the new Procrustes coordinates were analyzed using a two-way 76 microsatellite loci based on recombination percentages
derived from the MAPMAKER 3.0b program (Landeret al. Procrustes ANOVA, which has been adapted for shape data (KlingenbergandMcIntyre1998). Since Procrustes shape 1987;Lincolnet al. 1992) have previously been given (
Chev-erudet al. 1996;Leamyet al. 1997). These 76 loci defined a data have more degrees of freedom than conventional mor-phometric data,F-tests for the Procrustes ANOVA were evalu-total of 1500 cM of map distance and included 55 intervals
between loci with an average interval length of 27.5 cM. ated usingn(2k⫺4) d.f. (wherenis the degrees of freedom from an ordinary ANOVA andkis the number of landmarks; Both left and right sides of the mandible in each mouse
were separated at the mandibular symphysis and coordinates seeKlingenbergandMcIntyre1998).
In these analyses, measurement error was assessed by varia-of 10 landmarks on each mandibular molar row (see Figure
Figure1.—Locations of marker loci and QTL for molar size and shape. All 76 marker loci are shown along with the locations and confidence intervals for QTL that influence molar row shape (circles) and molar centroid size (squares).
Palmer1994) and accounted for 8.9% of the total variation {⫹1, 0,⫺1} and dominance genotypic deviations {0, 1, 0} were for centroid size, but nearly 22% of the total variation in shape. assigned for the LG/LG, LG/SM, and SM/SM genotypes at Differences among individuals in tooth size and shape assessed each marker location. We then calculated the imputed geno-here were significantly greater than those due to the size by typic deviations for each 2-cM interval between flanking mark-individual interaction, and this interaction was significantly ers on each chromosome by using the recombination frequen-greater than the measurement error; therefore, this source cies between these markers and the formulas inHaley and of error does not appear to represent a problem for this study. Knott(1992). Canonical correlation analyses were used to Once this preliminary assessment of measurement error was estimate the degree of association between the morphometric completed, we used the mean of the four values (both repli- variables and the genotypic deviations at each 2-cM interval cates for left and right sides) for both centroid size and for (Leamyet al. 1999;Klingenberget al. 2001). For each position each of the 20 shape variables in all subsequent analyses. 2 cM apart on a given chromosome, these analyses generated This resulted in effective repeatabilities of 98% for tooth row linear combinations of the genotypic deviations and mandible centroid size and 93% for tooth row shape (Falconerand character values that resulted in pairs of canonical variables
Mackay1996). whose correlations were maximal. We conducted separate
ca-Interval mapping procedure:Interval mapping was applied nonical correlation analyses for the size and shape data and, to both the centroid size and to the 20 shape variables using for shape, used only 16 of the 20 coordinates to obtain the an approach described byHaleyandKnott(1992). Additive appropriate dimensionality (Klingenberget al. 2001).
Microsatellite markers located on chromosomes other than the one being analyzed also were used as conditioning vari-ables in each analysis to account for the effect of background QTL (Jansen1993;Zeng1994). This did reduce the effective sample size for each chromosomal run, however, since the number of available markers varied from 458 to 495 (with the exception of D5Mit47 for which only 196 individuals were available). The markers chosen for conditioning for the analy-sis of tooth centroid size were those reaching significance in preliminary stepwise multiple regression analyses. For tooth shape, we used canonical correlation to identify significant markers (although with D5Mit47 omitted to maximize the
sample size), and where several markers on one chromosome tive (a) and dominance (d) genotypic values for each of the QTL. The additive genotypic value is one-half of the difference reached statistical significance, the one with the highest
squared multiple correlation value was chosen for use (Lynch between the average phenotypic values of the two homozy-gotes and the dominance genotypic value is the difference andWalsh1998). We did not use conditioning markers on
the chromosome being analyzed, however, because the aver- between the average phenotypic value of the heterozygotes and the midpoint between the two homozygote genotypic age number of markers on each chromosome was too low for
this to be practical. Instead, we tested for the presence of two values (FalconerandMackay1996). This procedure yielded singleaanddvalues (and their standard errors) for the QTL QTL on each chromosome (see below).
For each 2-cM interval, the canonical correlation analyses for centroid size, butaanddvectors for shape that have both a magnitude and direction. The multiple regression analysis providedFapproximations to Rao’s statistic with their
associ-ated probabilities that were converted to linkage odds (LOD) also yielded squared partial multiple correlation values that were multiplied by 100 to estimate the percentage of the total scores. LOD scores represent ratios of the log10likelihood that
a QTL exists to the log10likelihood that it does not exist in variation explained by each QTL.
Since the shape data are inherently multidimensional, the that interval and were therefore used to test the null hypothesis
that no QTL was present at a given position. Significance for total magnitude of theaand dvectors for each shape QTL was quantified by calculating its length in units of Procrustes each of the putative QTL on each chromosome was tested
by comparing the LOD scores to an empirically determined distance (Klingenberget al. 2001). These additive (a) and dominance (d) shape effects were calculated as follows: threshold value. Threshold values were obtained from
permu-tation tests that were conducted for each variable (tooth size a⫽(aⴕa)0.5andd⫽(dⴕd)0.5(Klingenberget al. 2001). The overall significance of the Procrustes additive and domi-and shape) domi-and for each individual chromosome (Churchill
andDoerge1994). Each permutation test consisted of 1000 nance shape effects was tested for each QTL via a multivariate regression of the additive and dominance genotypic deviations iterations where the tooth size/shape values for each
individ-ual mouse were randomly permuted, merged with the imputed at the site of the QTL on 16 of the 20 shape variables. We also constructed diagrams using the entries for thea genotypic deviations and appropriate conditioning markers,
and then run through the canonical correlation analysis. In and d vectors for each QTL to depict the magnitude and direction of changes in shape at each landmark. Thus at each these canonical correlation runs, the highest LOD score was
recorded for each chromosome, and the 5% and 1% chromo- landmark, a line was drawn from the mean of the shape coordi-nates to a point equal to the mean plus 75 times the appro-somewise threshold values were obtained from the 50th and
the 10th highest LOD scores among each of these 1000 LOD priate entry from the a(or d) vector. In this way, the total shape effect of each QTL could be viewed in relation to the scores for each chromosome. Experimentwise threshold
val-ues were obtained from the 50th and 10th highest LOD scores anatomical context of the entire molar row. Since all of the QTL effects were rather subtle, multiplication of the additive that were observed on any chromosome during each of 1000
iterations. and dominance entries in each vector by the arbitrary factor of 75 was done simply to make these effects more visible. Thin-Once a single QTL had been found, we applied a two-QTL
model to determine if a second QTL was also present on that plate splines as used byKlingenberget al. (2001) to depict landmark shifts in the mandible were not used here because chromosome. Canonical correlation runs were computed for
the size and shape variables with the genotypic deviations (and they represent deformations that are only approximate be-tween points, and the irregularity of the mandibular molar appropriate conditioning markers) from all possible pairs of
locations on each chromosome. We subtracted Bartlett’s V row outline would have made these between-point estimations even more subject to error.
statistic (distributed as2) that was obtained from the
one-QTL model from Bartlett’s V obtained from the two-QTL Patterns of QTL effects:Once tooth shape QTL had been identified, we tested whether the effects of these QTL were model. If this value exceeded the critical2value for 2n⫽2
d.f. for centroid size or 2(2n⫺ 4)⫽ 32 d.f. for shape, we primarily restricted to individual molars (morphological inte-gration) or were dispersed fairly equally among all three of concluded that two QTL were present at the pair of locations
that produced the maximal LOD score for that chromosome the molars. To accomplish this, for all QTL we first calculated Procrustesaanddvalues for each of the three molars. (Leamyet al. 1999).
Confidence intervals for each QTL were constructed using This was done for each molar by using only the landmark points on that molar (although point 3 was used for both M1 the one-LOD rule (LynchandWalsh1998). Using this rule,
95% confidence limits were determined by the interval on and M2, and point 7 for both M2and M3; see Figure 2). Then we calculated Pearsonian correlations of thesea(andd) either side of the putative QTL location, where there was a
1.0-unit drop in the LOD score. For chromosomes that con- values for each pair of molars (M1-M2, M1-M3, M2-M3) and evaluated their significance using the sequential Bonferroni tained a second QTL, we ran one-QTL models that partialed
out the effects of one of the QTL and then applied the one- procedure (Rice1989). A significant correlation was inter-preted to mean that the magnitude of thea(ord) effects LOD rule to these LOD scores to establish the 95% confidence
interval for the remaining QTL (Leamyet al. 1999). All QTL of the QTL was similar across the two molars and thus that they were not genetically independent, whereas a nonsignificant locations and confidence intervals were expressed by the
dis-tance from the nearest proximal marker and by the disdis-tance correlation suggested genetic independence of the two molars (Leamyet al. 1999).
from the centromere. The distance from the centromere to
the most proximal marker was obtained from theMouse Ge- We also ran a PCA on the entries of theaanddvectors for each of the shape QTL (Jolliffe1986; Klingenberget al.
nome Database(2000).
Estimation and depiction of QTL effects:Once QTL posi- 2001) to determine whether the QTL effects on tooth shape were clustered into distinct groups. If found, this would sug-tions were determined for each chromosome, multiple
regres-sions of each character on the genotypic deviations for the gest that there are recurrent patterns that compress most of the variation among the QTL effects into a very small number QTL at that point on each chromosome were run, again
in-cluding the same appropriate conditioning markers as were of dimensions (Klingenberget al. 2001). Separate PCAs were run on the covariance, rather than correlation, matrices of used in the canonical correlation analyses. The individual
addi-nate this common scale for shape variation (Dryden and
Mardia1998;Klingenberg andMcIntyre 1998). Compo-nent scores for the first principal compoCompo-nent (PC) were plot-ted against those of the second PC to facilitate inspection of the patterns of these effects.
QTL co-occurrence tests:QTL for mandible shape ( Klin-genberget al. 2001) and skull dimensions (Leamyet al. 1999) previously have been discovered in our mice, and it seemed natural to ask whether some of these QTL were the same as those we identified as affecting tooth shape. To accomplish this, we first searched for all QTL affecting tooth shape that mapped within the confidence intervals of the QTL for the other characters. Then for each appropriate pair of QTL, we made use of an approach recently developed byCheverud
(2000) that tests whether QTL for two sets of characters map to the same position on a chromosome or to different positions. This approach commenced by first determining the most likely chromosomal positions for each character set (tooth shape, mandible shape, and skull characters) as well as that for each combination of two-character sets (tooth shape with mandible shape, for example), using the canonical correlation procedure with conditioning markers as already described. For all chromosomes exhibiting two QTL, conditioning also was done for the genotypic deviations at the position of the QTL not being analyzed. A chi-square value for the model fitted to one character set was obtained at its most likely posi-tion, and a second chi-square value was obtained at the most likely combined trait position, both by controlling for variation in the second set of characters. This process was repeated for the second set of characters while controlling for variation in the first set, and again two chi-square values were identified. The differences between the pairs of chi-square values so gen-erated were added to yield the final chi-square test statistic that was considered to have 1 d.f. (Cheverud2000). A signifi-cant chi-square value indicated it was likely that there were two separate QTL involved, whereas a nonsignificant chi-square value suggested that a single QTL may be affecting both groups of characters (Cheverud2000). In applying this test, the sequential Bonferroni procedure (Rice1989) was used to ensure an experimentwise error rate of no greater than 5% among the comparisons.
It should be emphasized that the test described above is designed to detect common effects of a gene in a specific interval on a chromosome, which is the conventional interpre-tation of pleiotropy in QTL studies (KnottandHaley2000). However, the test cannot distinguish pleiotropy in the strict sense (that due to common effects of a QTL at the nucleotide level) from effects potentially due to closely linked QTL in that specific region. This is especially true for F2populations derived from original intercrosses of inbred lines that exhibit linkage disequilibrium upon which QTL studies depend. Be-cause significant associations of character sets found in these tests could in some cases be due to closely linked genes rather than to pleiotropy in the strict sense, we refer to these associa-tions as evidence of “co-occurrence of QTL” rather than of pleiotropy.
RESULTS
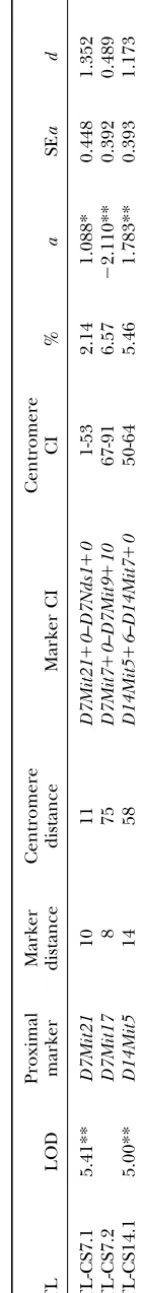
QTL for centroid size:The locations and confidence intervals for all QTL significantly affecting tooth cen-troid size are summarized in Table 1 (see also Figure 1). Each QTL in Table 1 is designated as QTL-CS fol-lowed by its chromosome number and an extension of 1 or 2 to indicate whether it was the first or second QTL
TABLE 1 QTL for molar centroid size Proximal M arker C entromere Centromere QTL LOD marker distance distance Marker CI CI % a SE ad SE d QTL-CS7.1 5.41** D7Mit21 10 11 D7Mit21 ⫹ 0 – D7Nds1 ⫹ 0 1-53 2.14 1.088* 0 .448 1.352 0.750 QTL-CS7.2 D7Mit17 87 5 D7Mit7 ⫹ 0 – D7Mit9 ⫹ 10 67-91 6 .57 ⫺ 2.110** 0 .392 0.489 0.591 QTL-CS14.1 5.00** D14Mit5 14 58 D14Mit5 ⫹ 6 – D14Mit7 ⫹ 0 50-64 5 .46 1 .783** 0.393 1.173 0.632 Each QTL is designated as QTL-CS followed b y its chromosome number a nd an extension of 1 o r 2 to indicate whether it was the first or second QTL on that chrom osome. Locations and confidence intervals (CI) are given in terms o f the distance from the n earest proximal m arker and from the centromere. LOD scores from the significance tests and the percentage o f effect for each QTL are provided. Additive ( a ) a nd dominance ( d ) g enotypic values a nd their standard errors (SE; all ⫻ 10 2) obtained from multiple regressions also are given. * P ⬍ 0.05; * * P ⬍ 0.01.
analyses revealed three QTL for centroid size, two on appears to have additive effects on only one molar such as the M3, even though some QTL, such as QTL-chromosome 7 and one on QTL-chromosome 14, whose LOD
scores exceeded the 1% experimentwise value of 4.004. TSH1.1, QTL-TSH1.2, and QTL-TSH18.1, for example, have obviously large effects on the M3. Dominance ef-(Six other QTL reached chromosomewide significance
levels, including five of them at the 1% level, but we fects for these QTL also show great variability, although the overall magnitude of these effects is quite prominent report here only QTL reaching the experimentwise level
of significance). Confidence intervals for these three for some QTL such as TSH1.1, TSH1.2, QTL-TSH12.1, and QTL-TSH13.1. Again, however, these ef-QTL range between 14 and 53 cM with an average value
of 30 cM, although this average is a slight underestimate fects do not appear localized in any one molar. There are some discernible trends among these shape because the confidence interval for the QTL on
chromo-some 14 includes an extreme marker. changes, however, one being a combination of an ante-rior-posterior decrease in the M1with an increase in the These three QTL account for 2.1–6.6% of the total
variation in centroid size or, on average, 4.7% (Table M2. This trend is present among theavectors of three QTL (QTL-TSH1.2, QTL-TSH2.1, and QTL-TSH12.2), 1). The additive genotypic values for two of the three
QTL are positive (and statistically significant), indicat- although the opposite effect (anterior-posterior increase in M1 and decrease in M2) is seen for QTL-TSH1.1, ing that the alleles from the Large strain increase the
centroid size of the mandibular molars for these QTL QTL-TSH3.1, and QTL-TSH7.1. The dominance effects appear relatively less coordinated than the additive ef-whereas the reverse is true for the other QTL. Absolute
a values range between 0.011 and 0.211 mm and aver- fects for most QTL, even for those exhibiting large dom-inance effects. Domdom-inance effects for one QTL (QTL-age 0.016 mm, greater than the aver(QTL-age of 0.010 mm
for the absolute dominance genotypic values. The ratio SH11.1) do show anterior-posterior expansion of the M1with contraction of the M2, but, in general, patterns of the mean (absolute) dominance and additive (d/a)
genotypic values is 0.60, which suggests that the larger- among these dominance effects are more difficult to discern.
effect alleles of the QTL for centroid size are, on
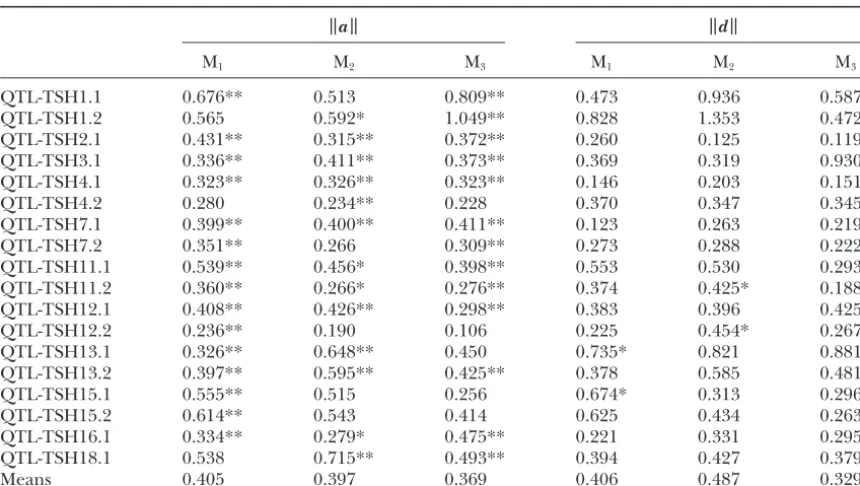
aver-age, partially dominant to the smaller-effect alleles. Analysis of shape QTL patterns: Table 3 gives the Procrustes additive and dominance values generated by However, none of the three d values are statistically
significant, so we must conclude that there is no evi- each of the shape QTL for each of the three molars. The a values vary from 0.0011 to 0.0105 (values in dence for dominance for these QTL for tooth centroid
size. Table 3 are⫻100), although the means for each tooth
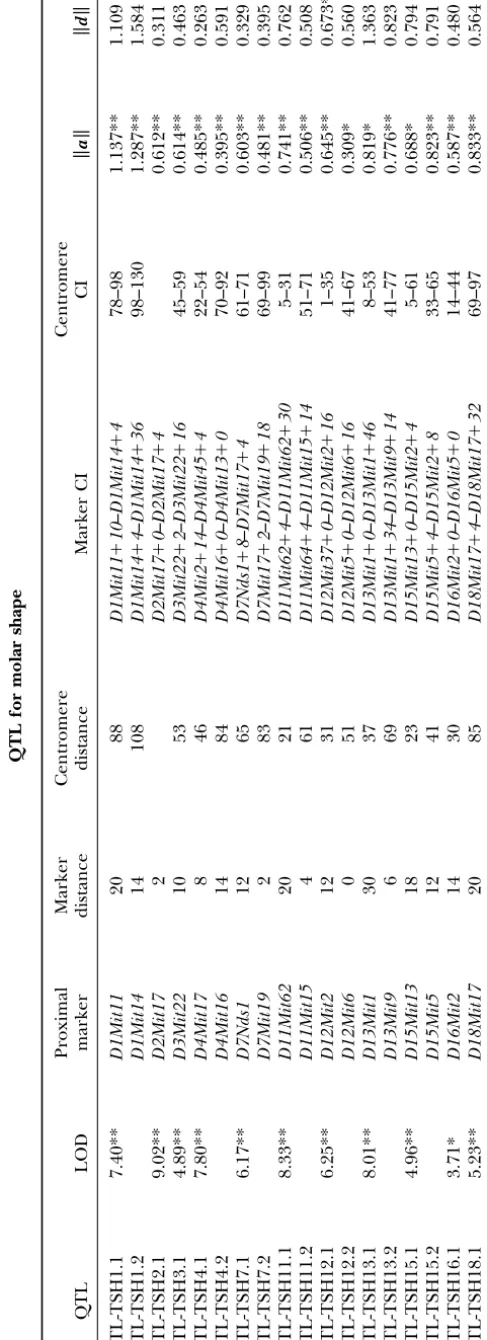
are not significantly different (P⬎ 0.05). Correlations QTL for shape:Tooth shape is influenced by 18 QTL
that reached the 5% (3.476) or 1% (4.185) experi- of these a values for the M1-M2, M1-M3, and M2-M3 combinations are⫹0.63,⫹0.62, and⫹0.55, all of which mentwide significance levels (Table 2 and Figure 1).
These QTL are located on 11 of the 19 chromosomes, are significant (P ⬍ 0.05) after sequential Bonferroni adjustment. The dvalues for the 25 QTL also vary 7 of which carry 2 significant QTL. The confidence
intervals for these 24 QTL average 28 cM and range considerably (from 0.0009 to 0.0135), but again their means do not differ among the three molars (P⬎0.05). between 10 and 56 cM. Again, this average is an
underes-timate because several of the QTL have confidence in- Their pairwise correlations among the three molars,
⫹0.71,⫹0.59,⫹0.71, are somewhat higher than those tervals that include one extreme marker.
The Procrustesavalues (⫻100 in Table 2) for all for theavalues, and, again, all three are significant (P⬍0.05). These results suggest that both the additive 18 QTL are significant, ranging from 0.00309 to 0.1287
and averaging 0.00686. The Procrustesdvalues aver- and dominance effects of the shape QTL are similar among the three molars and thus that these molars are age 0.00687, but only one value is statistically significant,
suggesting that there is little detectable dominance in not genetically independent structures.
The first two principal components generated from the tooth shape QTL. The meand/aratio for these
shape QTL is 1.00, which is not significantly greater a principal components analysis of the additive and dominance shape vectors account for 68.2% of the varia-than the d/a ratio for centroid size of 0.60 (P⫽ 0.11;
one-tailed Kruskal-Wallis test). Dominance values are tion among the a vectors and 69.8% of the variation among the d vectors. This suggests that most of the larger than additive values for only 1 of the 3 QTL for
centroid size and for 9 of the 18 QTL for shape, al- variation among the shape effects is concentrated in 2 of the 16 available dimensions (recall that 4 dimensions though again this difference is not significant (P ⫽
0.41). Thus there is no evidence that dominance is more were lost as a result of Procrustes superimposition). The phenotypic effects of the first two PCs from the separate important in the QTL for shape than in those for size.
Diagrams that depict the landmark shifts quantified analyses of additive and dominance effects are depicted in Figure 4. The first PC from the analysis of additive by thea andd vectors for each of the 18 shape QTL
are shown in Figure 3. As may be seen, there is great effects reflects expansion of the M1primarily in an ante-rior-posterior direction along with an anteante-rior-posterior variability in the shape changes caused by the additive
Figure3.—Additive and dominance effects for all QTL that produce a significant effect on molar shape. Additive effects are shown in the left column while the corresponding dominance effects are shown in the column to the right. All effects are scaled⫻75.
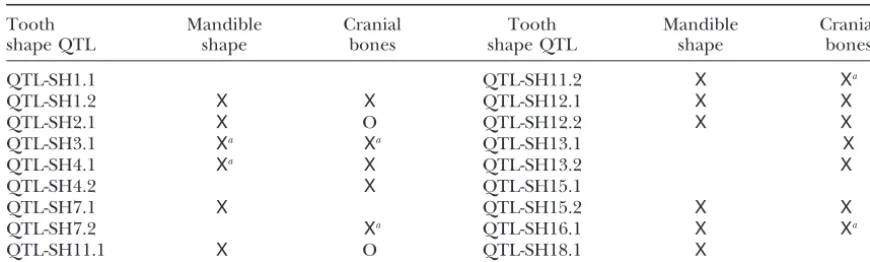
the M3. The second PC from this analysis reflects expan- Bonferroni procedure. Of the 18 shape QTL, 14 had confidence intervals overlapping those of QTL for cra-sion of the anterior portion of the M1, posterior
expan-sion of the posterior portion of the M2, lateral shifts in nial measures (Leamy et al. 1999), and 12 of these showed nonsignificant results in the QTL co-occurrence the junctions between M1-M2 and between M2-M3, and
a medial shift in the location of the M3. The first PC tests, although 4 of these 12 reached significance at the conventional level. Thus many of the tooth shape QTL from the analysis of dominance effects reflects a lateral
shift in the M1, an anterior-posterior expansion in the (or other closely linked genes) may be the same genes that affect mandible shape and cranial dimensions, and M2, and a clockwise shear of the M3. The second PC
reflects a clockwise shear of the M1and a counterclock- 8 of these apparently affect all three sets of characters. Only 2 of the 18 tooth shape QTL (QTL-SH1.1 and wise shear of the M2 and M3. Scatter plots of the first
two PCs for theaanddvectors (Figure 5) do not show QTL-SH15.1) do not appear to affect either mandible shape or the cranial bones (Table 4).
any clustering, which suggests continuous variation among the individual QTL effects.
Co-occurrence of QTL:Of the 18 tooth shape QTL,
DISCUSSION 12 had confidence intervals overlapping those of QTL
for mandible shape (Klingenberget al. 2001), and tests The basic purpose of this study was to discover any QTL affecting tooth size and especially tooth shape in of co-occurrence of QTL showed that all of these could
be genes commonly affecting both sets of characters the F2mice in order to examine their patterns of effects. We found a total of 21 such QTL, which is perhaps an (Table 4). Of 12 tests, 10 resulted in nonsignificant
(P ⬎0.05) chi-square values even at the conventional unexpectedly high number given that these QTL reflect only those loci whose alleles differ between the Large significance level, whereas the remaining 2 tests were
considerably in body weight, as already explained, and obviously were not chosen to optimize the search for QTL affecting tooth characters. The mandible tooth row of mice in the parental strains was not digitized (because of the labor involved), so the extent of the differences in tooth size and/or shape between these two strains is unknown. But it clearly must have been sufficient for us to detect so many QTL affecting these kinds of characters. On the other hand,Klingenberg et al. (2001) found a total of 37 QTL for size and shape of the mandibles in these mice, so perhaps we should have expected a large number of QTL for the teeth that, after all, form a part of the mandibles.
QTL for tooth sizevs.shape:The results of this study showed that there were many more QTL for molar shape (18) than for molar centroid size (3). A similar result was found byKlingenberget al. (2001) who identified 12 QTL for centroid size and 25 QTL for shape of the mandibles in these mice. And, using more landmark points on the mandible,Cheverudet al. (1997) discov-ered 26 QTL that affected various distances between these landmarks, only 6 of which were distances across the entire mandible (size measures). These results all suggest that the genetic basis for size, at least in teeth and mandibles, is simpler than that for shape. Although many explanations are possible, perhaps this has come about because the development of overall size is largely controlled by the endocrine system (Shea1992). Tooth development itself is regulated by a complex interaction between epithelial cells of the gubernaculum dentis and cells from the cranial ectomesenchyme (Marks and Schroeder1996), so it is easy to imagine that the final shape of the mandibular molar row requires the contri-bution of many genes.
In Drosophila,Laurieet al.(1997) found several QTL that appeared to influence both size and shape differ-ences in the posterior lobe (a male-specific genitalic structure) in several species, although their measure of shape may have been mechanistically connected with size in this structure (Liuet al. 1996;Laurieet al. 1997). More recently,Zimmermanet al. (2000) used both re-combinant inbred (RI) lines and a backcross population of Drosophila to search for QTL affecting wing size and shape. They discovered 37 QTL in the RI lines and 13 QTL in the backcross population that affected shape, but only 8 QTL that affected overall wing size. They concluded that different genes controlled different as-pects of shape in each region of the wing and that overall wing shape probably is determined by the length and positioning of wing veins that, in turn, are regulated by various growth factors (Zimmermanet al. 2000).
Beyond the differences in the number of QTL ex-erting effects on tooth size and shape, it should be
Figure3.—Continued.
TABLE 3
Procrustes additive and dominance shape effects for each of the three molars
a d
M1 M2 M3 M1 M2 M3
QTL-TSH1.1 0.676** 0.513 0.809** 0.473 0.936 0.587 QTL-TSH1.2 0.565 0.592* 1.049** 0.828 1.353 0.472 QTL-TSH2.1 0.431** 0.315** 0.372** 0.260 0.125 0.119 QTL-TSH3.1 0.336** 0.411** 0.373** 0.369 0.319 0.930 QTL-TSH4.1 0.323** 0.326** 0.323** 0.146 0.203 0.151
QTL-TSH4.2 0.280 0.234** 0.228 0.370 0.347 0.345
QTL-TSH7.1 0.399** 0.400** 0.411** 0.123 0.263 0.219 QTL-TSH7.2 0.351** 0.266 0.309** 0.273 0.288 0.222 QTL-TSH11.1 0.539** 0.456* 0.398** 0.553 0.530 0.293 QTL-TSH11.2 0.360** 0.266* 0.276** 0.374 0.425* 0.188 QTL-TSH12.1 0.408** 0.426** 0.298** 0.383 0.396 0.425* QTL-TSH12.2 0.236** 0.190 0.106 0.225 0.454* 0.267 QTL-TSH13.1 0.326** 0.648** 0.450 0.735* 0.821 0.881 QTL-TSH13.2 0.397** 0.595** 0.425** 0.378 0.585 0.481* QTL-TSH15.1 0.555** 0.515 0.256 0.674* 0.313 0.296 QTL-TSH15.2 0.614** 0.543 0.414 0.625 0.434 0.263 QTL-TSH16.1 0.334** 0.279* 0.475** 0.221 0.331 0.295 QTL-TSH18.1 0.538 0.715** 0.493** 0.394 0.427 0.379
Means 0.405 0.397 0.369 0.406 0.487 0.329
Procrustes additive (a) and dominance (d) effects for each QTL are⫻100. *P⬍0.05; **P⬍0.01.
(compared to the size) QTL for the teeth, as was found remains an open question and may vary among different structures.
byKlingenberget al. (2001) for the mandible, but this
hypothesis is not statistically supported by our data. Only Spatial patterns of shape effects:A major thrust of this study was to determine if the three molars represent 1 of the 18dvalues reached statistical significance,
perhaps because of the limited statistical power for de- genetically independent structures. We thought that the M3especially might show some independence in these tecting dominance in this kind of QTL study (
Klingen-berget al. 2001). Interestingly, the QTL for Drosophila tests since in house mice it lags behind the other two molars in its development (Cohn 1957) and is suffi-wing size discovered by Zimmermanet al. (2000) were
largely dominant in their effects, whereas those affecting ciently small that it often is regarded as semivestigial (Bader 1965b). Further, phenotypic and/or genetic wing shape exhibited mostly additive effects. Thus the
relative importance of dominance in the QTL influenc- correlations between M1and M2tend to be higher than those between M1and M3or M2and M3, and the width ing size and shape in morphological structures clearly
of the M3generally has a smaller heritability than widths of the M1or M2(Bader1965a,b;BaderandLehmann 1965; Leamy and Touchberry 1974). For example, Bader(1965a) found that the genetic correlation be-tween the widths of the M1and M2(0.81) in house mice was greater than that between the M1and M3(0.50) or the M2and M3(0.57). Finally, some genes already known in the mouse (Cd andArg 31, a missense mutation in the homeodomain ofMsx-1) affect the development of the M3 differently than the M1and M2(Grewal1962; Gruneberg1965;Vastardiset al. 1996).
But there is no evidence that the M3 or any of the molars in our population of mice is genetically indepen-dent from the others, at least as judged by the signifi-cantly high correlations ofaanddvalues between each pair of molars. These correlations were slightly lower in magnitude for the M1-M3and M2-M3, compared
Figure4.—First and second PCs calculated from the
Figure5.—Scatterplot of first and second prin-cipal component scores for the additive and domi-nance values for molar shape. (Top) Results from the additive values; (bottom) results from the dominance values.
significant suggests that both the additive and domi- of an intercross population derived from some other pair of inbred strains.
nance effects of most of the shape QTL were common
to all three molars. This result seems somewhat surpris- Ordination of QTL effects via principal components analysis also did not show any separate clustering of ing in view of the developmental and size differences
between the M1or M2vs.the M3. But it is the differences effects on the M1 and M2 vs. those on the M3. Such clustering might have been expected if these two (or in the magnitude of genetic correlations among these
pairs of molars that are more relevant to our expectation other) groups of characters represent morphologically integrated, developmentally distinct units (Olsonand that some QTL might affect primarily only one (or two)
molars, and these genetic differences (Bader 1965a) Miller 1958). Thus if the concept of morphological integration holds, pleiotropic effects of genes should are perhaps not that great when we take into
consider-ation the well-known difficulties associated with their produce phenotypic effects that form clusters according to the developmental or functional relationships among precise estimation (FalconerandMackay1996). It is
also possible that some QTL that affect the M3more so the characters that are influenced by these genes. Since we found no clustering among the shape effects of the than the M1 or M2simply were not segregating in our
TABLE 4
Results of QTL co-occurrence tests
Tooth Mandible Cranial Tooth Mandible Cranial
shape QTL shape bones shape QTL shape bones
QTL-SH1.1 QTL-SH11.2 X Xa
QTL-SH1.2 X X QTL-SH12.1 X X
QTL-SH2.1 X O QTL-SH12.2 X X
QTL-SH3.1 Xa Xa QTL-SH13.1 X
QTL-SH4.1 Xa X QTL-SH13.2 X
QTL-SH4.2 X QTL-SH15.1
QTL-SH7.1 X QTL-SH15.2 X X
QTL-SH7.2 Xa QTL-SH16.1 X Xa
QTL-SH11.1 X O QTL-SH18.1 X
Xindicates that co-occurrence was detected between the shape QTL listed at the left and a QTL affecting mandible shape or the cranial bones. “O” indicates a pair of QTL with overlapping confidence intervals that do not show co-occurrence.
aChi-square values reaching conventional, but not sequential, Bonferroni significance.
a genetic or developmental unit that is distinct from TSH7.1. Another example of a potential candidate gene isCol1a1, which maps reasonably close to QTL-TSH11.2. the M3. Instead, it seems clear that the QTL effects
on molar shape are continuously distributed along two This gene codes for the procollagen precursor molecule of the␣1 chain of type I collagen, which is of particular primary patterns in shape variation (denoted by the
first two principal component axes). These findings are importance in the extracellular matrix of dentine (Li et al. 1995). These and other genes may be possible similar to those of the previous study on mandible shape
in mice (Klingenberget al. 2001). candidates for the QTL that we have found affecting tooth row size and/or shape, but much more mapping Comparisons with known genes:Developmental
biol-ogists have identified⬎50 genes that are known to in- in an advanced intercross or other such population sub-jected to greater amounts of recombination will be nec-fluence the development of teeth (Mouse Genome
Database2000). Although many of these genes facili- essary before we can be more certain of the locations of these QTL.
tate events that are basic to the development of all teeth,
several genes may influence dental adaptations. For ex- In addition to these potential candidate genes, our tests for QTL co-occurrence suggested that a number ample,Activin beta-Aand the distal-less genesDlx-1and
Dlx-2 have all been found to influence the maxillary of QTL for tooth row shape may have effects on overall mandible shape (Table 4) as defined by the 5 landmark molars differently than the mandibular molars (Thomas
et al. 1997; Ferguson et al. 1998). This type of gene points used byKlingenberget al. (2001). In addition, Cheverud(2000) used 21 landmark points in the man-effect is important because it may facilitate functional
integration between the occlusal surfaces of mandibular dibles of these same mice and discovered a total of 17 QTL that had general alveolar or specific molar alveolar molars and their maxillary counterparts. Other
impor-tant examples include the crooked (cd) gene and trans- effects (Cheverud2000). Many of these 17 QTL corre-spond in location to QTL found here for molar shape forming growth factor (TGF beta-2), both of which
in-fluence molar size (Grewal 1962; Gruneberg 1965; (or centroid size), providing further evidence for the existence of genes affecting both teeth and mandibles. Sofaer1977;Chaiet al. 1994), and the effects of bone
morphogenic proteins (BMP-2, -4, and -7), fibroblast This general result is not particularly surprising, because most of the genes that influence tooth development do growth factors (FGF-4,-8, and-9), and epidermal growth
factor (EGF), all of which are active in the enamel knot, so by regulating physiological interactions between the mesenchyme of the developing alveolar bone and the which is thought to regulate shape and cusp patterns
among developing teeth (Vaahtokari et al. 1996; epithelial tissue of the enamel organ.
It was interesting that we found a potential commonal-Aberget al. 1997;ThesleffandJernvall1997;
Jern-vallet al. 1998;KettunenandThesleff1998). ity of genes affecting tooth shape and the cranial dimen-sions previously measured in these mice byLeamyet al. In spite of the rather large number of genes that
influence tooth development, there appear to be rela- (1999). This may reflect the developmental origin of the teeth and skull from the cranial ectomesenchyme tively few that map fairly closely to the QTL that we have
found for molar size and shape. One such candidate is (MarksandSchroeder1996), but whatever the case, this suggests that these QTL could have effects well
Ccnd1, which has been shown to influence tooth
QTL-Cho, M. I., andP. R. Garant, 1996 Expression and role of epidermal
genes (described above) known to affect teeth, although
growth factor receptors during differentiation of cementoblasts,
some major genes that affect teeth, such ascd, are known
osteoblasts, and periodontal ligament fibroblasts in the rat. Anat.
to have pleiotropic effects on various skeletal dimen- Rec.245:342–360.
Churchill, G. A., and R. W. Doerge, 1994 Empirical threshold
sions (Gruneberg1965).
values for quantitative trait mapping. Genetics138:963–971.
Conclusions:The results of this study parallel those
Cohn, S. A., 1957 Development of the molar teeth in the albino
previously found for mandibles in these mice (Klingen- mouse. Am. J. Anat.101:295–320.
Dryden, I. L., andK. V. Mardia, 1998 Statistical Analysis of Shape.
berget al. 2001). Thus we found more QTL for shape
John Wiley & Sons, Chichester, UK.
than for size, although we discovered that the
magni-D’Souza, R. N., T. Aberg, J. Gaikwad, A. Cavender, M. Owenet al.,
tude of dominance effects was comparable between the 1999 Cbfa1 is required for epithelial-mesenchymal interactions
regulating tooth development in mice. Development126:2911–
size and shape QTL. The effects of the shape QTL also
2920.
were dispersive and did not appear to be localized for
Falconer, D. S., andT. F. C. Mackay, 1996 Introduction to
Quantita-any given molar. The tooth shape QTL appeared to be tive Genetics. Longman, Essex, UK.
distinct from most of the genes presently known to affect Fantl, V., G. Stamp, A. Andrews, I. RosewellandC. Dickson, 1995 Mice lacking cyclin D1 are small and show defects in eye and
development of mouse molars, but many may well be
mammary gland development. Genes Dev.9:2364–2372.
the same as those affecting the shape of the mandible Ferguson, C. A., A. S. Tucker, L. Christensen, A. L. Lau, M. M. and various cranial dimensions. Matzuket al., 1998 Activin is an essential early mesenchymal signal in tooth development that is required for patterning of It is a pleasure to thank Shemelis Beyene, Marguerite Butler, Eirik the murine dentition. Genes Dev.12:2636–2649.
Cheverud, Duncan Irshick, and Natalia Vasey for help with laboratory Goodale, H., 1941 Progress report on possibilities in progeny test work, James Salisbury for assistance with the measurement of the teeth, breeding. Science94:442–443.
Christian Klingenberg for useful suggestions on an earlier version of Grewal, M., 1962 The development of an inherited tooth defect this article, and Trudy Mackay and two anonymous reviewers for useful in the mouse. J. Embryol. Exp. Morphol.10:202–211.
Gruneberg, H., 1965 Genes and genotypes affecting the teeth of revision suggestions. This research was supported in part by funds
the mouse. J. Embryol. Exp. Morphol.14:137–159. provided by the University of North Carolina at Charlotte and by
Haley, C. S., andS. A. Knott, 1992 A simple regression technique National Science Foundation grant DEB-9726433 and National
Insti-for mapping quantitative trait loci in line crosses using flanking tutes of Health grant DK-52514.
markers. Heredity69:315–324.
Jansen, R. C., 1993 Interval mapping of multiple quantitative trait loci. Genetics135:205–211.
Jernvall, J. A., T.Aberg, P.Kettunen, S.Keranenand I.Thesleff,
LITERATURE CITED 1998 The life history of an embryonic signaling center: BMP-4
induces p21 and is associated with apoptosis in the mouse tooth
Aberg, T., J. WozneyandI. Thesleff, 1997 Expression patterns of
enamel knot. Development125:161–169. bone morphogenetic proteins (Bmps) in the developing mouse
Johnson, R., B. SpiegelmanandV. Papaioannou, 1992 Pleiotropic tooth suggest roles in morphogenesis and cell differentiation.
effects of a null mutation in the c-fos proto-oncogene. Cell71:
Dev. Dyn.210:383–396.
577–586.
Bader, R. S., 1965a Heritability of dental characters in the house
Jolliffe, T., 1986 Principal Component Analysis. Springer-Verlag, New mouse. Evolution19:378–384.
York.
Bader, R. S., 1965b A partition of variance in dental traits of the
Kettunen, P., andI. Thesleff, 1998 Expression and function of house mouse. J. Mammol.36:384–388.
FGFs-4, -8, and -9 suggest functional redundancy and repetitive
Bader, R. S., andW. H. Lehmann, 1965 Phenotypic and genotypic
use as epithelial signals during tooth morphogenesis. Dev. Dyn. variation in odontometric traits of the house mouse. Am. Midland
211:256–268. Nat.74:28–38.
Klingenberg, C. P., andG. S. McIntyre, 1998 Geometric
morpho-Bei, M., and R. Maas, 1998 FGFs and BMP4 induce both
Msx1-metrics of developmental instability: analyzing patterns of fluctu-independent and Msx1-dependent signaling pathways in early
ating asymmetry with Procrustes methods. Evolution52:1363– tooth development. Development125:4325–4333.
1375.
Bleicher, F., M. L. Couble, J. C. Farges, P. CoubleandH.
Mag-Klingenberg, C. P., L. J. Leamy, E. J. RoutmanandJ. M. Cheverud,
loire, 1999 Mini review—sequential expression of matrix
pro-2001 Genetic architecture of mandible shape in mice: effects tein genes in developing rat teeth. Matrix Biol.18:133–145.
of quantitative trait loci analyzed by geometric morphometrics.
Carrasco, M. A., 2000 Species discrimination and morphological
Genetics157:785–802. relationships of kangaroo rats (Dipodomys) based on their
denti-Knott, S. A., and C. S. Haley, 2000 Multitrait least squares for tion. J. Mammol.81:107–122.
quantitative trait loci detection. Genetics156:899–911.
Chai, C., 1956a Analysis of quantitative inheritance of body size
Lander, E. S., andD. Botstein, 1989 Mapping Mendelian factors in mice. I. Hybridization and maternal influence. Genetics41:
underlying quantitative traits using RFLP linkage maps. Genetics 157–164.
121:185–199.
Chai, C., 1956b Analysis of quantitative inheritance of body size in
Lander, E. S., P. Green, J. Abrahamson, A. Barlow, M. Daleyet
mice. II. Gene action and segregation. Genetics41:167–178.
al., 1987 MAPMAKER: an interactive active computer package
Chai, Y., A. Mah, C. Crohin, S. Groff, P. Bringas, Jr.et al., 1994
for constructing primary genetic linkage maps of experimental Specific transforming growth factor-beta subtypes regulate
embry-and natural populations. Genomics1:174–181. onic mouse Meckel’s cartilage and tooth development. Dev. Biol.
Laurie, C. C., J. R.True, J.Liuand J. M.Mercer, 1997 An
introgres-162:85–103.
sion analysis of quantitative trait loci that contribute to a
morpho-Cheverud, J. M., 2000 The genetic architecture of pleiotropic
rela-logical difference betweenDrosophila simulansandD. mauritiana. tions and differential epistasis, pp. 411–433 inThe Character
Con-Genetics145:339–348.
cept in Evolutionary Biology, edited by G. P.Wagner. Academic
Leamy, L. J., 1984 Morphometric studies in inbred and hybrid house Press, San Diego.
Cheverud, J. M., E. J. Routman, F. A. M. Duarte, B. van Swinderen, mice. V. Directional and fluctuating asymmetry. Am. Nat.123:
579–593.
K. Cothran et al., 1996 Quantitative trait loci for murine
growth. Genetics142:1305–1319. Leamy, L. J., and R. S. Bader, 1968 Components of variance of odontometric traits in a wild-derived population of Peromyscus
Cheverud, J. M., E. J. RoutmanandD. K. Irschick, 1997
Pleiotro-pic effects of individual gene loci on mandibular morphology. leucopus.Evolution22:826–834.
tive genetic variance in odontometric traits in crosses of seven Schwartz, G. T., 2000 Taxonomic and functional aspects of the patterning of enamel thickness distribution in extant large-bod-hybrid lines of house mice. Genet. Res.23:207–217.
Leamy, L. J., E. J. RoutmanandJ. M. Cheverud, 1997 A search ied hominoids. Am. J. Phys. Anthropol.111:221–244.
Shea, B. T., 1992 Developmental perspective on size change and for quantitative trait loci affecting asymmetry of mandibular
char-acters in mice. Evolution51:957–969. allometry in evolution. Evol. Anthropol.1:2659–2670.
Sofaer, J., 1977 Tooth development in the ‘crooked’ mouse. J.
Leamy, L. J., E. R. RoutmanandJ. M. Cheverud, 1999 Quantitative
Embryol. Exp. Morphol.41:279–287. trait loci for early and late developing skull characters in mice:
Stafford, B. J., and F. S. Szalay, 2000 Craniodental functional a test of the genetic independence model of morphological
inte-morphology and taxonomy of dermopterans. J. Mammol.81:
gration. Am. Nat.153:201–214.
360–385.
Li, S. W., J.Khillanand D. J.Prockop, 1995 The complete cDNA
Suwa, G., T. D. WhiteandF. C. Howell, 1996 Mandibular postca-coding sequence for the mouse pro alpha 1(I) chain of type I
nine dentition from the Shungura formation, Ethiopia: crown procollagen. Matrix Biol.14:593–595.
morphology, taxonomic allocations and Plio-Pleistocene
homi-Lincoln, S., M. DalyandE. Lander, 1992 Constructing genetic
nid evolution. Am. J. Phys. Anthropol.101:247–282. maps with MAPMAKER/EXP 3.0. Ed. 3. Whitehead Institute
tech-Thesleff, I., andJ. Jernvall, 1997 The enamel knot: a putative nical report. Cambridge, MA.
signaling center regulating tooth development. Cold Spring
Har-Liu, J., J. M. Mercer, L. F. Stam, G. C. Gibson, Z-B. Zenget al., 1996
bor Symp. Quant. Biol.62:257–267. Genetic analysis of a morphological shape difference in the male
Thoday, J. M., 1961 Location of polygenes. Nature191:368–370. genitalia ofDrosophila simulansandD. mauritiana.Genetics142:
Thomas, B. L., A. S. Tucker, M. Qiu, C. A. Ferguson, Z. Hardcastle
1129–1145.
et al., 1997 Role of Dlx-1 and Dlx-2 genes in patterning of the
Lynch, M., andB. Walsh, 1998 Genetics and Analysis of Quantitative
murine dentition. Development124:4811–4818.
Traits. Sinauer Associates, Sunderland, MA.
Vaahtokari, A., T. AbergandI. Thesleff, 1996 Apoptosis in the
MacArthur, J., 1944 Genetics of body size and related characters.
developing tooth: association with an embryonic signaling center I. Selection of large and small races of the laboratory mouse.
and suppression by EGF and FGF-4. Development122:121–129. Am. Nat.78:142–157.
Vastardis, H., N. Karimbux, S. W. Guthua, J. G. Weidmanand
Marks, S. C., Jr., andH. E. Schroeder, 1996 Tooth eruption:
theo-C. E. Seidman, 1996 A human MSX1 homeodomain missense ries and facts. Anat. Rec.245:374–393.
mutation causes selection tooth agenesis. Nat. Genet.13:379–
Mouse Genome Database, 2000 Mouse Genome Informatics.
Jack-380. son Laboratory, Bar Harbor, ME (http://www.informatics.jax.
Vernon, G., 1995 The phylogenetic position of Cryptoprocta ferox
org/). (Carnivora): cladistic analysis of the morphological characters of
Olson, C., andR. Miller, 1958 Morphological Integration. The
Uni-modern and fossil Aeluroidea Carnivora. Mammalia59:551–582. versity of Chicago Press, Chicago. Yamazaki, H., T. Kunisada, A. Miyamoto, H. TagayaandS.-I.
Hay-Palmer, R. A., 1994 Fluctuating asymmetry analyses: a primer, pp. ashi, 1999 Tooth-specific expression conferred by the regula-335–364 inDevelopmental Instability: Its Origins and Evolutionary tory sequences of rat dentin sialoprotein gene in transgenic mice. Implications, edited by T. A.Markow. Kluwer Academic Publish- Biochem. Biophys. Res. Commun.260:433–440.
ers, Dordrecht, The Netherlands. Zeng, Z-B., 1994 Precision mapping of quantitative trait loci.
Genet-Rice, W. R., 1989 Analyzing tables of statistical tests. Evolution43: ics136:1457–1465.
223–225. Zimmerman, E., A. PalssonandG. Gibson, 2000 Quantitative trait
Routman, E., andJ. Cheverud, 1995 Polymorphism for PCR-ana- loci affecting components of wing shape inDrosophila melanogaster. lyzed microsatellites: data for two additional inbred mouse strains Genetics155:671–683.
and the utility of agarose gel electrophoresis. Mamm. Genome