Transactions of the 17th International Conference on
Structural Mechanics in Reactor Technology (SMiRT 17)
Prague, Czech Republic, August 17 –22, 2003
Paper # J04-6
Pressure Wave Generated in Vented Confined Gas Explosions: Experiment and
Simulation
Bretislav Janovsky1), Tadeas Podstawka2), Daniel Makovicka3), Jan Horkel1), Lukas Vejs1)
1) University of Pardubice, Dept. of Theory and Technology of Explosives, Czech Republic 2) Research Mining Institute, Inc., Ostrava-Radvanice, Czech Republic
3) Klokner Institute, Dept. Of Mechanics, Czech Technical University in Prague
ABSTRACT
Research Mining Institute, Inc., Ostrava-Radvanice in cooperation with Dept. of Theory and Technology of Explosives of University of Pardubice and Klokner Institute of CTU in Prague has done two series of experiments of methane-air mixture explosions and their impact on 14 cm thick wall.
Project was named “Modeling of pressure fields effects on engineering structures during accidental explosions of gases in buildings” and was sponsored by Grant Agency of Czech Republic (project No. 103/01/0039). The Project is aimed at deeper understanding of pressure field’s effect upon the structures. Gas explosions are much more common in real life and generated pressure waves are continuous and its positive phase duration is in the order of hundreds of milliseconds. Hence, methane-air mixture explosion was used as a blast wave generator.
At the beginning of the project it was necessary to design a geometrical configuration of the experiments, which would be similar to the average room such as larger kitchen. Desired overpressures were determined using AutoReaGas code (Century Dynamics and TNO).
This phase was followed by tests in experimental mine in Štramberk. Two masonry dams were build in the mine with cross-section area 10,2 m2 and longitudinal distance was 5,7 m giving explosion chamber with volume of 58 m3. Steel frame (size 2200 × 2575 mm) holding the tested structure was set in concrete into loaded dam. In loaded dam two vents with adjustable free cross-section were used to control maximum overpressure inside the chamber. Concentration of methane-air mixture was approximately 9,5 % (vol.) and volume of the cloud was 5,25, 10,2 and 15,25 m3 respectively. Overpressures inside the chamber were in range between 1 and 150 kPa.
Today’s simulators with basic calibration are not accurate enough for simulation of every geometry and conditions. Therefore it is necessary to perform experimental calibration of the code. After calibration of the code it is possible to make relatively accurate simulation in the similar geometry and calculate the pressure loading of the structure in any place of the simulated space.
This paper explains problems of computer modeling and compares experimental and computational results. Possibility of calibration with experimental data and use of computer code for similar geometries is outlined.
KEY WORDS: gas explosion, blast wave, AutoReaGas, CFD simulation.
INTRODUCTION
Present time is the time of enormous boom of the information technology, computer science and technology and methods of numerical solution of physical, chemical and mechanical problems. Examples could be Finite Element Method, Computational Fluid Dynamics, etc. These methods offer large potencies in 3-D solution of real problems. Unfortunately, these technologies lead very often to blind trust in the results of computer simulations. Especially in the field of the gas explosion user expectations could be very disappointed.
The experiments and their results will be described below. These experiments were used for validation of gas explosion in the geometry, which is similar to a smaller room as a kitchen. The project was mainly aimed at deeper understanding of pressure field’s effects (generated by gas explosion) upon light building structures but experimental pressure records allowed the examination and validation of simulations by AutoReaGas code (Century Dynamics).
BASIC PROCESS ASSUMPTION
It is assumed that ignition of burning occurs after explosive gas cloud is formed in the closed space. The burning is speeding up and the pressure inside still closed construction is increasing. This construction is build from different structural elements and after reaching the collapse overpressure of the weakest element that element begins to collapse and ventilating aperture establishes. The weakest element is usually a window because its glass pane breaks under overpressure about 5 kPa. With respect to size of the established vent, the amount and the concentration of gas mixture, the point of ignition and amount and size of turbulence generating elements overpressure rise continues or only falls down. In any case, maximum theoretical overpressures for confined gas explosion (about 800 kPa) are not generated.
Process of burning begins from laminar burning velocity after ignition, which has value 0,45 m.s-1 for stoichiometric concentration of methane-air mixture. Even thought this laminar burning velocity further increases the time duration of the whole process is in the order of hundreds of milliseconds. Therefore it is absolutely not possible to expect shock loading of the construction walls but instead of that continuous dynamic load of the construction should be supposed. However, regarding to time duration of the load relatively low overpressure could also cause destruction of the construction.
AutoReaGas was used to design the vents and gas cloud to generate the specific pressure field for loading of tested element in the first phase of the project. The authors have already described design of the geometry in the paper [1]. Geometry was originally designed to cover the range of the overpressures from 2 to 30 kPa.
EXPERIMENT GEOMETRY AND SET UP
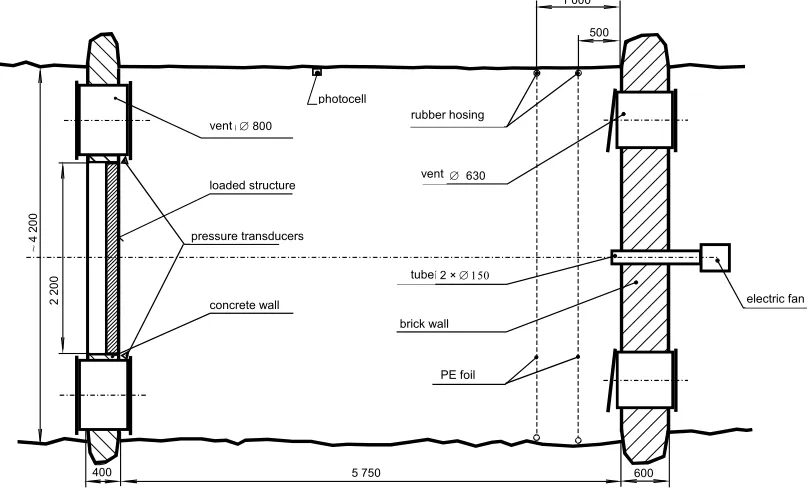
Experiments were done in the experimental mine in Stramberk, which is 300 m long. Two masonry dams were build in the mine with cross-section area 10,2 m2 and longitudinal distance was 5,7 m giving explosion chamber with volume of 58 m3. The size of the chamber is similar to larger kitchen. This geometry (Fig. 1) is suitable because it conserves not only the volume of real constructions but also the ratio of their individual walls.
~
4
20
0
2
20
0
400 5 750 600
lutna ∅ 800
cihlová příčka
betonová zeď
kotvicí hadice
cihlová zeď
fólie
ventilátor 1 000
500
LP ∅ 630
potrubí 2 × ∅ 150 fotonka
tlaková čidla
Fig. 1 Schema of the explosion room – horizontal cut
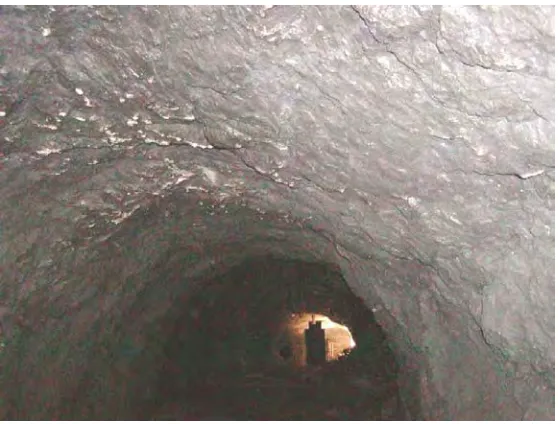
Turbulence generating elements standing on the way of the moving flame play very important role for burning acceleration. There were not used any turbulence generating elements in the experiments, but it is possible to treat the surface roughness as those elements. For the detail of the mine surface see Fig. 2.
vent rubber hosing
pressure transducers
concrete wall
tube photocell
vent loaded structure
brick wall
PE foil
Fig. 2 Surface roughness of the mine
These surface roughnesses influence the burning process only in the boundary layer alongside the walls, but it also has some significance for burning speed acceleration.
Steel frame (size 2200 × 2575 mm) holding the tested structure was set in concrete into loaded dam. In loaded dam two vents with adjustable free cross-section were used to control maximum overpressure inside the chamber. The size of free vent area was varied by slip on steel plate. The masonry dam with tested structure is shown on Fig. 3.
Fig. 3 Loaded masonry dam
140 mm thick wall was tested during the first two series of the experiments. Solid bricks of 290 × 140 × 65 mm size and strength category P10 were used for the tested wall. In the third series 290 mm thick wall was loaded. Brick density was 1800 kg.m-3 and lime-cement mortar (mark 4∼5) was used as a binder.
Methane was added into this space from pressure bottle placed outside the chamber. Mixture was mixed together with adding of the gas. Electric fan (315 mm diameter) outside the chamber with 150 mm diameter connection tube ensured the mixture homogeneity. Concentration of the methane was measured in several points with help of personal analyzers EX-METER II and EX-TEC SR5.
It is generally known that ignition method influences the gas explosion parameters. According to [2], the electric fuse was chosen for the experiment. The place of ignition was the gravity center of the cloud for the first two series of experiments. The center of masonry dam was the ignition place for the third series.
Pressure which is loading the structure, is read by two DMP 331 pressure converter systems, which incorporate dynamic pressure transducers and immediately convert the signals from those transducers to the format compatible with the data card DAQ Card-AL-16XE-50. The first data evaluation was done either in the LabVIEW environment or through digital memory ADAM-MAURER. The final evaluation was done in the MS Excel spreadsheet.
RESULTS
Problems with the gas cloud preparation and measuring apparatus had to be overcome during the first series of experiments (March 2002), therefore the experimental records and results are considered as only orientation. The results are written in the Table 1.
Table 1. Results of the first series of experiments, March 2002
Experiment
number Gas cloud length(m) Gas concentration(% vol.) Vent area(m2) Max. overpressure(kPa) Time duration(ms)
2 0,5 9,0 0,77 1,7 710
6 1,0 9,5 0,77 17,5 670
13 0,5 9,5 0,22 21,2 1380
15 1,0 9,5 0,41 38,1 910
16 1,0 9,5 0,27 44,1 1020
Big disparity of the results appeared in case of 0,5 m long cloud, because burning process is very sensitive to all factors - mainly geometrical. It should be noted that it is not simple to prepare the same homogeneous cloud every time because mixing of the gas in that short and wide cloud by fan is very difficult.
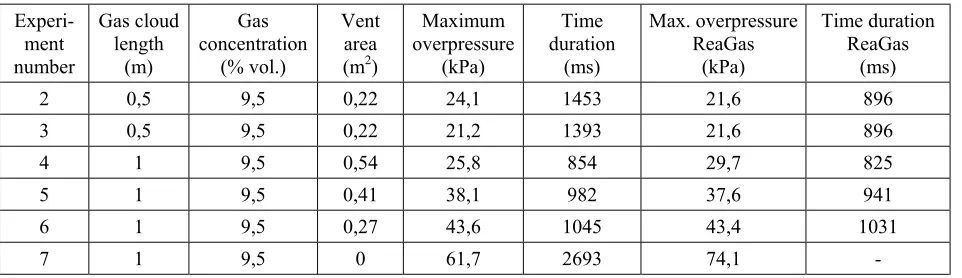
The second series of experiments brought data set, which showed clear dependency of the maximum overpressure on the vent size and was suitable for AutoReaGas calibration. Experiments´ results together with simulation results are written in the Table 2.
Table 2. Results of the second series (June 2002) of experiments and AutoReaGas simulations results
Experi-ment number Gas cloud length (m) Gas concentration (% vol.) Vent area (m2)
Maximum overpressure (kPa) Time duration (ms) Max. overpressure ReaGas (kPa) Time duration ReaGas (ms)
2 0,5 9,5 0,22 24,1 1453 21,6 896
3 0,5 9,5 0,22 21,2 1393 21,6 896
4 1 9,5 0,54 25,8 854 29,7 825
5 1 9,5 0,41 38,1 982 37,6 941
6 1 9,5 0,27 43,6 1045 43,4 1031
7 1 9,5 0 61,7 2693 74,1
of the explosion. Both constants should be relatively independent. Unfortunately, it is not true. Producer suggests using the values 0,15 for FSFS and 70 for TC respectively, but it is not clear for which geometry are these values valid. However, the only change of calibrations could not necessarily increase the accuracy of the simulation. Especially experiment number 7 showed that explosion chamber had not been very tight. Therefore some “virtual” openings had to be added into the geometry to increase the accuracy of the simulation. The problem is that it is not possible to find all the untightnesses of the system and input real size of those small openings because of the size of the chosen simulation 3-D mash. And more, the “virtual” opening could be anywhere. There were placed 50 mm diameter cylinders in the spacing of 250 mm along the walls to keep the influence of the wall roughness. AutoReaGas geometrical setup is shown in the Fig. 4.
Fig. 4 Example of the AutoReaGas geometrical setup
Record of the experiments number 5 and 7 are compared with simulation in the Fig. 5 and 6 respectively.
-5 0 5 10 15 20 25 30 35 40
0 200 400 600 800 1000 1200
Time (ms)
Overpressure (kPa)
Simulation - ZK05-H Experiment No. 5 - June 2002
-10 0 10 20 30 40 50 60 70 80
0 500 1000 1500 2000 2500 3000
Time (ms)
Overpressure (kPa)
Simulation - ZK7-AA Experiment No. 7 - June 2002
Fig. 6 Comparison of the experiment No. 7 record with simulation
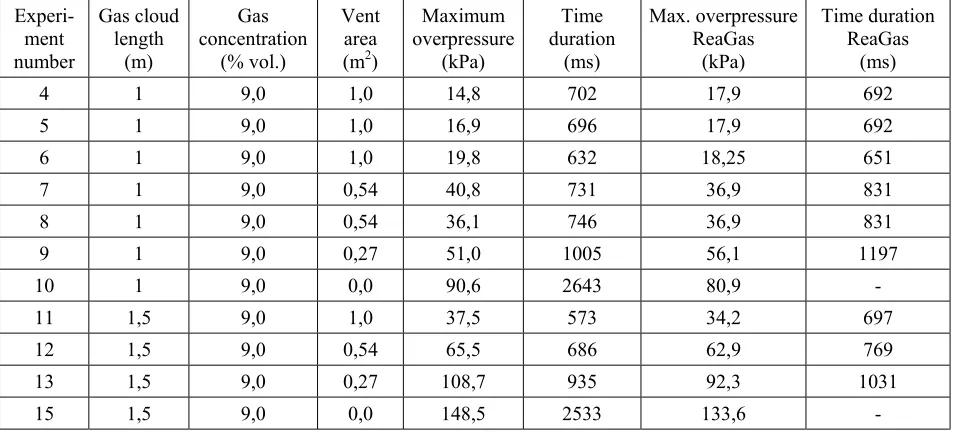
The most extensive set of the experiments was done during the third series (October 2002), when 290 mm thick brick wall was loaded. 1,5 m long cloud was also used. Results written in the Table 3 show that the system was tighter than in the last series of experiments because maximum overpressure generated during experiment No. 10 was higher than during experiment No. 7 of series from June. Therefore “virtual” opening was retained only in simulation of experiments No. 10 and 15. Point of ignition was also changed from the gravity center of the cloud to the center of masonry dam during this series of experiments. Experiment No. 6 was the first experiment with the point of ignition in the center of the masonry dam. Comparison of the experimental and simulation results is written in the Table 3.
Table 3. Results of the second series (October 2002) of experiments and AutoReaGas simulations results
Experi-ment number
Gas cloud length
(m)
Gas concentration
(% vol.)
Vent area (m2)
Maximum overpressure
(kPa)
Time duration
(ms)
Max. overpressure ReaGas
(kPa)
Time duration ReaGas
(ms)
4 1 9,0 1,0 14,8 702 17,9 692
5 1 9,0 1,0 16,9 696 17,9 692
6 1 9,0 1,0 19,8 632 18,25 651
7 1 9,0 0,54 40,8 731 36,9 831
8 1 9,0 0,54 36,1 746 36,9 831
9 1 9,0 0,27 51,0 1005 56,1 1197
10 1 9,0 0,0 90,6 2643 80,9
-11 1,5 9,0 1,0 37,5 573 34,2 697
12 1,5 9,0 0,54 65,5 686 62,9 769
13 1,5 9,0 0,27 108,7 935 92,3 1031
15 1,5 9,0 0,0 148,5 2533 133,6
experiment No. 10 (October 2002) is almost 30 kPa when the initial conditions should be the same. Comparison of the records of the experiments No. 4 and 5 and 12 are plotted on the Fig. 7 and 8 respectively.
-5 0 5 10 15 20
0 200 400 600 800 1000 1200
Time (ms)
Overpressure (kPa)
Simulation - Z10B45
Experiment No. 4 - October 2002 Experiment No. 5 - October 2002
Fig. 7 Comparison of the experiments No. 4 and 5 record with simulation
-10 0 10 20 30 40 50 60 70
0 200 400 600 800 1000 1200
Time (ms)
Overpressure (kPa)
Simulation - Z10B12
Experiment No.12 - October 2002
Fig. 8 Comparison of the experiment No. 12 record with simulation
CONCLUSIONS
It was found that gas explosions are influenced by all geometry details and it is not usually possible to discover them all. And even if they are discovered it is often not possible to input them into the code. The wall roughness and the untightness of the explosion chamber are good examples.
Processes of gas explosion are very difficult and just the codes experimentally validated in specific geometry could simulate those processes relatively accurate. It is necessary to note that it is possible to provide that kind of experiments in the Stramberk experimental mine facilities.
The authors wish to thank the Grant Agency of the Czech Republic for grant-in-aid of grant project number 103/01/0039 “Pressure fields effects modeling during emergency and accidental explosions of gases in closed buildings on engineering structures”.
REFERENCES
1. Podstavka, T., Janovsky, B., Horkel, J., Vejs, L., „Modelování účinků tlakových polí při výbuších plynů v uzavřených objektech na stavební konstrukce – I. etapa“, Sborník Mezinárodní konference Požární ochrana 2001, pp. 333, Ostrava, Czech Republic, září 2001