Color, Texture, Shape Features Based
Retrieval of Emotional Scenes
Kamatchi.T 1, Geethu.G.S 2
P.G. Student, Department of Electronics and Communication Engineering, Anna University, Tamilnadu, India1,2
ABSTRACT: Emotional grouping of images into different categories is a trivial and challenging problem in content-based image retrieval which is termed as Emotion Based Image Retrieval (EBIR). The emotional subjectivity of images plays a major role in the process of retrieval. In various scenarios, the retrieval of images based on emotions has recently received a huge interest in areas such as sentiment analysis, art galleries, and shopping websites and so on. Firstly, feature extraction is implemented using 3 feature descriptors such as Dominant Color Structure Descriptor (DCSD) for color feature extraction, Homogeneous Texture Descriptor (HTD) for texture feature extraction, and Shape spectrum for shape feature extraction. Genetically Optimized Support Vector Machine (GOSVM) is used for classification into 5 basic emotional classes proposed by Ekman such as Disgust, Fear, Happiness, Sad, and Surprise. NAPS (Nencki Affective Picture System) database is used for training and testing the images. Further, the proposed method is compared with the results of Support Vector Machine (SVM) and Least Squares SVM (LSSVM) classifiers. Experimental results of the approach are evaluated and compared with other classifiers using measures of precision and recall ratio.
KEYWORDS:Emotion Based Image Retrieval (EBIR), Dominant Color Structure Descriptor (DCSD), Homogeneous Texture Descriptor (HTD), Genetically Optimized Support Vector Machine (GOSVM).
I. INTRODUCTION
Pictures play a major role in conveying emotional messages and opinions which is recognized to be important. Social web environments like PicSearch contain lots of image content and capability to recognize different emotions in images could also help providing different views to users. In reality, the retrieval of images based on emotional semantics indicates a new and promising area of research. While addressing practical tasks such as image retrieval, it is necessary to analyze human emotional behaviors in response to images, extract the emotional semantic features of the images, and then calculate the feature similarity degree. Emotional semantics of images can be divided into scene, behavioral, and emotional semantics(higher level semantics). The emotional semantic features of images are extracted based on low-level visual features: the low-level features of images, such as color, texture, shape, and contour, are first extracted using appropriate feature descriptors. Emotional semantic annotation is a superior process in the field of digital image understanding. It is an automatic method for acquiring high-level semantics. This method provides practical image retrieval and works as an effective tool for the realization of multimedia information retrieval systems.
When implementing CBIR systems, they look for similar images, but criteria of similarity are not defined explicitly. Several factors can be taken into account such as colors, objects present in the image, its category (for instance above or below) or its emotion. The last one, depending on subjectivity, deals with the emotional content of a picture itself or an intuition it makes on a human. These systems are called EBIR and they are a subcategory of CBIR. Most of the research areas are focused on determining image mood on the basis of eyes and lip arrangement since the studies concentrate on images containing faces. In the current research, the assumption is made that emotional content is characterized by image color, texture and shape which are taken into account for feature extraction.
II. RELATEDWORK
Agarval et al., in 2014[1] proposed that color is one of the most important low level features used in emotion based image retrieval. However, using only color features to predict emotions often provide very unsatisfactory results because images with similar color do not have similar emotions. To solve the problem, the paper describe a novel algorithm for content based image retrieval based on color edge detection and Discrete Wavelet Transform which is different from other histogram based retrieval methods. The proposed algorithm generates feature vector that combines both color and edge features. This paper uses efficient wavelet transform to reduce the size of feature vectors. Sonali jain [2] explains that image is a collection of pixel values organized as rows and columns. Extracting a perfect matching image from a large collection of database is an emerging task. Image retrieval is mainly used in image processing, pattern recognition and computer vision. CBIR technique is widely used in many areas such as medical, academic, art, fashion, and entertainment. Color histogram of image is formed by dividing the graph into levels and mean and standard deviation are calculated from pixel values of each level. After extracting, all the features of the image are applied to SVM i.e. supervised learning algorithm which gives better result for image classification. Shin et al. proposed a software model to predict the emotions from images effectively with a high accuracy rate of about 92% [3]. Li et al. established a radial basis function (RBF) neural-network-based emotional classification method by mapping the relationships between color features and emotional features by means of human perception of colors for home design images based on only color features [4]. R.Senthil Kumar, in 2013 [5] proposed a Content-based visual information retrieval (CBVIR) or Content-based image retrieval (CBIR) which has been one of the most vibrant research areas in the field of computer vision over the past decade. In the medical field, digital images are produced in higher quantities for diagnostics and therapy. The Radiology Department of the university Hospital of Geneva produced more than 25,000 images a day in 2012. The cardiology field is currently the second largest creator of digital images with digital imaging and communication in medical (DICOM), a standard for image communication media has been made and information of patient can be stored together with the actual images. The main aim of this paper is to enhance the CBIR system performance using medical applications. Neha Sharma, in 2012 [6] uses Surf features. The software will search for the same images in database folder based on content properties (i.e. shape, color or texture) that are encoded into feature vectors. Before storing the image in the database the key features from image are extracted. Amanbir Sandhu et al. in 2012 [7] presents a technique for content based image retrieval extracting texture, color and shape for image analysis. The GLCM is used for texture feature extraction, histogram for Color feature extraction and for extracting shape, different factors are found like area, Euler No., eccentricity and Filled Area. The Fuzzy-C Mean algorithm (FCM) is used in the paper. Ray-I Chang et al. in 2012 [8] proposed a novel content based image retrieval system using K-means/KNN for classification. The problem with this technique is that several parameters in modules proposed in this paper are not efficiently optimized.
III.METHODOLOGY
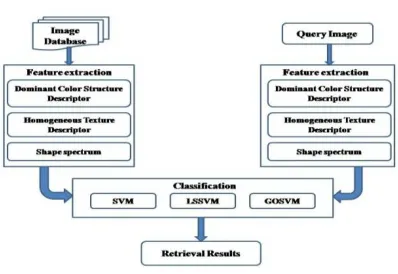
The block diagram of the proposed method is shown in Figure 1.
Fig. 1. Block diagram – Proposed method
are used for feature extraction. GOSVM is used for classifying scenes and compared with SVM and LSSVM classifiers.
Dominant Color Structure Descriptor (DCSD)
DCSD [9] combines both the compactness of DCD and accuracy of CSD so as to have a balance between computational complexity and spatial redundancy. DCD is more compact since it stores only the dominant colors. CSD is greatly accurate due to structure block scanning.
Two main processes are needed for generating a dominant color structure histogram.
Color Quantization
Structure Block scanning
Color Quantization is done based on the method used in DCD while structure block scanning is based on scanning the image region using a structuring window.
Color Quantization
Given a set of quantizing colors = { , , … . . } obtained from k-means clustering algorithm, a closest
quantizing color,
= | min , ∈ (1)
is found for an image pixel with color value at location (x,y). The pixel is quantized to
= , , <
, ℎ (1)
where , is the distance between the original color and closest representative (dominant) color. The threshold
can be in the range of 15-20 and = 20 is selected in these experiments. The color of each pixel is quantized
to the closest color in the dominant colors set if the color distance , between the original pixel and the
closest dominant color is smaller than a threshold . All other pixels will be rejected.
Structure Block scanning
Color structure bins are formed by accumulation using an 88 structuring element. In each structure block scanning, the structuring element scans all the pixels covered by the entire structuring element within the image. At each pixel position inside the element, if a particular color exist in the region enclosed by the structuring element, then that is recorded by the increment of the corresponding color bin count by one. A histogram will be plotted with the bin values counting the number of times the structuring element enclosed the colors during the scanning. The histogram will then be normalized by the number of pixels that the structuring element scanned throughout the region. In DCSD, it should be noted that each bin is being normalized whereas in conventional histogram approaches, the histogram sum is being normalized. With its compactness and accuracy properties, DCSD is hence more competitive than other color descriptors in a wide range of descriptor sizes.
Homogeneous Texture Descriptor (HTD)
HTD [10] provides a quantitative characterization of texture for similarity-based matching of images. This descriptor is computed by first filtering the image with a bank of orientation and scale sensitive filters and then computing the mean and standard deviation of the filtered outputs. A bank of Gabor filters is used for filtering the images.
The computation of this descriptor is as follows [11]:
1. The frequency space is partitioned into 30 channels with equal divisions in the angular direction (at 30° intervals) and octave division in the radial direction (five octaves).The frequency layout for texture feature extraction is shown in Figure 3.2.
2. In a normalized frequency space 0≤ ≤1, the center frequencies of the feature channels are spaced equally
in 30° in angular direction such that = 30°∗ where r is angular index with ∈{0,1,2,3,4,5}.
3. In the radial direction, the center frequencies of the neighbouring feature channels are spaced one octave apart
= ∗2 , ∈{0,1,2,3,4} (2)
where s is radial index and = 3 4 is the highest center frequency.
4. The image is filtered by a bank of Gabor filters.
5. Compute the overall mean and standard deviation of the filtered images.
6. The image texture energy (e) in each of the filtered channels is then computed.
7. The deviation of the energy (d) is also computed for the filtered channels.
8. HTD is then given by
= [ , , , ,… … , , , , … … , ] (3)
The first two components of the feature vector (fDCand fSD) are the mean and the standard deviation of the image texture,
respectively. This leads to a feature vector of 62 values.
Shape spectrum
Shape spectrum is used to quantitatively characterize an object’s shape. The shape spectrum of an object is obtained by constructing a histogram of the shape index values. The shape index of a surface is not only independent of its position and orientation in space, but also independent of its scale.
Steps in shape spectrum
1. If shape is used as the feature, edge detection is the first step to extract the shape feature.
2. Here, the sobel edge detector is used to determine the edge of the object in the scene.
3. The RGB image is first preprocessed by converting RGB image to gray image and then edge detection is done.
Thus, the shape index is extracted and a histogram of the shape index is made. The process of shape spectrum results in a feature vector of 128 values.
Genetically Optimized Support Vector Machine (GOSVM)
Genetically Optimized Support Vector Machine (GOSVM) [12] is used for image classification. For the feature vectors, feature placement is not constrained by the position and they can be placed independently. The distance between two feature vectors can be optimized by arranging features in different order. So the process can be expressed as:
= ( ) = ( ) (5)
( ) = ( || ( – )|| ) (6)
where = {1, … }, = {1, … }.
where , represents the feature vector of the query image and query results obtained by the retrieval
respectively. ( − ) represents that the arrangement which appears most similar to the query image in
terms of distance ‖.‖ has to be selected.α represents ‘l’ (a subset of all possible arrangements) possible arrangements
of the feature vector. Results are returned by uniform ranking on the basis of similarity with respect to query image.
Ranking is represented as Rank(.) in Equation (3.14). GOSVM algorithm is shown below.
Input: Positive feedback set S+, negative feedback set S−and Classifier SVM C, Image Repository I Output: Classified output ym
Procedure GO-SVM RF
Generate the initial output by ranking images on the base of Euclidean distance.
Obtain S+ by user feedback.
Generate S−← {S −S+}
While S−≠ 0 do
ʘ+←Genetic Algorithm (S+)
ʘ−←negative Feedback
ym←C(Ii ,ʘ+,ʘ−) End
End
IV.EXPERIMENTAL RESULTS
To demonstrate the effectiveness of the GOSVM classifier, extensive experiments on the NAPS dataset are performed and compared against SVM and LSSVM classifiers.
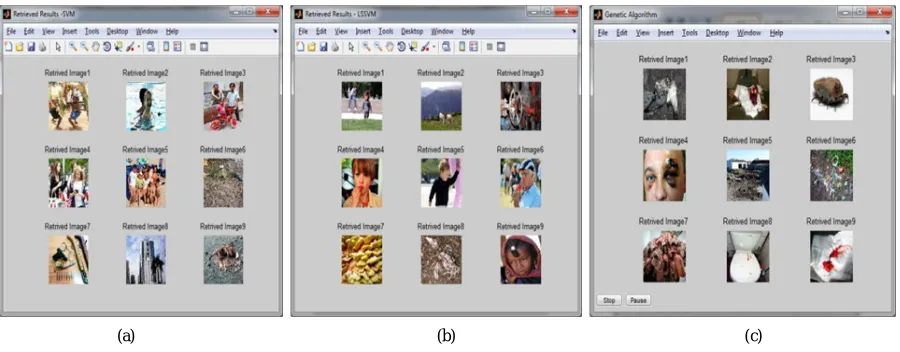
Fig. 2. Image retrieval for Disgust (a) Support Vector Machine (b) Least Squares SVM (c) GOSVM
Figure 2 shows the image retrieval results for the emotion ‘DISGUST’.
Figure 2(a) deals with SVM results, Figure 2(b) deals with LSSVM results, Figure 2(c) deals with GOSVM retrieval results.
Fig. 3. Image retrieval for Fear (a) Support Vector Machine (b) Least Squares SVM (c) GOSVM
Figure 3 shows the image retrieval results for the emotion ‘FEAR’.
Figure 3(a) deals with SVM results, Figure 3(b) deals with LSSVM results, Figure 3(c) deals with GOSVM retrieval results.
(a) (b) (c)
Fig. 4. Image retrieval for Happiness (a) Support Vector Machine (b) Least Squares SVM (c) GOSVM
Figure 4 shows the image retrieval results for the emotion ‘HAPPINESS’.
Figure 4(a) deals with SVM results, Figure 4(b) deals with LSSVM results, Figure 4(c) deals with GOSVM retrieval results.
Fig. 5. Image retrieval for Sad (a) Support Vector Machine (b) Least Squares SVM (c) GOSVM
Figure 5 shows the image retrieval results for the emotion ‘SAD’.
Figure 5(a) deals with SVM results, Figure 5(b) deals with LSSVM results, Figure 5(c) deals with GOSVM retrieval results.
(a) (b) (c)
Fig. 6. Image retrieval for Surprise (a) Support Vector Machine (b) Least Squares SVM (c) GOSVM
Figure 6 shows the image retrieval results for the emotion ‘SURPRISE’.
Figure 6(a) deals with SVM results, Figure 6(b) deals with LSSVM results, Figure 6(c) deals with GOSVM retrieval results.
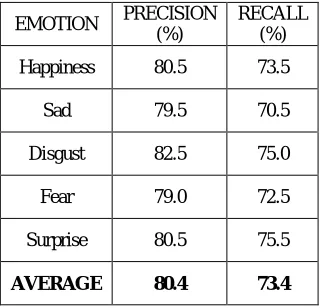
Table No. 1 Performance evaluation – GOSVM
EMOTION PRECISION
(%)
RECALL (%)
Happiness 80.5 73.5
Sad 79.5 70.5
Disgust 82.5 75.0
Fear 79.0 72.5
Surprise 80.5 75.5
AVERAGE 80.4 73.4
The results of performance evaluation for GOSVM classifier is shown in Table 1. GOSVM yields the average precision and recall rate of 80.4% and 73.4% respectively. GOSVM retrieves more positive images than other classifiers.
The proposed method is compared against SVM and LSSVM classifiers. The comparison results are shown in Tables 2 and 3.
Table No. 2 Performance evaluation – SVM
EMOTION PRECISION
(%)
RECALL (%)
Happiness 70.5 69.0
Sad 69.5 70.0
Disgust 70.0 70.0
Fear 69.0 69.5
Surprise 70.5 70.0
AVERAGE 69.9 69.7
The results of performance evaluation for SVM classifier is shown in Table 2. SVM yields the average precision and recall rate of 69.9% and 69.7% respectively.
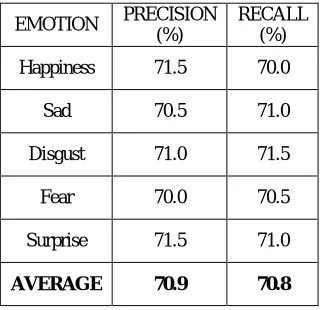
Table No. 3 Performance evaluation – LSSVM
EMOTION PRECISION
(%)
RECALL (%)
Happiness 71.5 70.0
Sad 70.5 71.0
Disgust 71.0 71.5
Fear 70.0 70.5
Surprise 71.5 71.0
AVERAGE 70.9 70.8
The results of performance evaluation for LSSVM classifier is shown in Table 3. LSSVM yields the average precision and recall rate of 70.9% and 70.8% respectively.
V. CONCLUSION
GOSVM shows its high effectiveness by retrieving more positive images than other classifiers. It shows an average precision of 80.4% and an average recall rate of 73.4%. The results can be improved by using more sensitive emotional feature descriptors. The clustering algorithm can be more generalized effectively so that the results may be better than the existing techniques.
REFERENCES
[2] Jain, Sonali. "A Machine Learning Approach: SVM for Image Classification in CBIR." Internationa Journal of Aplication or Annovation in Engineering & Management (IJAIEM), Vol. 2, No. 4, 2013.
[3] S. Baek, M. Hwang, H. Chung, and P. Kim, Kansei factor space classified by information for Kansei image modeling, Applied Mathematics and Computation, Vol. 205, No. 2, pp. 874–882, 2008.
[4] Y. Shin, Y. Kim, and E. Y. Kim, “ Automatic textile image annotation by predicting emotional concepts from visual features”, Image and Vision Computing, Vol. 28, No. 3, pp. 526–537, 2010.
[5] R.Senthil Kumar, Dr.M.Senthilmurugan, “Content-Based Image Retrieval System in Medical Applications”, International Journal of Engineering Research & Technology (IJERT), Vol. 2, No.3, 2013.
[6] Neha Sharma,“Retrieval of image by combining the histogram and HSV features along with surf algorithm”, International Journal of Engineering Trends and Technology (IJETT) – Vol. 4, No.7, 2013.
[7] Amanbir Sandhu, Aarti Kochhar, “Content Based Image Retrieval using Texture, Color and Shape for Image Analysis”, International Journal of Computers & Technology ,Vol. 3, No. 1, 2012 .
[8] Ray-I Chang, Shu-Yu Lin, Jan-Ming Ho, Chi-Wen Fann, and Yu-Chun Wang, “A Novel Content Based Image Retrieval System using K-means/KNN with Feature Extraction”, ComSIS Vol. 9, No. 4, Special Issue, 2012.
[9] Wong, Ka-Man, Lai-Man Po, and Kwok-Wai Cheung., “Dominant color structure descriptor for image retrieval. Image Processing”, 2007. ICIP 2007. IEEE International Conference on. Vol. 6. IEEE, 2007.
[10] Manjunath, Bangalore S., Philippe Salembier, and Thomas Sikora., “Introduction to MPEG-7: multimedia content description interface”, Introduction to MPEG-7: Multimedia Content Description Interface Vol. 1. John Wiley & Sons, 2002.
[11] B. S. Manjunath, Jens-Rainer Ohm, Vinod V. Vasudevan and Akio Yamada., ‘Color and Texture Descriptors’, IEEE transactions on circuits and systems for video technology, Vol. 11, No. 6, 2001.
[12] Mianshu Chen; Ping Fu; Yuan Sun; Hui Zhang, ‘Image retrieval based on multi-feature similarity score fusion using genetic algorithm’, Computer and Automation Engineering (ICCAE), 2010 The 2nd International Conference on ,Vol.2, pp.45-49, 2010.
[13] Irtaza, Aun, and M. Arfan Jaffar. "Categorical image retrieval through genetically optimized support vector machines (GOSVM) and hybrid texture features." Signal, Image and Video Processing, Vol.9, No.7, pp.1503-1519, 2015.
[14] Lai, Chih-Chin, and Ying-Chuan Chen. "A user-oriented image retrieval system based on interactive genetic algorithm." IEEE transactions on instrumentation and measurement, Vol. 60, No. 10, pp. 3318-3325, 2011.