DOI: 10.1534/genetics.104.029595
Microarray Profiling for Differential Gene Expression in Ovaries and Ovarian
Follicles of Pigs Selected for Increased Ovulation Rate
Alexandre Rodrigues Caetano,*
,1Rodger K. Johnson,* J. Joe Ford
†and Daniel Pomp*
,2*Department of Animal Science, University of Nebraska, Lincoln, Nebraska 68583 and†United States Department of Agriculture, Agricultural Research Service, Roman L. Hruska U.S. Meat Animal Research Center, Clay Center, Nebraska 68933
Manuscript received April 2, 2004 Accepted for publication June 11, 2004
ABSTRACT
A unique index line of pigs created by long-term selection ovulates on average 6.7 more ova than its randomly selected control line. Expression profiling experiments were conducted to identify differentially expressed genes in ovarian tissues of the index and control lines during days 2–6 of the follicular phase of the estrous cycle. Fluorescently labeled cDNAs derived from ovary and follicle RNA were cohybridized on microarray slides (n ⫽ 90) containing 4608 follicle-derived probes printed in duplicate. Statistical analysis of the resultingⵑ1.6 million data points with a mixed-model approach identified 88 and 74 unique probes, representing 71 and 59 unique genes, which are differentially expressed between lines in the ovary and ovarian follicles of different size classes, respectively. These findings indicate that long-term selection for components of litter size has caused significant changes in physiological control of the dynamics of follicular maturation. Genes involved with steroid synthesis, tissue remodeling, and apoptosis, in addition to several genes not previously associated with ovarian physiology or with unknown function, were found to be differentially expressed between lines. This study reveals many potential avenues of investigation for seeking new insights into ovarian physiology and the quantitative genetic control of reproduction.
E
NHANCEMENT of production efficiency through such as reproduction. The UNL selection lines provide improvement of female reproductive performance a unique genetic resource for carrying out such studies. is of major importance to the pork industry. However, Selection for components of litter size has produced an genetic improvement of swine reproductive traits has ⵑ50% difference in ovulation rate between the lines been generally slower than expected. Relatively low re- (index ovulates on average 6.7 more ova than control; sponses to direct selection for litter size have been ob- Johnsonet al.1999).tained with realized heritabilities ranging from 10 to A highly dynamic process involving recruitment, de-15% (OllivierandBolet1982;Boletet al.1989;Lam- velopment, maturation, and atresia of antral follicles
bersonet al.1991). The University of Nebraska (UNL) determines ovulation rate. The biological mechanisms has created a unique line of pigs with superior reproduc- regulating the dynamics of follicular development are tive qualities by long-term selection based on an index known to be involved with hormonal feedback mecha-of components mecha-of litter size, including ovulation rate nisms between the hypothalamus, the anterior lobe of and embryonic survival. The index and the randomly the pituitary gland, and the ovaries, which have also selected control line were derived from a closed Land- been shown to produce molecules with paracrine and race⫻Large White base population and display large autocrine functions (FoxcroftandHunter1985;
Fox-genetic and phenotypic differences in reproductive per- croftet al.1989). Gonadotropins and local factors in-formance (Johnsonet al.1984, 1999). cluding steroids, growth factors, and other regulatory Understanding physiological alterations underlying peptides are known to be involved in maturation of fol-genetic change will reveal new information regarding licles. In spite of this accumulated knowledge, many of biology of female mammalian reproduction and poten- the specific mechanisms involved in this process remain tially lead to new approaches for trait improvement. Fur- to be elucidated in greater detail.
thermore, evaluation of the physiological consequences Several genetic approaches have been taken to attempt of long-term genetic selection will provide unique insights to identify the underlying factors responsible for the into genetic architecture of complex quantitative traits ovulatory advantage observed in the UNL index selec-tion line (Pompet al.2001). A study to detect quantita-tive trait loci (QTL) affecting ovulation rate using an
1Present address: EMBRAPA Recursos Gene´ticos e Biotecnologia,
F2population derived from a cross between generations Brası´lia, DF, Brasil, 70770-900.
10 of the index and control lines (Cassadyet al.2001)
2Corresponding author:Department of Animal Science, University of
Nebraska, Lincoln, NE 68583. E-mail: [email protected] did not yield insights with biological significance. Only
ian follicle cDNA library (Caetanoet al.2003) were used for
one significant QTL for ovulation rate was detected,
making the microarray. In addition, 816 of these clones were
indicating that selection response was likely manifested
duplicated within the array. cDNA-derived probes for porcine
by changes in many genes, each with potentially small estrogen receptor, follistatin, steroidogenic acute regulatory effects. Furthermore, and similar to other such studies protein, follicle-stimulating hormone receptor, inhibin
(b)-subunit, and a set of 106 ovarian follicle cDNAs isolated in a
(Rohreret al.1999;Wilkieet al.1999), the broad
res-differential display PCR study (Gladneyet al.2004) were also
olution of QTL location renders identification of the
used. Eight commercially available clones (Incyte Genomics)
underlying genes an extremely difficult task. A study
containing intergenic regions from the yeast (Saccharomyces
cere-using a candidate gene approach also failed to reveal visiae) genome were used in duplicate as hybridization and data specific loci contributing to selection response (Lin- analysis controls. Considering all the cDNA clones and positive
villeet al.2001). and negative controls, a total of 4608 probes were prepared for
printing. Inserts were PCR amplified with primers located on
Yen(1999) proposed that the ovulatory advantage of
the cloning vector in 100-l reactions. A small aliquot of each
the index line is a result of changes in dynamics of
PCR reaction was evaluated in agarose gels for quality control.
follicle maturation during the follicular phase of the Inserts that failed to amplify (ⵑ10%, data not shown) were estrous cycle. This initiated ddPCR-based identification not replaced. PCR products were precipitated with a solution of several genes within ovarian follicles and the anterior of ethanol/NaAcetate at⫺20⬚, centrifuged, rinsed with 70% ethanol, dried at room temperature, and resuspended in 30
pituitary that are putatively expressed differentially
be-l of printing buffer (3⫻SSC and 0.1%N-lauroylsarcosine).
tween the selection lines (Bertaniet al.2004;Gladney
Microarray printing:Microarrays were printed with a GMS417
et al.2004). Evaluation of expression differences of
thou-Arrayer (Genetic Microsystems) on poly-l-lysine-coated slides
sands of genes in parallel with cDNA microarrays pre- prepared locally with standard protocols at the University of sents a powerful new opportunity to merge genetic and Nebraska Medical Center Core Facility. Each slide contained a total of 9216 features. The 4608 probes were printed over
physiological analyses and to uncover new biological
four different fields (i.e., subarrays) and an exact replicate of
connections between genes and biochemical pathways.
these was printed adjacently on each slide in fields five through
In this article we report results of a study employing
eight. Printed slides were exposed to UV light for cross-linking,
cDNA microarrays to identify genes whose ovarian ex- blocked in a succinic anhydride/sodium borate solution, and ex-pression has been changed as a result of long-term ge- cess DNA probe material was washed off in a water bath at 95⬚. netic selection for components of reproduction. Blocked slides were dehydrated in a bath of 100% ethanol, cen-trifuged, and stored in a dark, cool, and dry location until use.
RNA pooling and generation of cDNAs:Ovarian RNA from
MATERIALS AND METHODS two or three animals within selection line and treatment day was pooled. Similarly, pools of RNA were made from follicles
Collection of tissues and extraction of RNA:Gilts from a of the same size class within selection line and treatment day.
line that had undergone selection on an index of high ovula- Pooling was used to enable a greater sampling of the popu-tion rate and embryonic survival to day 50 of gestapopu-tion for lations and to optimally manage limited array and RNA re-11 generations, followed by selection for litter size for an sources. Polyadenylated RNAs complementary to probes on additional 7 generations (index line), and the respective ran- the microarray derived from yeast intergenic sequences (Yeast domly selected control line (Johnson et al.1999), were in- RNA Controls, Incyte Genomics) were added into each pool jected with a PGF2␣analog (Lutalyse, Upjohn) on day 13 of of RNA as positive controls. The Submicro Expression Array the estrous cycle (day 0 is the first day of estrus) to induce Detection Kit (Genisphere) was used for generating cDNAs luteal regression. Given that selection for ovulation rate and from each RNA pool according to manufacturer’s protocols. embryonic survival in the index line has potentially changed Microarray hybridizations and scanning:Equimolar amounts dynamics of follicle maturation during the follicular phase of
of cDNA samples from index and control line ovary pools, the estrous cycle (Yen1999), PGF2␣was used to initiate and
each collected on the same treatment day and labeled with Cy3 synchronize the follicular phase. Additional details regarding
or Cy5, were cohybridized on the same microarray slide. Each the PGF2␣ treatment have been published previously (
Ber-hybridization was replicated three times, and three additional
taniet al.2004;Gladneyet al.2004).
hybridizations were performed with a reversal of the Cy dyes. Ovaries were harvested daily at 24-hr intervals by
ovariec-Thus, a total of six hybridizations were performed with each tomy from 2–6 days after PGF2␣injection (days 2, 3, 4, 5, and
pair of pooled samples. Hybridizations were conducted over-6), weighed, and numbers of corpora albicantia (CA) counted
night at 45⬚in humidified chambers, according to instructions to determine ovulation rate in the previous cycle. Tissue
collec-provided by the Genisphere kit manufacturer. Following the tion at intervals of⬍24 hr would have required greater
preci-appropriate posthybridization washes in SSC buffer, micro-sion in determination of the expected time of ovulation in
array slides were centrifuged for drying and scanned in a Scan-gilts treated with PGF2␣. One randomly selected ovary from
Array5000 (GSI Lumonics) scanner with the following parame-each animal was snap-frozen in LN2and stored at⫺80⬚. From
ters: Cy5 [laser power, 85%; photo multiplier tube (PMT), 85%], the remaining ovary, all follicles with diameterⱖ2 mm were
Cy3 (laser power, 95%; PMT, 85%). This process was repeated dissected, measured, individually snap-frozen in LN2, and stored
with samples collected in each of the 5 treatment days. Similar at⫺80⬚. Total RNA was isolated from ovaries and follicles with
procedures were used to compare RNA pools derived from Trizol (Gibco Life Sciences, Gaithersburg, MD). Follicles were
ovarian follicles of the same size class, at each treatment day. pooled within each animal during the extraction process on the
A total of six hybridizations were performed with each of nine basis of diameter classifications (Yen1999): small follicle (SF,
pairs of samples (day 2, SF, MF1; day 3, MF1, MF2; day 4, 2–2.9 mm), medium follicle (MF1, 3–4.9 mm; MF2, 5–6.9 mm),
MF1, MF2; day 5, MF2, LF; and day 6, LF). and large follicle (LF,ⱖ7 mm). RNA integrity was checked in
Cohybridization of cDNAs from pooled ovarian RNA
la-ethidium bromide-stained agarose gels and quantity was
evalu-beled with Cy3 and Cy5: Equal amounts of RNA from each
ated by fluorometry.
of the 10 ovarian RNA pools (two lines⫻5 treatment days)
cDNA clones and preparation of microarray probes:A total
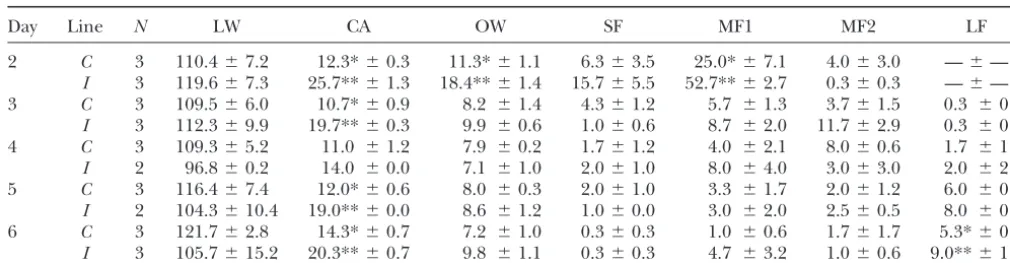
TABLE 1
Tissue weights and follicle number following PGF2␣injection of control and index line animals
Day Line N LW CA OW SF MF1 MF2 LF
2 C 3 110.4⫾7.2 12.3*⫾0.3 11.3*⫾1.1 6.3⫾3.5 25.0*⫾7.1 4.0⫾3.0 —⫾—
I 3 119.6⫾7.3 25.7**⫾1.3 18.4**⫾1.4 15.7⫾5.5 52.7**⫾2.7 0.3⫾0.3 —⫾—
3 C 3 109.5⫾6.0 10.7*⫾0.9 8.2 ⫾1.4 4.3⫾1.2 5.7 ⫾1.3 3.7⫾1.5 0.3 ⫾0.3
I 3 112.3⫾9.9 19.7**⫾0.3 9.9 ⫾0.6 1.0⫾0.6 8.7 ⫾2.0 11.7⫾2.9 0.3 ⫾0.3
4 C 3 109.3⫾5.2 11.0 ⫾1.2 7.9 ⫾0.2 1.7⫾1.2 4.0 ⫾2.1 8.0⫾0.6 1.7 ⫾1.2
I 2 96.8⫾0.2 14.0 ⫾0.0 7.1 ⫾1.0 2.0⫾1.0 8.0 ⫾4.0 3.0⫾3.0 2.0 ⫾2.0
5 C 3 116.4⫾7.4 12.0*⫾0.6 8.0 ⫾0.3 2.0⫾1.0 3.3 ⫾1.7 2.0⫾1.2 6.0 ⫾0.6
I 2 104.3⫾10.4 19.0**⫾0.0 8.6 ⫾1.2 1.0⫾0.0 3.0 ⫾2.0 2.5⫾0.5 8.0 ⫾0.0
6 C 3 121.7⫾2.8 14.3*⫾0.7 7.2 ⫾1.0 0.3⫾0.3 1.0 ⫾0.6 1.7⫾1.7 5.3*⫾0.3
I 3 105.7⫾15.2 20.3**⫾0.7 9.8 ⫾1.1 0.3⫾0.3 4.7 ⫾3.2 1.0⫾0.6 9.0**⫾1.2
Means and SE for live weight (LW), number of corpora albicantia (CA), and ovary weights (OW) for both ovaries, and number of follicles (SF, 2.0–2.9 mm; MF1, 3.0–4.9 mm; MF2, 5.0–6.9 mm; LF,⬎7.0 mm) in the dissected ovaries are shown. Day indicates the number of days after PGF2␣injection, line indicates the genetic line (C, control;I, index), andNis the number of animals per experimental group.
For each trait, means within day⫻line subclass with a different superscript (* or **) are significantly different (P⬍0.05).
split into two subsamples that were processed as two different were used for clustering analysis with different methodolo-gies provided by the software Cluster (Eisenet al.1998). Multi-treatment groups. A total of six hybridizations were performed
with these samples, as in the other experiments, providing ple probes for the same gene were excluded from this analysis. Treeview (Eisenet al.1998) was used to generate graphs of data for quality control testing of methods and analyses.
Microarray analysis:Microarray images were analyzed with the data.
Confirmation of microarray results:The same 10 pools of
the Imagene4.2 computer package (Biodiscovery). Data
gener-ated from microarray spots with problems (i.e., dust, scratches, ovarian RNA evaluated in the microarray hybridizations were used for confirmation analysis with Northern hybridization. etc.) were excluded from the final data set. Statistical analysis
was performed with a mixed-model ANOVA approach (Wol- Expression levels were evaluated for the following probes (genes): UNL-P-FN-ay-a-05-0-UNL (cytochrome P450 side chain
fingeret al.2001) using PROC MIXED from SAS (1996). An
initial model was fitted to normalize systematic effects com- cleavage), UNL-P-FN-bq-f-06-0-UNL (calpain light subunit I), and UNL-P-FN-ct-e-01-0-UNL (no match). A probe for porcine mon to all probes in a particular microarray. Residuals from
this analysis were used in a second model to estimate line glyceraldehyde 3-phosphate dehydrogenase was used to stan-dardize gel-loading differences.
effects on the relative RNA expression level for each individual probe on the array. Model 1 was
Yijklm⫽ ⫹Ai⫹Lk⫹Dl⫹(AF)ij⫹(AL)ik⫹εijklm, (1)
RESULTS whereYijklmis the base 2 logarithm of the local
background-Ovary data:Table 1 shows descriptive phenotypic data
subtracted measurement (mean pixel value) from arrayi(i⫽
1, . . . , 6), fieldj(j⫽1, . . . , 8), RNA sample from linek(k⫽ from females used in this study. Mean differences in
control, index), dyel(l⫽Cy3, Cy5), and probem(m⫽1, . . . , ovulation rate between the control and index line gilts 4608) for each treatment group;represents an overall mean
preceding tissue collections were similar to previous
value;Ais the main effect for arrays;Lis the main effect for
reports (Johnsonet al.1984, 1999;Yen1999). The lack
line;Dis the main effect for dyes;AFis the interaction effect
of a line effect in day 4 was an exception. A significant
of array and field (i.e., subarray) where the spot was located;
ALis the interaction effect of array and line; and ε is the difference between lines in ovary weight was observed
stochastic error.L andDwere fitted as fixed effects and A, only at day 2. Line differences between mean numbers AF, andALwere fitted as random effects. of follicles of a specific size class were significant for day
Model 2 was
2 MF1 and day 6 LF.
riklm⫽ m⫹Lkm⫹Dlm⫹(SA)im⫹ ␥iklm, (2) RNA expression differences in ovarian tissue:
Statisti-cally significant ovarian expression differences between
where,D, andLare as described in model 1, SA is a random
effect for each spot, and␥is the stochastic error. lines were observed for a total of 115 probes on one or
To minimize the rate of false positives, a Bonferroni correc- more treatment days. Several duplicated clones showed tion of 0.1/3636⫽2.75E-5 was used to establish a threshold similar patterns of expression, corroborating results and value of significance for the estimated line effects (L) to achieve
providing an internal check for clone/probe tracking
pro-an experimentwise false-positive rate of 0.1, considering a total
tocols. After removal of duplicated results, a total of 88
of 3636 unique probes were used. The same approaches were
used to analyze data obtained from follicle RNA samples. probes showed significant expression differences
be-Tertiary analysis of significant expression differences:Ter- tween lines on one or more treatment days (Table S1,
tiary analysis of the data was performed to identify associations published as supplemental data at http://www.genetics. between genes whose expression patterns had never been
pre-org/supplemental/). Some of these unique probes
con-viously correlated. Data collected from probes for which
statis-tained different regions of the same genes. Therefore,
tically significant differences between lines in level of ovarian
Figure1.—(A and B) Representative plots of results obtained with clones rep-licated in different regions within the microarray. (C and D) Representative plots of results obtained with probes that contained different regions of specific genes. Thex-axis contains treatment day (2–6) and the y-axis contains the esti-mated Log2of the ratio of the RNA ex-pression values for the control over the index selection lines. Error bars show standard errors for each estimate. Probes for SELENBP1 show significantly different results correlated to treatment day.
found to be differentially expressed, of which 59 are ferences arose according to treatment day (Figure 1D). The latter result suggests the presence of potential dif-homologous to genes of known function, 5 have no
known matches in GenBank, and 7 are homologous to ferences in RNA splicing between lines. Analysis of con-trol probes provides strong validation for the experimental sequences of unknown function. The mean fold
induc-tion for unique probes with significant expression differ- design and methods used in this study. Consistency ob-served for probes replicated within the array indicates ences was 2.08⫾ 0.05 with a range from 1.31 to 3.88.
RNA expression differences in follicular tissue:Statis- that estimated differences in RNA expression between the lines are repeatable.
tically significant ovarian-follicle expression differences
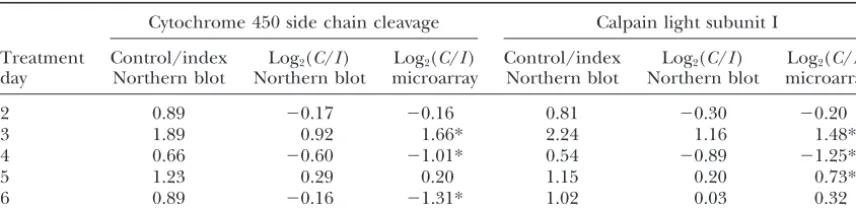
between lines were observed for a total of 83 probes in Northern hybridization analysis with individual probes:
Results obtained using microarrays and Northern hy-one or more of the day/size treatment groups. Removal
of duplicated probes resulted in a total of 74 unique bridization are in close agreement (Table 2). All differ-ences observed with Northern blots are in the same differentially expressed probes, of which 32 were also
differentially expressed in the ovary comparison (Table direction (controlvs.index line) and of similar magni-tude when compared to results obtained with microar-S2, published as supplemental data at http://www.genetics.
org/supplemental/). These follicle-based probes repre- rays. These findings confirm that the microarray analy-ses are accurate.
sent a total of 59 unique genes, of which 51 have known
function, 4 have no known matches in GenBank, and Clone UNL-P-FN-ct-e-01-0-UNL, which was differentially expressed in day 4 ovarian RNA hybridized to micro-4 are homologous to sequences of unknown function.
The mean fold induction for unique probes with sig- arrays, did not result in any detectable bands when used as a probe for Northern hybridization even after pro-nificant expression differences was 1.98 ⫾ 0.05 with a
range from 1.29 to 3.62. longed exposure. This result indicates that methods used in the microarray analysis were more sensitive in
Hybridization and data analysis controls:No probes
were differentially expressed after cohybridizing cDNAs detection of hybridized signal. derived from the same pool of ovarian RNA.
Further-more, none of the yeast positive controls were
differen-DISCUSSION
tially expressed in any of the sample groups tested.
Sig-nificant expression differences were not observed between The 50% difference in ovulation rate between the high index and control selection lines (Johnsonet al.
replicated probes (Figure 1, A and B). Figure 1 also
il-lustrates results obtained with probes that contained dif- 1999) is a result of changes in allele frequencies at mul-tiple loci caused by long-term selection for components ferent regions of the same genes. We observed examples
dif-TABLE 2
Quantification of specific genes by Northern blot analysis
Cytochrome 450 side chain cleavage Calpain light subunit I
Treatment Control/index Log2(C/I) Log2(C/I) Control/index Log2(C/I) Log2(C/I) day Northern blot Northern blot microarray Northern blot Northern blot microarray
2 0.89 ⫺0.17 ⫺0.16 0.81 ⫺0.30 ⫺0.20
3 1.89 0.92 1.66* 2.24 1.16 1.48*
4 0.66 ⫺0.60 ⫺1.01* 0.54 ⫺0.89 ⫺1.25*
5 1.23 0.29 0.20 1.15 0.20 0.73*
6 0.89 ⫺0.16 ⫺1.31* 1.02 0.03 0.32
Estimates of ovary RNA expression differences between the UNL selection lines during days 2–6 of the follicular phase of the estrous cycle, obtained by Northern hybridization and microarray analyses, are shown. Comparisons of the two methods were made with probes for porcine cytochrome P450 side chain cleavage and calpain light subunit I. Log2(C/I) indicates the log base 2 of the estimated ratio of the RNA expression levels for the control over the index selection lines. Estimates marked by * indicate statistically significant (P⬍ 2.75E-5) RNA expression differences between lines.
in the index line. The underlying hypothesis for the de- Future tertiary analysis, incorporating alternate cluster-ing methodologies, may enable discovery of new rela-sign of this experiment was that allele frequency
differ-ences between the lines result in correlated changes in tionships between genes that combine to orchestrate the process of ovarian follicle maturation and thus deter-the mRNA levels of genes expressed in ovarian tissue
during the process of ovulatory follicle selection and mine the phenotype of ovulation rate.
Rapidly growing ovarian follicles actively synthesize maturation. Using microarray expression profiling to
identify changes in RNA levels resulting from long-term estrogen and a portion of these follicles is destined to ovulate while slower growing follicles become atretic and selection for increased ovulation rate and embryo
sur-vival, our studies revealed correlated responses to selec- are reabsorbed. Experiments with RNA from whole ova-ries were designed to detect differences between selec-tion represented by robust differential expression of 71
and 59 unique genes in whole ovary and ovarian follicle tion lines in the overall process of follicular gene expres-sion, by including follicles of all sizes and physiological tissues, respectively, during the follicular phase of the
estrous cycle. Interpretations of our results should con- status. Experiments with pools of follicles of similar size were projected to search for RNA expression differences sider that post-transcriptional mechanisms can have a
significant impact on levels and functions of proteins between lines in follicle groups of similar developmental status. Discrepancies in results from the two studies may (Jansen et al. 1995; Staton et al. 2000; Wilson and
Cerione2000). also be a consequence of transcriptional contributions
from nonfollicle tissue from the whole ovary. Several genes not previously associated with the
pro-cesses of follicle selection, maturation, or ovulation were Selection for ovulation rate and embryo survival in the index line altered expression levels of genes associ-found to be differentially expressed in ovary and
fol-licle pools of the UNL index and control selection lines. ated with transport of cholesterol into the ovarian folli-cles and steroid production, processes known to change Moreover, 11 probes with blastn matches to gene
se-quences of unknown function, and 7 additional probes as follicles mature to ovulatory status (Foxcroft and
Hunter1985;Leoet al.2001;EspeyandRichards2002). with no database matches, were also identified as being
differentially expressed. These findings provide possibil- Differences in gene expression were observed in follicles of similar size between index and control lines on all 5 ities for identifying novel genes and mechanisms
in-volved in controlling the processes of ovulatory follicle days investigated, indicating that size was not definitive of physiological status. Collagen type I receptor (CD36 selection and maturation. Figure 2 shows a graphical
representation of the hierarchical clustering analysis antigen-like 1/CD36L1/SBR1/HDL receptor) was over-expressed in index line ovaries at days 2, 4, and 6 (and (Eisenet al.1998) performed with the ovarian data and
illustrates the utility of this study to identify associations in day 6 LF) while being underexpressed at day 3. Thus, the role of high-density lipoproteins (HDL) in steroido-between genes whose expression patterns had never
been previously correlated. Figure 3 shows an example genesis may be greater than previously assumed in that low-density lipoproteins (LDL) are regarded as the pri-of a representative cluster node from the hierarchical
clustering analysis containing probes with a similar pat- mary transporters of cholesterol into cells of species other than rodents (GrummerandCarroll 1988). However, tern of expression that represent genes known to be
Figure2.—Graphical rep-resentation of the hierarchi-cal clustering analysis per-formed with ovarian gene expression data. Data ob-tained for days 2–6 of the fol-licular phase of the estrous cycles are represented in the columns. Green and red rep-resent genes that were up-and downregulated in the in-dex selection line relative to the control line, respectively. Black corresponds to probes that were not differentially expressed. The yellow box highlights a group of genes within a representative clus-ter node (see Figure 3 for a graph of these genes).
(LRP8/endocytosis of LDL) is seen in index line fe- underexpressed at day 3 and in day 4 MF2. CP450SSC, cytochrome C oxidase (CCO), and 3HSD were all sig-males in ovaries on days 4, 5, and 6 and in day 4 MF1
and day 6 LF. nificantly overexpressed in the day 2 SF from index line gilts (Figure 4). Day 3 MF2, resulting from growth of the Conversion of cholesterol to progesterone requires
cyto-chrome P450 side chain cleavage enzyme (CP450SCC), day 2 MF1, also overexpress CP450SCC in the index line. However, index ovaries at day 3 expressed CP450SCC, steroidogenic acute regulatory protein (STAR), and
3--hydroxysteroid dehydrogenase (3HSD). STAR was CCO, and 3HSD at lower levels than in control ani-mals. These findings, in combination with data fromYen
Figure4.—Expression differences between genetic lines in ovarian tissue observed for genes that are directly or indirectly
Figure3.—Expression differences of genes within a repre- involved with steroidogenesis. Thex-axis contains treatment sentative cluster node (yellow box in Figure 2) from the hierar- day (2–6) and they-axis contains the estimated Log
2ratio of chical clustering analysis. Thex-axis contains treatment day the RNA expression values for the control over the index (2–6) and they-axis contains the estimated Log2ratio of the selection lines. Bars show standard errors for each estimate. RNA expression values for the control over the index selection
lines. Bars show standard errors for each estimate.
2000). We observed that PAI1 was underexpressed in index ovaries at days 2 and 3 (Figure 4), but the negative (1999), indicate that follicular maturation is delayed as relationship of PAI1 gene expression with estrogen syn-a consequence of selection for ovulsyn-ation rsyn-ate syn-and em- thesis (i.e., CYP19) was not strong. Differences between bryo survival in the index line. lines were noted only in ovaries and not in follicles, Index line gilts continue to overexpress CP450SCC indicating that primary regulation of PAI1 may not be in day 4 ovaries and MF2 and in day 6 ovaries and LF. aligned with estrogen synthesis.
Estrogen has a major role in orchestrating the ovulation Some genes associated with tissue remodeling likely process across taxa due to its endocrine, paracrine, and relate to macrophages that infiltrate the thecal layer as autocrine functions. Cytochrome P450 17-␣-hydroxylase follicles progress to ovulatory status (Wuttkeet al.1997) (CYP17), the enzyme responsible for androgen synthesis, and to the immune system as ovulation is an inflamma-was overexpressed in index gilts in day 3 MF2, day 4 MF1, tory-like process (Richards et al. 2002). We had pre-and day 5 MF1. Cytochrome P450 aromatase (CYP19), viously found expression of calpain light chain (CLSI) to the rate-limiting enzyme for conversion of androgen to be downregulated in index follicles during the follicular estrogen in porcine follicles (Corbin et al. 2003), was phase (Gladneyet al.2004). Similar results were found overexpressed in index line ovaries and MF1 on day 4. in the current study in day 3 and 5 ovaries and day 6 Although the concentration of plasma estradiol-17was LF. However, CLSI was overexpressed in index gilts in found not to differ between the selection lines during day 4 ovaries. Calpains are involved in apoptosis mecha-the entire estrous cycle (Mariscalet al.1998), the ob- nisms (Luet al.2002) and mutations of the calpain 10 served differences in RNA concentration between lines gene (CAPN10) are associated with polycystic ovarian for genes involved in the synthesis of estrogen support syndrome in humans (Gonzalez et al.2002). Current its autocrine and paracrine functions. Interestingly, no findings indicate that selection for high ovulation rate has differential expression of hormone receptor genes was altered RNA levels of CLSI and other genes associated detected. It is possible that these transcripts are found with remodeling of ovarian tissue during the follicular in excess and thus do not represent good candidates phase as a correlated response. Further investigations are for ovulation rate differences between selection lines. necessary to elucidate the biological mechanisms involved. Tissue remodeling occurs as ovarian follicles undergo Results obtained for days 2, 3, 5, and 6 indicate that maturation or atresia. We identified 24 cases of differen- animals sampled in this study were representative of the tial gene expression in ovaries and/or follicles, in genes index and control selection lines and that PGF2␣ treat-potentially associated with cellular proliferation and tis- ment resulted in previously observed patterns of follicle sue remodeling, as a result of long-term index selection. development (Yen 1999). Gilts of the index line had Plasminogen activator inhibitor 1 (PAI1) is involved in more total ovarian follicles on all of the 5 days preceding the regulation of plasmin, whose activity in follicular fluid ovulation than the control gilts did. However, index increases prior to rupture of ovulatory follicles (Politis line gilts had a significantly lower than expected mean
number of MF2 follicles, than were anticipated for this what might have occurred due to random genetic drift (Johnson et al. 1999), we consider gene expression treatment day. Therefore, results obtained for this
treat-ment day may be potentially nonrepresentative of what changes in the index line to be primarily the result of the selection process. An observed difference in mRNA would be expected for the true RNA expression
differ-ences between lines. One possible explanation is sam- levels for an individual gene is potentially the direct result of selection, with the differential expression being pling error. However, follicles from these day 4 index
gilts overexpressed genes associated with steroidogene- a manifestation of allelic variation within the gene itself (i.e., a QTL). Conversely, differences in mRNA expres-sis and support the overall conclusion of a delay in
follicular maturation in the index line. Potentially, these sion levels may result from thetrans-interaction of one or more QTL with the particular gene under study. two day 4 index gilts possessed a desirable combination
of alleles necessary to recruit more follicles into the Identification of polymorphisms within differentially ex-pressed genes, and subsequent testing for associations MF1 pool, but lacked the alleles required for selection
of greater numbers of follicles into the MF2 pool and with reproductive phenotypes in segregating popula-tions, will assist in classifying results into these catego-subsequent ovulation. Collectively, gene expression in
all index line gilts supports an altered pattern of ste- ries. We are currently identifying SNPs within the genes found to be differentially expressed in this study and roidogenesis as a consequence of selection for increased
ovulation rate. testing them for associations within the index and con-trol selection lines as well as in other commercially rele-The threshold level used to determine statistical
sig-nificance for the estimated RNA expression differences vant maternal lines of pigs. More powerfully, an inte-grated approach whereby gene expression measurements between lines was highly conservative to minimize type I
errors and to provide the primary findings from the are measured in gene mapping populations and consid-ered as phenotypes in a QTL analysis (Schadtet al.2003; study. However, this also results in a higher percentage
of type II errors, which were likely further inflated by Pompet al.2004) could directly identify those genes within which polymorphisms regulate gene expression in cis
the fact that a percentage of probes from the ovarian
follicle library (Caetanoet al.2003) were not generated and/orin trans.
It would be of interest to determine the ontogeny of because of amplification failure. Further mining of the
data set with relaxed significance threshold levels is gene expression changes caused by long-term selection. The average change detected for significantly different likely to continue to uncover novel results regarding
the genetic and physiological control of female repro- follicle/ovarian expression phenotypes in this study was approximately twofold, which would represent just be-duction in pigs. Methods such as the use of a false
dis-covery rate (Storey andTibshirani 2003) would en- low a 10% rate of change per generation when averaged across the 11 generations of selection that had taken able flexibility and a more liberal criterion while still
effectively avoiding many false positives. place, on the basis of the index of ovulation rate and embryo survival, prior to the time of tissue collection Recent publications have highlighted the importance
of technical and biological replications in the experi- (the subsequent 7 generations of selection were based on litter size, and ovulation rate likely did not change mental design of expression profiling studies with cDNA
microarrays (KerrandChurchill2001;Dobbinet al. significantly during this period). However, in the absence of comparing the lines for each generation across an 2003;Kerr2003). The experimental design used in this
study was chosen to maximize the use of both microarray extended time period, such estimates are prone to many potential sources of error. For example, selection could and biological resources available. Pooling of RNA
sam-ples within experimental group was necessary to decrease have fixed particular alleles, and thus potentially the impact on gene expression changes resulting from the the total number of microarray slides necessary while still
allowing for the accurate estimates of the mean mRNA underlying locus, prior to the time of tissue collection, causing a downward bias in the estimate of gene expres-expression-level differences between genetic lines for
the assayed genes/probes. As previously outlined (Kerr sion change per generation of selection. Alternatively, genetic heterogeneity could exist within the selection 2003) this approach has been successfully used to
pro-duce significant findings (Jin et al.2001) and is an ac- lines, and the lack of significant biological replication in the present experimental design could have led to ceptable alternative for initial groundwork as described
in the present study. Ideally a larger number of animals sampling error. Most importantly, gene expression phe-notypes are likely quantitative traits in their own right, per experimental group would have been used in a
design that would allow for the estimation of the vari- regulated by multiple loci in a complex and interactive manner (Pompet al.2004). Thus, the measurement of ance associated with the mean mRNA expression level
for each of the genes/probes studied in each swine expression at any given time point in the course of long-term selection should be viewed in long-terms of the particular line, and such a design should be encouraged in future
microarray analysis in livestock species. culmination and interaction of many events taking place at, and not the summation of individual events leading Because genetic differences in ovulation rate and
generations of selection to increase litter size. J. Anim. Sci.77: The authors thank Denny Aherin, Giovani Bertani, Christy Gladney,
541–557. Nancy Jerez, and Derek Petry for assistance with animal care, surgeries,
Kerr, M. K., 2003 Experimental design to make the most of microar-and/or dissection of ovarian tissues. We are grateful to Joa˜o L. Rocha
ray studies. Methods Mol. Biol.224:137–147. and L. Dale Van Vleck for discussion on data analysis procedures and
Kerr, M. K., andG. A. Churchill, 2001 Experimental design for to Brad Edeal for assistance with Northern hybridizations. This project gene expression microarrays. Biostatistics2:183–201.
was partially funded by a postdoctoral training grant from Cotswold Kouba, A. J., B. R. Burkhardt, I. M. Alvarez, M. M. Goodenowand Pig Development Company (United Kingdom), by a special Hatch Grant W. C. Buhi, 2000 Oviductal plasminogen activator inhibitor-1 allocation from University of Nebraska-Lincoln (UNL), and by the (PAI-1): mRNA, protein, and hormonal regulation during the estrous cycle and early pregnancy in the pig. Mol. Reprod. Dev. UNL Center for Biotechnology (Animal Molecular Biology Focus
56:378–386. Group). This material is partially based upon work supported by the
Lamberson, W. R., R. K. Johnson, D. R. ZimmermanandT. E. Long, National Science Foundation under grant no. 0091900 (Nebraska
1991 Direct responses to selection for increased litter size, de-EPSCOR infrastructure improvement grant). Mention of trade names
creased age at puberty, or random selection following selection or commercial products in this article is solely for the purpose of for ovulation rate in swine. J. Anim. Sci.69:3129–3143. providing specific information and does not imply recommendation Leo, C. P., M. D. PisarskaandA. Hsueh, 2001 DNA array analysis or endorsement by the U.S. Department of Agriculture. This work is of changes in preovulatory gene expression in the rat ovary. Biol. published as paper no. 14215 of the Journal Series, Nebraska Agricul- Reprod.65:269–276.
Linville, R. C., D. Pomp, R. K. JohnsonandM. F. Rothschild, tural Experiment Station.
2001 Candidate gene analysis for loci affecting litter size and ovulation rate in swine. J. Anim. Sci.79:60–67.
Lu, T., Y. Xu, M. T. MericleandR. L. Mellgren, 2002 Participation of the conventional calpains in apoptosis. Biochim. Biophys. Acta LITERATURE CITED
1590:16–26.
Mariscal, D. V., E. G. Bergfeld, A. S. Cupp, F. N. Kojima, K. E. Bertani, G. R., C. D. Gladney, R. K. JohnsonandD. Pomp, 2004
Fikeet al., 1998 Concentrations of gonadotropins, estradiol and Evaluation of gene expression in pigs selected for enhanced
progesterone in sows selected on an index of ovulation rate and reproduction using differential display PCR. II. Anterior pituitary.
embryo survival. Anim. Reprod. Sci.54:31–43. J. Anim. Sci.82:32–40.
Ollivier, L., andG. Bolet, 1982 Selection for prolificacy in the
Bolet, G., L. OllivierandP. Dando, 1989 Selection sur la
pro-pig. Pig News Info.3:383–384. lificite chez le porc. I. Resultats d’une experience de selection
Politis, I., A. Srikandakumar, J. D. Turner, B. K. Tsang, L.
Ains-sur onze generations. Genet. Sel. Evol.21:93–106.
worthet al., 1990 Changes in and partial identification of the
Caetano, A. R., R. K. JohnsonandD. Pomp, 2003 Generation and
plasminogen activator and plasminogen activator inhibitor sys-sequence characterization of a normalized cDNA library from
tems during ovarian follicular maturation in the pig. Biol. Reprod. swine ovarian follicles. Mamm. Genome14:65–70.
43:636–642.
Cassady, J. P., R. K. Johnson, D. Pomp, G. A. Rohrer, L. D. Van
Pomp, D., A. R. Caetano, G. R. Bertani, C. D. GladneyandR. K. Vlecket al., 2001 Identification of quantitative trait loci
affect-Johnson, 2001 Applying functional genomics research to the ing reproduction in pigs. J. Anim. Sci.79:623–633.
study of pig reproduction, pp. 277–292 inControl of Pig
Reproduc-Corbin, C. J., F. M. Moran, J. D. Vidal, J. J. Ford, T. Wiseet al.,
tion VI, edited by R. D.Geisert, H.Niemannand C.Doberska. 2003 Biochemical assessment of limits to estrogen synthesis in
Society for Reproduction and Fertility, Cambridge, UK. porcine follicles. Biol. Reprod.69:390–397.
Pomp, D., M. F.Allanand S. R.Wesolowski, 2004 Quantitative
Dobbin, K., J. H. ShihandR. Simon, 2003 Questions and answers
genomics: exploring the genetic architecture of complex trait on design of dual-label microarrays for identifying differentially
predisposition. J. Anim. Sci.82(Suppl.): E300–E312. expressed genes. J. Natl. Cancer Inst.95:1362–1369.
Richards, J. S., D. L. Russell, S. O. OchsnerandL. L. Espey, 2002
Eisen, M. B., P. T. Spellman, P. O. BrownandD. Botstein, 1998
Ovulation: new dimensions and new regulators of the inflamma-Cluster analysis and display of genome-wide expression patterns.
tory-like response. Annu. Rev. Physiol.64:69–92. Proc. Natl. Acad. Sci. USA95:14863–14868.
Rohrer, G. A., J. J. Ford, T. H. Wise, J. L. ValletandR. K. Chris-Espey, L. L., andJ. S. Richards, 2002 Temporal and spatial patterns
tenson, 1999 Identification of quantitative trait loci affecting of ovarian gene transcription following an ovulatory dose of
go-female reproductive traits in a multigeneration Meishan-White nadotropin in the rat. Biol. Reprod.67:1662–1670.
composite swine population. J. Anim. Sci.77:1385–1391.
Foxcroft, G. R., andM. G. Hunter, 1985 Basic physiology of
follic-SAS, 1996 SAS User’s Guide(Release 6.09). SAS Institute, Cary, NC. ular maturation in the pig. J. Reprod. Fertil. Suppl.33:1–19.
Schadt, E. E., S. A. Monks, T. A. Drake, A. J. Lusis, N. Cheet al.,
Foxcroft, G. R., M. G. HunterandS. A. Grant, 1989 The
physiol-2003 Genetics of gene expression surveyed in maize, mouse ogy of follicular maturation in the pig. Acta Physiol. Pol. 40:
and man. Nature422:397–402. 53–63.
Staton, J. M., A. M. ThomsonandP. J Leedman, 2000 Hormonal
Gladney, C. D., G. R. Bertani, R. K. JohnsonandD. Pomp, 2004
regulation of mRNA stability and RNA-protein interactions in Evaluation of gene expression in pigs selected for enhanced the pituitary. Mol. Endocrinol.
25:17–34. reproduction using differential display PCR and human
micro-Storey, J. D., andR. Tibshirani, 2003 Statistical significance for arrays. I. Ovarian follicles. J. Anim. Sci.82:17–31. genomewide studies. Proc. Natl. Acad. Sci. USA100:9440–9445.
Gonzalez, A., E. Abril, A. Roca, M. J. Aragon, M. J. Figueroa
Wilkie, P. J., A. Paszek, C. W. Beattie, L. L. Alexander, M. B.
et al., 2002 CAPN10 alleles are associated with polycystic ovary Wheeleret al., 1999 A genomic scan of porcine reproductive syndrome. J. Clin. Endocrinol. Metab.87:3971–3976. traits reveals possible quantitative trait loci (QTLs) for number
Grummer, R. R., andD. J. Carroll, 1988 A review of lipoprotein of corpora lutea. Mamm. Genome10:573–578.
cholesterol metabolism: importance to ovarian function. J. Anim. Wilson, K. F., andR. A. Cerione, 2000 Signal transduction and Sci.66:3160–3173. post-transcriptional gene expression. Biol. Chem.381:357–365.
Jansen, M., C. H. de Moor, J. S. SussenbachandJ. L. van den Wolfinger, R. D., G. Gibson, E. D. Wolfinger, L. Bennett, H. Hama-Brande, 1995 Translational control of gene expression. Pedi- dehet al., 2001 Assessing gene significance from cDNA micro-atr. Res.37:681–686. array expression data via mixed models. J. Comput. Biol. 8:
Jin, W., R. M. Riley, R. D. Wolfinger, K. P. White, G. Passador- 625–637.
Gurgel et al., 2001 The contributions of sex, genotype and Wuttke, W., L. Pitzel, I. Knoke, K. TheilingandH. Jarry, 1997 age to transcriptional variance in Drosophila melanogaster. Nat. Immune-endocrine interactions affecting luteal function in pigs. Genet.29:389–395. J. Reprod. Fertil. Suppl.52:19–29.
Johnson, R. K., D. R. ZimmermanandR. J. Kittok, 1984 Selection Yen, H. W., 1999 Follicular development, maturation and atresia for components of reproduction in swine. Livestock Prod. Sci. during the estrous cycle in gilts expressing high and low ovulation 11:541–558. rates. Ph.D. Dissertation, University of Nebraska, Lincoln, NE.
Johnson, R. K., M. K. NielsenandD. S. Casey, 1999 Responses in