Response of Coastal Structures against
Tsunami Forces and Mitigation Measures
A.H.L.Swaroop1, Sk.Yajdani2, S.R.K.Reddy3
Research Scholar, AU, Visakhapatnam & Assistant Professor, Gudlavalleru Engineering College, Gudlavalleru, AP India1
Associate Professor, Department of Civil Engineering, Andhra University, Visakhapatnam, AP, India2 Professor, Department of Civil Engineering, Gudlavalleru Engineering College, Gudlavalleru., AP, India3
ABSTRACT: Tsunamis are the sequences of long period sea waves generated mostly by earthquakes which occur at sea bed level. Past history and present investigations reveal that Pacific Northwest, Aleutian Island chain, Peru-Chile trench and Indian Ocean Northeast provinces could experience catastrophic earthquakes followed by tsunamis posing a significant threat to urban environs along the coastal belt. The devastating tsunamis during the great Indonesia earthquake on 26th December 2004, reminds the importance of analyzing for response of structures against tsunami forces and constructing tsunami resistant structures in coastal belts. This paper explains the physics of tsunami, tsunami forces and mitigation & preparedness strategies. In present study three typical coastal structures, with different configurations: a chimney, an overhead service reservoir and a school building are chosen for the analysis .In the analysis, the forces imparted at different levels of the structures for different inundation depths are calculated based on the guidelines provided by FEMA CCM.
Prediction of tsunamis in advance will surely be of great help in disaster mitigation programmes. Advanced countries like USA and Japan are successful in implementing the codal provisions in construction of tsunami resistant structures and enforcing tsunami warning systems and mitigation measures to minimize the death toll and damage to structures during major tsunami events, Long term administration and social plans need to be established such that protection measures become ingrained.
KEYWORDS: Tsunamis, Coastal Structures, Run up height, Inundation depth, Mitigation Measures I. INTRODUCTION
In the next half century, the urban population in the world is likely to be doubled and statistics reveal that nearly 75% of world population lives on coastal belts and is found true in India also. Geological evidences and past history records show that the frequency of occurrence of earthquake induced tsunamis increase in future and such events are considered to occur in subduction zones where an oceanic plate slides under a continental plate or other young oceanic plates. Indonesian submarine earthquake that occurred on 26th December,2004 with a Richter Magnitude 9.3, generated catastrophic tsunamis killing more than two lakh people and caused major economic impact on countries around Pacific and Indian ocean 2011 Japan,1999 Izmit,1995 Kobe and 1964 Alaskan earthquakes are other examples which triggered tsunamis causing sediment erosions and damage many coastal settlements .Such mega events reminded coastal community alert on the preparedness against ground shaking and followed by subsequent tsunami effects.
Tsunami resistant analyses are complex in nature as the motion is transient and the force functions are time dependent. Though there are no well established design procedures, FEMA CCM and draft code of Bureau of Indian Standards provide some guidelines to calculate tsunami loads act on coastal structures.
With available technology in place, it is possible, even 15 minutes after an undersea earthquake occurs, to determine the path and strength of approaching tsunami so that warnings could be issued to vulnerable coastal regions to take evacuation measures, Tsunami waves can be sensed by ocean instruments and then the data is transmitted to the warning centre on the shore. An early warning system with network of sensors is already founded in Pacific Ocean and monitoring centres were established in Alaska, US , Hawaii and Japan.
It is also important to prepare the coastal community with a disaster mitigation map and the public can be made aware of the risk of tsunamis and trained how to act during and after a gigantic tsunami strikes the coast so that death toll and damage to structures can be minimized.
II. PHYSICS OF TSUNAMIS
Tsunamis are series of sea waves of extremely long wave length and long period generated when seafloor abruptly lifts up pushing the entire water column vertically upwards.
As the tsunami crosses deep ocean ,its wave length from crest to crest may be a few hundred kilometres but its height will only a few centimetres .In deep oceans ,these waves will reach speeds exceeding 970km/hour. When tsunami enters the shoaling water of coastal lines, the velocity of its waves diminishes and the wave height increases, sometimes to a height of 30m, and strike the coast with devastating force. The other features of tsunami which influence the size of tsunami are the shoreline, bathymetric configuration, the velocity of sea floor deformation and the water depth near the source of earthquake. Tsunamis are characterized as shallow water waves and are different from wind generated waves .A tsunami can have a period in the range of ten minutes to two hours and a wave length in excess of 500km. The speed of shallow water wave is equal to the square root of the product of acceleration due to gravity and the depth of water. The rate at which a wave loses its energy is increased proportional to its wave length. Hence tsunamis travel in deep waters with high speeds and travel great transoceanic distances with limited energy loss. Near the coast, as the depth of water decreases the speed of tsunami diminishes. However as the change in total energy remains constant, the speed of tsunami decreases as it enters shallower water and the height of the wave grows. Because of this “shoaling effect”, a tsunami that was imperceptible in deep water may grow to be several meters in height. When a tsunami finally reaches the shore, it appears as rapidly rising and falling tide, a series of breaking waves.
III. TSUNAMI EFFECTS
Tsunamis have great erosion ability and they can strip beaches of sand and vegetation inundating coastal lands. The fast moving turbulent water can destroy houses and other coastal structures. Tsunamis during 1964 Niigatta earthquake caused damage to port and harbour facilities and liquefaction as a result of ground subsidence.1960 Chile and 1964 Alaska earthquakes generated tsunamis causing settlements of many structures due to erosion of soil underneath the foundation.1992,Nicaraguan earthquake tsunami deposited a vast sediment blanket over many low level areas.
During 2004, Indonesia earthquake ,tsunamis created 8m high waves at Campell bay about 10m high at Malacca and 3m high at Portblair.
Due to reversal action of pressures, large numbers of building in A&N Islands were washed away or damaged regardless of how they were constructed.
IV. MATHEMATICAL MODELS
In this paper, the following three different type of structures are chosen for the analysis and the tsunami forces imparted on these structures are worked out when subjected to tsunamis of different heights.
Type A: An R.C. Chimney of height 30m with change in cross section at three stages of height.
Type B: An overhead service reservoir of six lakh litres capacity with three horizontal bracings placed each at 4m intervals.
According to Camfield, the following types of forces may result when the tsunami run-up strikes the structures with high velocities.
Hydrostatic forces due to partial or fully submergence of structures.
Hydrodynamic forces caused by high velocity of surging/turbulent water.
Buoyant forces caused by partial or full submergence.
Impact forces caused by driftwood, small boats, lumber, portions of structures and other debris material carried away by surge water.
Surge forces caused by leading edge of the surge impinging on a structure.
In the analysis, hydrodynamic and impact forces are taken in to consideration as these forces are predominant compared to other forces. Though coastal structures are subjected to wind pressures, past research results show that impact of impulsive wave pressures are much higher than wind. Normally R.C. buildings with openings in the masonry infill panels have shown good performance to those without openings during 2004 Indonesian tsunami. Large percentage of openings and corridors allow the waves to pass through, thus minimize the tsunami impact on the structure. However, structural elements like column, beam, lateral bracing and foundation shall be designed and constructed to withstand the waves.
V. ANALYSIS FOR TSUNAMI FORCES
Design codes FEMA 55 and draft code of Bureau of Indian standard provide expressions for different forces that may be provided due to tsunami wave impact on structures. When turbulent water flows hitting the structure, the hydrodynamic and impact forces are considered to act on the structure in the direction of approaching tsunami. The equations suggested by Harry Yeh etal (2005) are used.
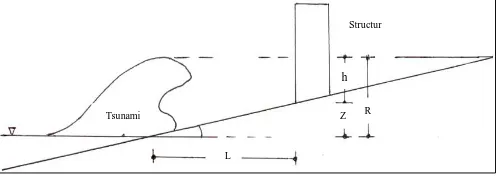
Inundation depth and flow velocity of a tsunami wave are the important parameters for calculating the forces imparted on the structure. The above forces are worked out for beach slopes of 1in 50 and 1in 100 as shown in fig1.
Fig. 1 Run up Zone of Tsunami
Hydrodynamic forces:
Hydrodynamic (drag) force is expressed as proportional to the product of square of flow velocity and the projected area on the structure. The drag coefficient CD is taken as 2.0 for rectangular column members and 3.0 for wall members
suggested by Camfield(1994). For the given location and beach slopes, the deign parameter (hmaxu2) is computed from
equation 1 and the hydrodynamic force, FD is calculated from equation 2 given below
2 2 max
gR u
h = 0.125 – 0.235
R
Z + 0.11 2
R
Z (1)
FD = 2
1 ρCD bhmax u2
(2)
Impact Forces:
Umax= √2gR(1-z/R) = 12.5m/sec (3)
L
Z R Tsunami
Structur
Fi= CmUmax√km
Using equations 2& 3, the values of hydrodynamic and impact forces are calculated for type A,B&C structures for different inundation depths and beach slopes. The total force that is considered to act on the structure is obtained by summing up of the hydrodynamic and impact forces at different levels of each structure and presented in tables. The graphical representation of Run up height vs total Tsunami forces for the above structures are presented in graphs
VI. RESULT ANALYSIS
Results of tsunami loads for three different types of structures at different slopes of 1:50 and 1:100 at different run up heights of 3m,6m ,9m and 12m.
Slope 1:100 structure @ 100m from shore R Type A Type B Type C
3 272.8 437 576 6 542.6 775 2097 9 754.2 1210 3429 12 1051.6 1691 5852
Representation of results through graphs at different slopes
a) Slope 1:50,structure @100m b) Slope 1:50,structure @150m
0 2 4 6 8 10 12 14
0 2000 4000 6000
C
WT
SB
0 2 4 6 8 10 12 14
0 2000 4000 6000
C
WT
SB
Slope 1:50 Structure @150m from shore R Type A Type B Type C
3 0 0 0 6 354.1 564 909 9 587.2 941 2251 12 856.9 1362 4260
Slope 1:100 structure @1 50m from shore R Type A Type B Type C
3 232.69 365.74 457.35 6 463.1 741 1440 9 709.5 1139 3091 12 997.3 1605 5391
Slope 1:50 Structure @100m from shore
R
Type A
Type B
Type C
3
189.08
301.75
363.5
6
426.7
684
1265
c) Slope 1:100,structure @100m d) Slope 1:100,structure @150m
VII. MITIGATION MEASURES
Vulnerability Assessment:
Historical and geological evidences suggest that coastal belts of Pacific Northwest and Northeast of Indian Ocean have experienced numerous earthquake induced tsunamis in the past and frequency of these occurrences is likely to increase in future. Ports, harbours, roads and non engineering structures situated close to sea level and typically built structures on unconsolidated soils are vulnerable to tsunami hazards associated with failures like collapse of buildings, liquefaction and tsunami inundation.
Vulnerability assessment is to identify the vulnerable issues at local level, which then serve as a basis for developing appropriate mitigation measures and preparedness strategies. The important factor of incorporating community context into the natural hazard process is to involve all the stake holders like local individuals, business, builders, government and non-government organizations with mitigation and preparedness planning efforts. The key concern of vulnerability to tsunami hazard was how to strengthen the productive interaction between stakeholders and technical experts to identify the vulnerability issues.
Mitigation Measures:
The first step of mitigation measure is imparting state-of-art of the knowledge and then to translate this knowledge into state-of-art of the practice. Protection against loss of life and property damage mainly depends upon the man made actions in raising the community awareness, developing a tele-tsunami warning system, providing evacuation signage and improving evacuation logistics. Advanced countries are implementing tsunami warning systems as mitigation measures and are successful in minimizing the death toll and structural damage during major tsunami events.
A warning of an oncoming tsunami is more effective than a matter of detecting that an earthquake has occurred under or near the ocean. In 2004 Sumatra earthquake and subsequent tsunami, there was a lag of about two and half hours between occurrence of earthquake and tsunami reaching the Indian coast. This time lag can be utilized for issuing a warning to coastal community so that people can be evacuated to safer zones. In 1965,Inter governmental Oceanographic Commission(IOC) of UNESCO, established International Tsunami Information centre in Hawali. In 1968,IOC formed an International Coordination group tsunami warning system in the pacific with 26 countries in and around the pacific belt as its members. At PTWC, Hawaii the computer systems continuously monitor the data from seismic stations and alert people when a significant tsunami has been detected. Consequently, National Oceanic and Atmospheric Administration (NOAA) developed Deep ocean Assessment and Reporting Tsunamis (DART) gauge. The data from DART gauges can be transmitted acoustically to a surface buoy and then relay it over satellite to the warning centre. Experiencing the great devastating phenomenon during Indonesian earthquake tsunamis, India started its own interim tsunami warning centre in 2007 at the Indian National Centre for Ocean Information Services (INCOIS), Hyderabad, under the Earth Systems Sciences Organization (ESSO), Govt of India.
0 2 4 6 8 10 12 14
0 2000 4000 6000
C
WT
SB
0 2 4 6 8 10 12 14
0 2000 4000 6000
C
WT
Prediction of possible tsunami events depends up on the understanding of local deformations and geological processes going on in a particular region as well as the overall global tectonic evolutions that drive them.
VIII. CONCLUSIONS
With rapid increase in rate of population and construction activity along coastal towns and cities, potential for massive destruction also increases due to tsunamis.
Tsunami forces on structures depend up on the strength, rigidity particularly at lower levels, tsunami wave height and bathymetry.
A building configuration can be so arranged that the tsunami waves pass through the openings and by the breaking the facade or non structural walls, mostly at lower floor levels, while the structural elements like column, beam, shear wall and foundation are designed to withstand the waves.
Awareness about tsunamis and their impact on coastal structures has to be created among the public, field engineers, scientists and administrators. Early warning systems are necessary to establish at various locations along the coast.
Protection against tsunamis can be achieved through construction of sea walls, beach defences and dense tree plantation along the coastal belts.
Enforcement of bye-laws and Coastal Regulations Zone (CRZ) norms should be strictly implemented to minimize the damage.
Tsunamis are secondary effects of earthquakes and hence a separate code shall be brought in.
NOTATIONS
FEMA:Fedearal Emergency Management Association L-Distance of location of structure from shoreline R-Maximum run-up height of tsunami above shoreline Z-Height of location point of the structure above shore line hmax- Maximum inundation depth above base of the structure
U-Tsunami wave velocity approaching the structure
ρ- Mass density of seawater (1025kg/m3) b- Breadth of exposed column/wall
REFERENCES
[1]. I.S. 1893 (Part-I)2002: “Criteria for Earthquake Resistant Design of Structures” Fifth Revision 2002. Matsutomi, H & Shuto.N (1994), “Tsunami Engineering Technical Report No.11, DCRC, Tohoku University, pp 29-32.
[2]. Murat Saatcioglu.Ahmed Ghobarah and Ioan Nistor (2005),Reconnaissance Report on“The December 26, 2004 Sumatra Earthquake and Tsunami” CAEE,The Canadian Association for earthquake Engineering, pp 1 – 21.
[3]. Reddy S.R.K. et al. (2006) “Terrain Evaluation and Influence of Soil-Structure Interaction on Seismic Response of Structures in Urban Environs” Proc. of 3rd International Conference on Protection of Structures against Hazards: Italy, pp 235 – 242.
[4]. Tsuneo Okada and Camfield (2005) “Tsunami loads and Structural Design of Tsunami Refuge Buildings”.
[5]. Tsutsumi.A; et al. (2000) “Near Shore flow velocity of southwest Hokkaido Earthquake Tsunami” Journal of Waterway Port, Coastal and Ocean Engineering May / June 2000, pp 136-143.
[6]. Yeh.H; Robertson.I; and Preuss.J (2005) “Development of design guidelines for structures that serve as tsunami vertical evacuation sites” Report No.2005-4, Washington State Department of Natural Resources.
[7]. Oregon Solomon C. Yim, F.ASCE1; Yong Wei2; Mohsen Azadbakht3; Seshu Nimmala4; and Tanarat Potisuk5 “Case Study for Tsunami Design of Coastal Infrastructure:Spencer Creek Bridge”.