ABSTRACT
WEAR, EMILY ELIZABETH. Phenotypic Analysis of Gene Expression in Proposed
Populus Root Development and Growth Genes. (Under the direction of Dr. Barry Goldfarb.)
Trees fix carbon through the process of photosynthesis, and then allocate resources to their roots and shoots. For carbon sequestration purposes, it can be useful to select genotypes that divert more carbon to the root system where it is less susceptible to degradation, and also to select genotypes tailored to specific site conditions. Using genetic transformation in Populus tremula × P. alba hybrid aspen clones, I studied the effect on root growth and development and lateral root initiation of several putative homologous genes from
Arabidopsis thaliana. The three genes studied, PLETHORA1 (PLT1), SHORT-ROOT (SHR), and NAC1 were regulated either by over-expression or RNA interference (RNAi) mediated suppression. Putative transformants of PtPLT1, PtSHR, and PtNAC1 RNAi constructs and a PtSHR over-expression construct were screened for phenotypic alterations to the roots and shoots in a tissue culture experiment. Then, a sub-set of lines from each construct was more thoroughly characterized for growth and physiology traits in a growth chamber experiment with water and nutrient limitation treatments. Finally, the relative gene expression levels compared to the wild type (WT) were analyzed for lines in each construct by real-time quantitative reverse-transcription PCR.
and biomass in roots and shoots, and reduced photosynthesis and stomatal conductance rates, but increased chlorophyll content in the leaves. I found there was a strong negative
relationship between the increased relative gene expression of the PtSHR over-expression construct lines and the severity of their reduced growth. Overall, there was relatively good correlation between the growth traits measured both in tissue culture and growth chambers, except for a few lines that behaved differently under the two environments or were
Phenotypic Analysis of Gene Expression in Proposed Populus Root Development and Growth Genes
by
Emily Elizabeth Wear
A thesis submitted to the Graduate Faculty of North Carolina State University
in partial fulfillment of the requirements for the Degree of
Master of Science
Forestry
Raleigh, North Carolina 2010
APPROVED BY:
________________________ ________________________
John King Ross Whetten
________________________ Barry Goldfarb
ii
BIOGRAPHY
Emily was born in Raleigh in 1983, as the youngest of four children, to parents Ernie and Karen White. She grew up loving the outdoors and climbing trees, under the
encouragement of her father.
In 2001, Emily went to UNC-Chapel Hill to study biology and became an avid Tarheel fan. She was accused by her college roommates of being crazy, because often there were pieces of plants or seeds dragged home in her pockets and left about the house to identify later. Emily further solidified her interest in plant biology and research after college as a Student Conservation Association intern working for the USDA, Invasive Plant
Research Lab in Florida. Under the mentorship of Paul Madeira and Phil Tipping she
decided that research was the career direction for her and began applying to graduate school. Just a few weeks before starting her masters program at NC State University, Emily met her now husband, Chris Wear, and a year later embarked on the taxing yet joyful process of planning a wedding while in graduate school. She managed to get married, go on a
honeymoon, and complete a major portion of her research project growing transgenic trees in the NCSU Phytotron all in the summer of 2009. Emily is excited to experience being
iii
ACKNOWLEDGEMENTS
iv
TABLE OF CONTENTS
LIST OF TABLES ……….. vi
LIST OF FIGURES ……….... vii
GENERAL INTRODUCTION ………... 1
REFERENCES ………... 10
CHAPTER 1: PHENOTYPIC ANALYSIS OF TRANSGENIC POPULUS MODIFIED FOR PROPOSED GENES INVOLVED WITH ROOT DEVELOPMENT AND GROWTH . 15
Abstract ………..… 16
Introduction ……… 16
Materials and Methods ………... 19
Results ……… 25
Discussion ……….. 30
References ……….. 37
Tables and Figures ..……….... 41
CHAPTER 2: GENE EXPRESSION ANALYSIS OF PUTATIVE ARABIDOPSIS HOMOLOGS IN TRANSGENIC POPULUS ………... 50
Abstract ……….. 51
Introduction ……… 51
Materials and Methods ………... 53
Results ……… 59
Discussion ……….. 62
References ……….. 67
v
CONCLUSION ………..………. 74 COMPILED REFERENCES ……….. 76 APPENDIX ………. 85 Appendix A. NCSU Phytotron Nutrient Solution Mineral Concentrations ……… 86 Appendix B. The calculated amount of water applied in the low and high water
vi
LIST OF TABLES
CHAPTER 1.
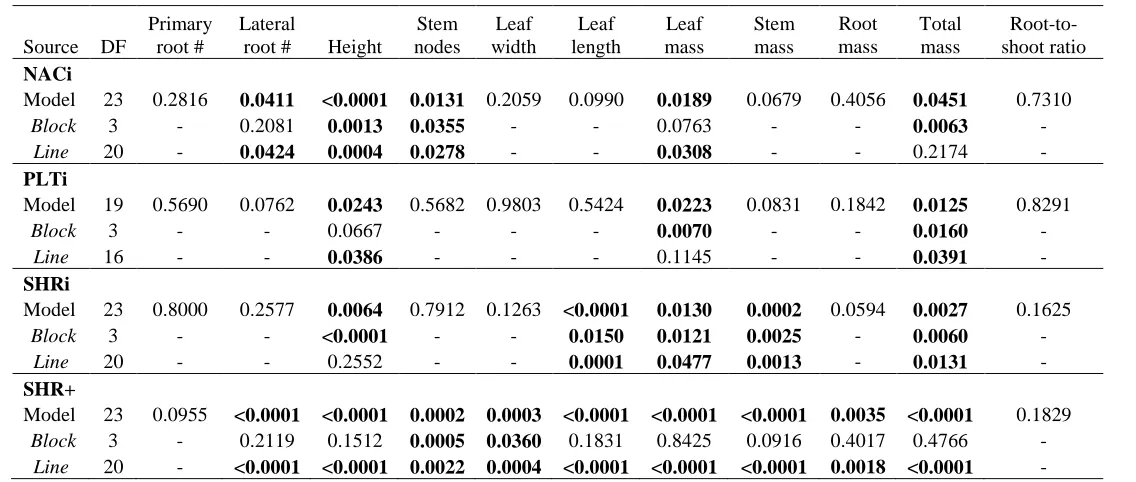
Table 1. P-values from the individual analysis of variance of the response variables
measured in the tissue culture phenotypic observation experiment for each
transgenic construct. Each construct was analyzed separately with the WT, and the model contained the fixed effects of block and line. Significant p-values are in bold. In cases where the overall model f-test was not significant, p-values for block and line were omitted. ………... 41
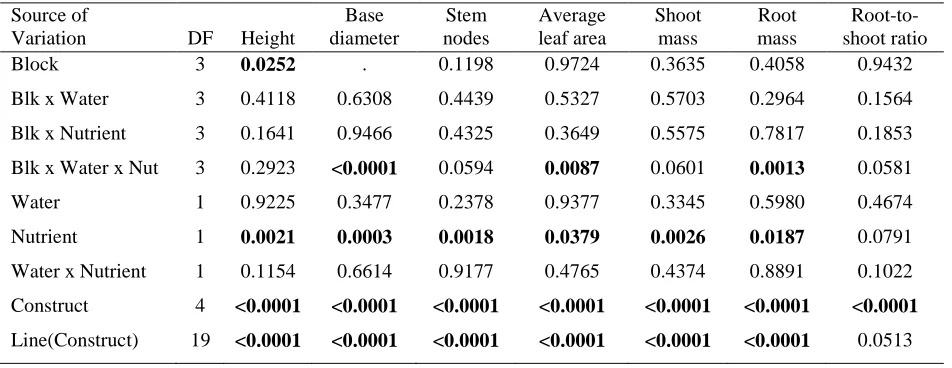
Table 2. P-values from the analysis of variance of the growth variables measured in the
growth chamber experiment for the random effects of block and all interactions with block and the fixed effects of the water and nutrient treatments, transgenic constructs, and lines within constructs. Significant p-values are in bold. ……… 42
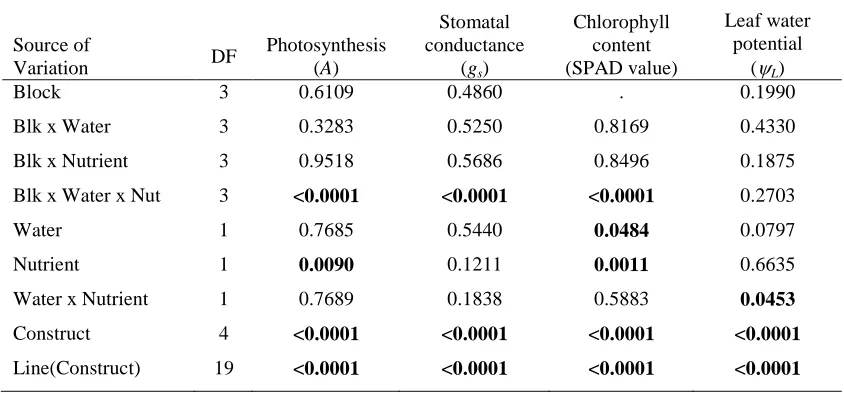
Table 3. P-values from the analysis of variance of the physiology variables measured in the
growth chamber experiment for the random effects of block and all interactions with block and the fixed effects of the water and nutrient treatments, transgenic constructs, and lines within constructs. Significant p-values are in bold. …….... 43 CHAPTER 2.
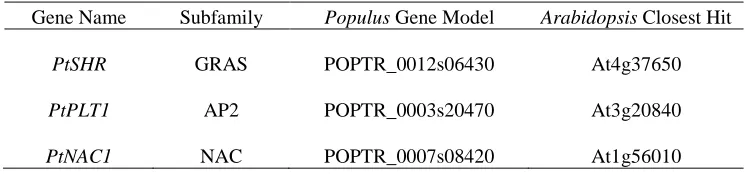
Table 1. The Populus trichocarpa gene model names and their closest Arabidopsis
homologs from a blast search of JGI version 2. ……….... 70
Table 2. The ANOVA results for relative fold change in gene expression with the fixed
effect of block and the random effect of transgenic lines for each RNAi construct. Significant p-values are in bold. ……… 70
Table 3. The ANOVA results for relative fold change in gene expression with the fixed
effects of block and tissue type, and the random effects of transgenic lines and the random interaction of lines and tissue types for the SHR+ over-expression
construct. Significant p-values are in bold. ………..… 71
Table 4. The interaction of line and tissue type was significant for the SHR+ construct;
vii
LIST OF FIGURES
CHAPTER 1.
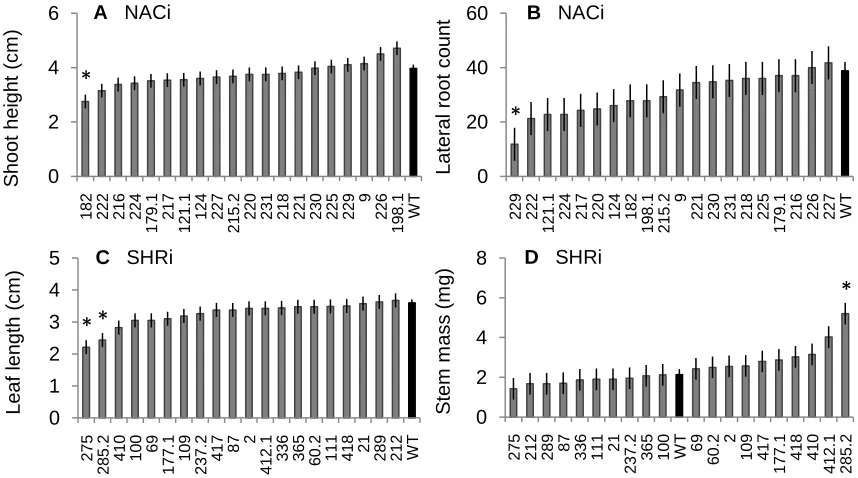
Figure 1. The least square means ± standard error of the growth traits with significant
differences when measured in tissue culture. A) The shoot height for NACi lines, B) the lateral root count for NACi lines, C) the leaf length for SHRi lines, and D) the stem mass for SHRi lines. The WT is designated with a black bar. Lines designated with a star are significantly different from the WT at α = 0.05. ….... 44
Figure 2. The least square means ± standard error for growth traits measured in tissue culture
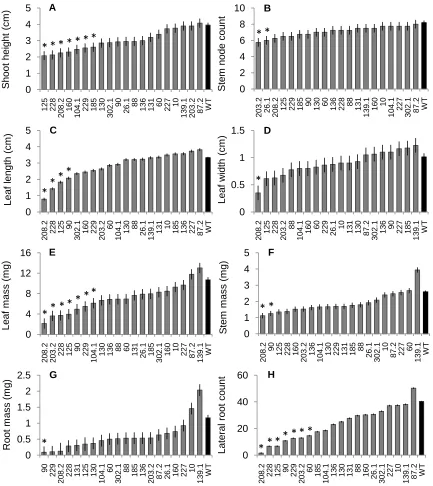
after 5 weeks growth of 20 lines from the SHR+ over-expression construct and WT (black bar). Measurements were made of A) final shoot height, B) number of stem nodes, C) leaf length (including petiole) of the fourth leaf down from the apex, D) leaf width of the fourth leaf down from the apex, E) leaf dry mass, F) stem dry mass, G) root dry mass, and H) number of lateral roots. Lines designated with a star are significantly different from the WT at α = 0.05. .……….… 45
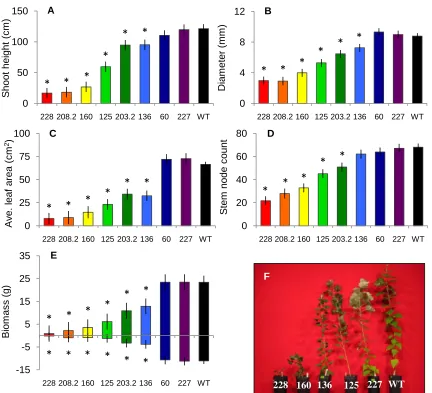
Figure 3. The least square means ± standard error of each SHR+ line and the WT (black bar)
of the growth traits measured in the growth chamber experiment: A) shoot height, B) base diameter, C) average leaf area, D) number of stem nodes, E) and shoot and root biomass when the trees were harvested. Lines were ordered according to increasing shoot biomass, and lines designated with a star are significantly different from the WT at α = 0.05. F) A picture of the various levels of stunted growth in SHR+ lines compared to the WT on the right. ……….... 46
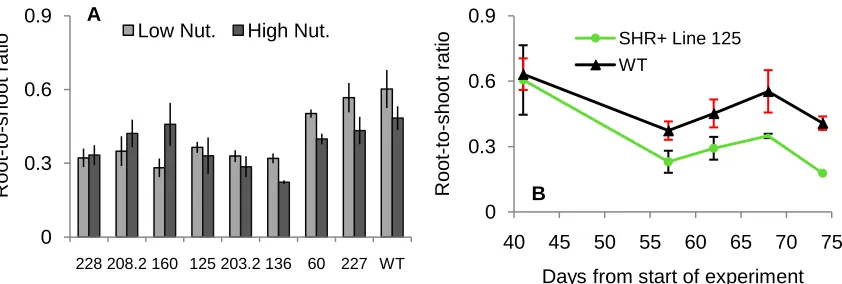
Figure 4. The mean ± standard error of each SHR+ line and the WT of root-to-shoot ratio
from A) trees given the low vs. high nutrient treatments. Lines are ordered
according to increasing shoot biomass from Figure 3. B) A single SHR+ line 125 and WT from the high nutrient treatment as an example of how the root-to-shoot ratio changed over five different time points. The data point for day 74 in SHR+ line 125 does not have an error bar because the second tree died. ………... 47
Figure 5. The least square means ± standard error of each SHR+ line and the WT (black) of
the physiology traits measured in the growth chamber experiment: A) leaf photosynthesis (A), B) stomatal conductance (gs), C) leaf chlorophyll content (SPAD value), and D) leaf water potential (ψL). Lines were ordered according to increasing shoot biomass from Figure 3, and lines designated with a star are significantly different from the WT at α = 0.05. ………...….. 48
viii
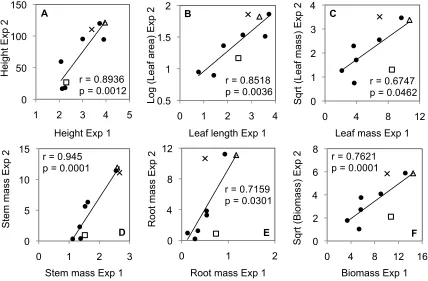
Figure 6. Correlation analysis of the growth traits A) shoot height, B) average leaf area and
leaf length, C) leaf mass, D) stem mass, E) root mass, and F) total biomass measured in the growth chamber (Exp. 2) versus the corresponding growth traits measured in tissue culture (Exp. 1) of the SHR+ over-expression construct and WT. The symbols designate the WT (), and SHR+ lines 60 (×) and 160 () that deviate from the correlation in leaf mass, root mass, and total biomass. The Pearson’s correlation coefficient and p-value at α = 0.05 confidence level are displayed. ……….… 49 CHAPTER 2.
Figure 1. The relative fold change in gene expression was normalized to an endogenous
control and the non-transgenic WT for the RNAi constructs A) PLTi, B) NACi, and C) SHRi. Error bars are the standard error between two biological replicates. Lines designated with a star are significantly different from the WT at the α = 0.05 confidence level. ………..…… 72
Figure 2. The relative gene expression was normalized to an endogenous control and the
non-transgenic WT for the SHR+ over-expression construct in leaf, root, and stem tissue samples. Error bars are the standard error between two biological replicates, but are difficult to see due to their small magnitude relative to the differences in gene expression. Lines and tissues designated with a star are significantly
different from the WT at the α = 0.05 confidence level. ………. 72
Figure 3. Correlation analysis of relative gene expression verses the phenotypes measured in
1
GENERAL INTRODUCTION
As the effects of climate change increase, new solutions for carbon sequestration are greatly needed. Countries around the world are seeking ways to reduce or offset their carbon
emissions. Interest has increased in woody plants as a biomass-based energy source and as a means to sequester atmospheric carbon (Sartori et al, 2006). Worldwide, forest vegetation and soils have been estimated to contain 359 and 787 Pg of carbon respectively (Dixon et al, 1994). Yet, aboveground forest biomass is vulnerable to degradation or die-off because of extreme temperatures and drought as well as forest fires, resulting in sequestered carbon being released back into the atmosphere (Allen et al, 2010; Daigneault et al, 2010). Carbon stored in belowground biomass is a major source of input to soil carbon pools through continual fine root turnover (Pregitzer et al, 2000) and is somewhat more stable than aboveground biomass. The proportion of belowground to aboveground biomass or root-to-shoot ratio is affected by the plant’s need to take-in the most limiting resource, either light or CO2 through the shoot, or water or nutrients through the roots (Bloom et al, 1985). However,
many studies in Populus have shown that biomass allocation to roots and shoots can also differ among genotypes, providing strong evidence for a genotype × environment interaction
(Isebrands and Nelson, 1983; Pregitzer et al, 1990; Wullschleger et al, 2005; Rae et al, 2008). For carbon sequestration purposes, it can be useful to select genotypes that divert more
2
A number of genetic approaches are being developed in forest trees, in order to facilitate more efficient breeding or genetic transformation for growth and biomass
allocation. These techniques include quantitative trait locus (QTL) mapping and association genetics that can link genetic markers to phenotypic traits. Also, transcriptome analysis and transgenic modification can identify specific genes and their expression patterns and link them to induced phenotypes (Grattapaglia et al, 2009). Synthesis of all of these approaches is also possible when there is a full genome sequence available for cross-referencing.
Consequently, it may be possible to genetically alter trees to have enhanced root systems that would have the capacity to store more carbon belowground, or to have the ability to grow more successfully on unfavorable sites. However, a full understanding of the genes controlling root development in trees has not yet been achieved. Significant research has been done on important genes that direct root development in Arabidopsis thaliana, a small flowering plant that is used as a model organism for genetic research (Rédei, 1975; Benfey et al, 1993). Even though all plant roots develop in somewhat similar ways, it is important to apply this knowledge to tree roots, because tree development differs from other plants in several important aspects. The perennial and large-scale growth habit of trees, their long life span, and development of secondary tissues (wood), as well as other specialized
characteristics, highlight the necessity of a better understanding of tree development (Bradshaw et al, 2000).
3
The Populus genus has long been studied for a wide range of physiological processes
including genetic studies, biomass harvesting, bio-fuel production, phytoremediation of toxic substances and many others. Furthermore, Populus is ideal as a model tree species because it has a relatively small genome compared to other trees, grows quickly, has a short time to maturity, and is relatively easy to work with in an experimental setting (Tuskan et al, 2006). In 2006, the genome of Populus trichocarpa (Torr. & Gray), commonly called black
cottonwood, was sequenced (Tuskan et al, 2006), giving researchers a powerful tool for further genetic study. Gaining a better understanding of the mechanisms of gene expression involved in root development will contribute important information to the Populus research community and the general tree research community as a whole.
To better understand tree root development and lateral root initiation, three genes that have a role in root development have been identified in Arabidopsis, and were selected for further study through transgenic modification in Populus. These putative homologs of PLETHORA1 (PLT1) (Aida et al, 2004), SHORT-ROOT (SHR) (Benfey et al, 1993), and NAC1 (Xie et al, 2000) were located in the sequence of the P. trichocarpa genome and primers were designed to amplify these genes from P. tremula × P. alba hybrid aspen (clone INRA 717-1B4) trees. The P. tremula × P. alba hybrid was chosen as the test species rather
than P. trichocarpa, because it can be easily maintained as clones in tissue culture and genetically transformed. All three genes analyzed in this study, if they are in fact
4
Patterning of the root apical and lateral meristem is directed by varying
concentrations of the hormone auxin, and the subsequent transcription of auxin responsive genes. One of these auxin responsive genes, PLT, is transcribed when there is an
accumulation of auxin and depends on auxin response transcription factors (ARFs) (Teale et al, 2006). Two members of the PLT family, PLT1 and PLT2 have similar function in Arabidopsis and are proposed to be redundant genes (Galinha et al, 2007). PLT is
responsible for maintenance of the stem cell niche, and specification of the boundary of the root meristem. Double mutants of plt1 and plt2 in Arabidopsis had reduced root growth with more lateral root branching, since PLT does not affect lateral root initiation (Aida et al, 2004). Acting in a dose dependent way, high levels of PLT maintain the stem cell niche, while low levels promote mitotic division of the stem cell daughters (Galinha et al, 2007). Mitotic division of the stem cell niche could cause stunting of root growth after a period of time, because the meristem will not be able to produce new daughter cells.
5
specifies the identity of the endodermis. In Arabidopsis scr mutants with functional SHR, the asymmetric cell division of the cortex/endodermis initial (CEI) daughter cell did not occur, but the resulting single cell layer had both cortex and endodermis markers present (Helariutta et al, 2000). Fukaki and colleagues (1998) also found that SHR and SCR had similar function in the radial organization of the shoot axial organs. The endodermis is hypothesized to be involved in gravity sensing in the plant, so Arabidopsis mutants of shr and scr that lacked normal endodermis layers in the inflorescence stem and hypocotyl, also lacked a gravitropic response (Fukaki et al, 1998). SCR is important to this study, even though it is not directly one of the genes studied, because a decrease in SHR functionally means a decrease in SCR. SHR and SCR proteins interact directly to accomplish their function and are interdependent to regulate other genes downstream (Cui et al, 2007).
The third gene, NAC1 is a part of the NAC family of transcription factors, and is thought to be a transcription activator of two other downstream auxin responsive genes, AIR3 and DBP. NAC1 is also considered to be an auxin responsive gene, because wild type
Arabidopsis root cultures treated with auxin had raised levels of NAC1 transcripts after only 30 minutes and levels peaked at 2 hours (Xie et al, 2000). As auxin accumulates, levels of a microRNA, miR164, also increases until it reaches a level where it regulates NAC1
expression though a feedback loop (Guo et al, 2005). NAC1 expression leads to lateral root initiation from the pericycle layer. Arabidopsis plants inserted with a NAC1 antisense
6
the lateral roots did emerge they were comparable in length and morphology to wild type roots. By directing lateral root initiation, NAC1 could have an important role in determining the type of root system a tree will have, such as a shallow, well branched system or a deep system with a well-defined tap-root, and fewer lateral roots.
The genome of P. trichocarpa has been fully sequenced, so this significant tool was used to match the gene sequences of PLT1, SHR, and NAC1 from Arabidopsis to homologous sequences in the P. trichocarpa genome. The putative homologs of these genes were
amplified from cDNA of the P. tremula × P. alba hybrid, and the PCR products were cloned
into a plasmid vector for further analysis (Lanz-Garcia and Goldfarb, unpublished). To study the function of each gene in Populus, the gene expression was modified either through
7
destroyed (Hannon, 2002). Levels of gene suppression vary among independent insertion events, which can either result in a decrease in the amount of the encoded protein or an almost complete silencing of the encoded protein. Similarly, inserting additional
homologous copies of a native gene can cause an increase in gene expression, but also has been documented to cause silencing of not only the inserted gene, but the native gene as well (Vaucheret et al, 1998). This unexpected result was termed co-suppression by Napoli et al. (1990). Because the number of transgenes that get incorporated into the genome and their position cannot be predicted for a transformation event (Vaucheret et al, 1998) it is important to screen carefully for positional effects and possible over-expression or suppression that could be occurring in individual transformed lines.
Additionally, though it can be useful to do an initial screen for altered phenotypes in sterile tissue culture conditions, it can also be important to test for changes in phenotype under varying environmental conditions. Many transgenic plant screens go directly from regenerating the putative transformants to study in a greenhouse (Andrade et al, 2009, Yadav et al, 2009, Fei and Nelson, 2004, and others) without screening first in tissue culture. Russo and Slack (1998) demonstrated that screening a large number of putative disease-resistant potato plants in tissue culture could be a simple way of reducing effort and cost while still receiving good correlation with identical greenhouse studies. On the other hand, some studies have found that tissue culture results did not predict the results obtained in a
8
screen transgenic plants at several levels under different conditions in order to obtain the most accurate results possible. In the present study, I chose to screen a large number of putative transformants, first in tissue culture, and then impose water and nutrient stress in an experiment with fewer lines in growth chambers.
9
reference gene and the non-treated control (in this case non-transformed wild type). The relative change in gene expression levels can then be correlated to phenotypic changes measured.
Previous work to isolate and clone transcripts of the three putative homologs, PLETHORA1-like, SHORTROOT-like, and NAC1-like (hereafter referred to as PtPLT1, PtSHR, and PtNAC1), from Populus tremula × P. alba hybrid aspen was carried out by
10
REFERENCES
Aida, M., Beis, D., Heidstra, R., Willemsen, V., Blilou, I., Galinha, C., Nussaume, L., Noh, Y., Amasino, R., and Scheres, B. (2004). The PLETHORA genes mediate patterning of the Arabidopsis root stem cell niche. Cell 119, 109-120.
Allen, C., Macalady, A., Chenchouni, H., Bachelet, D., McDowell, N., Vennetier, M., Kitzberger, T., Rigling, A., Breshears, D., Hogg, E.H., Gonzalez, P., Fensham, R., Zhang, Z., Castro, J., Demidova, N., Lim, J.-H., Allard, G., Running, S., Semerci, A., and Cobb, N. (2010). A global overview of drought and heat-induced tree mortality reveals emerging climate change risks for forests. Forest Ecology and Management 259, 660-684.
Anand, A., Zhou, T., Trick, H., Bockus, W., and Muthukrishnan, S. (2003). Greenhouse and field testing of transgenic wheat plants stably expressing genes for thaumatin-like protein, chitinase and glucanase against Fusarium graminearum. Journal of Experimental Bontany 54, 1101-1111.
Andrade, G., Nairn, C., Le, H., Merkle, S. (2009). Sexually mature transgenic American chestnut trees via embryogenic suspension-based transformation. Plant Cell Reports 28, 1385-1397.
Benfey, P., Linstead, P., Roberts, K., Schiefelbein, J., Hauser, M., and Aeschbacher, R. (1993). Root development in Arabidopsis - 4 mutants with dramatically altered root morphogenesis. Development 119, 57-70.
Bergmann, B., and Stomp, A. (1994). Effect of genotype on in vitro adventitious shoot formation in Pinus radiata and correlations between pairs of phenotypic traits during in vitro shoot development. Plant Cell, Tissue and Organ Culture 35, 185-194. Bloom, A., Chapin, F.S., and Mooney, H. (1985). Resource limitation in plants− an
economic analogy. Annual Review of Ecology and Systematics 16, 363-392.
Bradshaw, H., Jr., Ceulemans, R., Davis, J., and Stettler, R. (2000). Emerging model systems in plant biology: Poplar (Populus) as a model forest tree. Journal of Plant Growth Regulation 19, 306-313.
11
Cui, H., Levesque, M., Vernoux, T., Jung, J., Paquette, A., Gallagher, K., Wang, J., Blilou, I., Scheres, B., and Benfey, P. (2007). An evolutionarily conserved mechanism
delimiting SHR movement defines a single layer of endodermis in plants. Science 316, 421-425.
Daigneault, A., Miranda, M., and Sohngen, B. (2010). Optimal forest management with carbon sequestration credits and endogenous fire risk. Land Economics 86, 155-172. Dixon, R., Brown, S., Houghton, R., Solomon, A., Trexler, M., and Wisniewski, J. (1994).
Carbon pools and flux of global forest ecosystems. Science 263, 185-190.
Fei, S., and Nelson, E. (2004). Greenhouse evaluation of fitness-related reproduction traits in Roundup-tolerant transgenic creeping bentgrass (Agrostis stolonifera L.). In Vitro Cellular and Developmental Biology-Plant 40, 266-273.
Fire, A., Albertson, D., Harrison, S., and Moerman, D. (1991). Production of antisense RNA leads to effective and specific inhibition of gene expression in C. elegans muscle. Development 113, 503-514.
Flavell, R. (1994). Inactivation of gene expression in plants as a consequence of specific sequence duplication. Proceedings of the National Academy of Sciences USA 91, 3490-3496.
Freeman, W., Walker, S., and Vrana, K. (1999). Quantitative RT-PCR: Pitfalls and potential. BioTechniques 26, 112-125.
Fukaki, H., Wysocka-Diller, J., Kato, T., Fujisawa, H., Benfey, P., and Tasaka, M. (1998). Genetic evidence that the endodermis is essential for shoot gravitropism in
Arabidopsis thaliana. The Plant Journal 14, 425-430.
Galinha, C., Hofhuis, H., Luijten, M., Willemsen, V., Blilou, I., Heidstra, R., and Scheres, B. (2007). PLETHORA proteins as dose-dependent master regulators of Arabidopsis root development. Nature 449, 1053-1057.
Gilliland, G., Perrin, S., Blanchard, K., and Bunn, H.F. (1990). Analysis of cytokine mRNA and DNA: Detection and quantitation by competitive polymerase chain reaction. Proceedings of the National Academy of Sciences USA 87, 2725-2729.
12
Guo, H., Xie, Q., Fei, J., and Chua, N. (2005). MicroRNA directs mRNA cleavage of the transcription factor NAC1 to downregulate auxin signals for Arabidopsis lateral root development. The Plant Cell 17, 1376-1386.
Hannon, G. (2002). RNA Interference. Nature 418, 244-251.
Helariutta, Y., Fukaki, H., Wysocka-Diller, J., Nakajima, K., Jung, J., Sena, G., Hauser, M., and Benfey, P. (2000). The SHORTROOT gene controls radial patterning of the Arabidopsis root through radial signaling. Cell 101, 555-567.
Isebrands, J., and Nelson, N. (1983). Distribution of [14C]-labeled photosynthates within intensively cultured Populus clones during the establishment year. Physiologia Plantarum 59, 9-18.
Li, J., Brunner, A., Shevchenko, O., Meilan, R., Ma, C., Skinner, J., and Strauss, S. (2008). Efficient and stable transgene suppression via RNAi in field-grown poplars.
Transgenic Research 17, 679-694.
Lu, S., Zhou, Y., Li, L., and Chiang, V. (2006). Distinct Roles of Cinnamate 4-hydroxylase Genes in Populus. Plant Cell Physiology 47, 905-914.
Mourrain, P., Béclin, C., Elmayan, T., Feuerbach, F., Godon,C., Morel, J.-B., Jouette, D., Lacombe, A.-M., Nikic, S., Picault, N., Rémoué, K., Sanial, M., Vo, T.-A., and Vaucheret, H. Arabidopsis SGS2 and SGS3 Genes are required for posttranscriptional gene silencing and natural virus resistance. Cell 101, 533-542.
Napoli, C., Lemieux, C., and Jorgensen, R. (1990). Introduction of a chimeric Chalcone Synthase gene into Petunia results in reversible co-suppression of homologous genes in trans. The Plant Cell 2, 279-289.
Pfaffl, M. (2001). A new mathematical model for relative quantification in real-time RT– PCR. Nucleic Acids Research 29, 2002-2007.
Plasterk, R., and Ketting, R. (2000). The silencing of genes. Current Opinion in Genetics & Development 10, 562-567.
Pregitzer, K., Dickmann, D., Hendrick, R., and Nguyen, P. (1990). Whole-tree carbon and nitrogen partitioning in young hybrid poplars. Tree Physiology 7, 79-93.
Pregitzer, K., Zak, D., Maziasz, J., DeForest, J., Curtis, P., and Lussenhop, J. (2000).
Interactive effects of atmospheric CO2 and soil-N availability on fine roots of Populus
13
Rae, A., Pinel, M., Bastien, C., Sabatti, M., Street, N., Tucker, J., Dixon, C., Marron, N., Dillen, S., and Taylor, G. (2008). QTL for yield in bioenergy Populus: identifying G×Einteractions from growth at three contrasting sites. Tree Genetics & Genomes 4, 97-112.
Rédei, G. (1975). Arabidopsis as a genetic tool. Annual Review of Genetics 9, 111-127. Russo, P., and Slack, S. (1998). Tissue culture methods for the screening and analysis of
putative virus-resistant transgenic potato plants. Phytopathology 88, 437-441.
Sabatini, S., Heidstra, R., Wildwater, M., and Scheres, B. (2003). SCARECROW is involved in positioning the stem cell niche in the Arabidopsis root meristem. Genes and
Development 17, 354-358.
Sartori, F., Lal, R., Ebinger, M., and Parrish, D. (2006). Potential soil carbon sequestration and CO2 offset by dedicated energy crops in the USA. Critical Reviews in Plant Sciences 25, 441-472.
Scheres, B., Di Laurenzio, L., Willemsen, V., Hauser, M., Janmaat, K., Weisbeek, P., and Benfey, P. (1995). Mutations affecting the radial organization of the Arabidopsis root display specific defects throughout the embryonic axis. Development 121, 53-62. Teale, D., Papanov, I., Palme, K. (2006). Auxin in action: signaling, transport and the control
of plant growth and development. Nature Reviews 7, 847-859.
Tuskan, G.A., DiFazio, S., Jansson, S., Bohlmann, J., Grigoriev, I., Hellsten, U., Putnam, N., Ralph, S., Rombauts, S., Salamov, A., Schein, J., Sterck, L., Aerts, A., Bhalerao, R.R., Bhalerao, R.P., Blaudez, D., Boerjan, W., Brun, A., Brunner, A., Busov, V., Campbell, M., Carlson, J., Chalot, M., Chapman, J., Chen, G.-L., Cooper, D., Coutinho, P.M., Couturier, J., Covert, S., Cronk, Q., Cunningham, R., Davis, J., Degroeve, S., De´jardin, A., dePamphilis, C., Detter, J., Dirks, B., Dubchak, I., Duplessis, S., Ehlting, J., Ellis, B., Gendler, K., Goodstein, D., Gribskov, M., Grimwood, J., Groover, A., Gunter, L., Hamberger, B., Heinze, B., Helariutta, Y., Henrissat, B., Holligan, B., Holt, R., Huang, W., Islam-Faridi, N., Jones, S., Jones-Rhoades, M., Jorgensen, R., Joshi, C., Kangasja¨rvi, J., Karlsson, J., Kelleher, C., Kirkpatrick, R., Kirst, M., Kohler, A., Kalluri, U., Larimer, F., Leebens-Mack, J., Leple´, C.J., Locascio, P., Lou, Y., Lucas, S., Martin, F., Montanini, B., Napoli, C., Nelson, D.R., Nelson, C., Nieminen, K., Nilsson, O., Pereda, V., Peter, G., Philippe, R., Pilate, G., Poliakov, A., Razumovskaya, J., Richardson, P., Rinaldi, P., Ritland, K., Rouze´, P., Ryaboy, D., Schmutz, J., Schrader, J., Segerman, B., Shin, H.,
14
J., Wall, K., Wessler, S., Yang, G., Yin, T., Douglas, C., Marra, M., Sandberg, G., Van de Peer, Y., Rokhsar, D. (2006) The genome of black cottonwood, Populus trichocarpa (Torr. & Gray). Science 313, 1596–1604.
Vaucheret, H., Béclin, C., Elmayan, T., Feuerbach, F., Godon, C., Morel, J., Mourrain, P., Palauqui, J., and Vernhettes, S. (1998). Transgene-induced gene silencing in plants. The Plant Journal 16, 651-659.
Wullschleger, S., Yin, T., DiFazio, S., Tschaplinski, T., Gunter, L., Davis M., and Tuskan, G. (2005). Phenotypic variation in growth and biomass distribution for two advanced-generation pedigrees of hybrid poplar. Canadian Journal of Forest Research 35, 1779-1789.
Xie, Q., Frugis, G., Colgan, D., and Chua, N. (2000). Arabidopsis NAC1 transduces auxin signal downstream of TIR1 to promote lateral root development. Genes &
Development 14, 3024-3036.
15 CHAPTER 1
16
Abstract
Trees fix carbon through the process of photosynthesis, and then preferentially allocate resources to their roots and shoots. For carbon sequestration purposes, it can be useful to select genotypes that divert more carbon to the root system where it is less susceptible to degradation, and also to select genotypes tailored to specific site conditions. Using genetic transformation in Populus tremula × P. alba hybrid aspen clones, I studied the effect on root
growth and development and lateral root initiation of several putative homologous genes from Arabidopsis thaliana. The three genes studied, PLETHORA1 (PLT1), SHORT-ROOT (SHR), and NAC1 were regulated either by over-expression or RNA interference (RNAi) mediated suppression. I found that the RNAi suppression constructs of PtPLT1, PtSHR, and PtNAC1 showed very limited phenotypic alterations when screened in tissue culture and no phenotype alterations in a growth chamber experiment. The PtSHR over-expression construct showed reduced growth and biomass in roots and shoots, and reduced
photosynthesis and stomatal conductance rates, but increased chlorophyll content in the leaves. There was relatively good correlation between growth traits measured both in tissue culture and growth chambers, except for two PtSHR over-expression lines that behaved differently in the two environments.
Introduction
17
toxic substances and many others. Populus is considered an ideal model tree because it has a relatively small genome compared to other trees, it grows quickly, it has a short time to maturity, and it is relatively easy to work with in an experimental setting. The genome of one of its member species, Populus trichocarpa (Torr. & Gray), was sequenced (Tuskan et al, 2006) providing the genetic background and tools for further research into genetic regulatory mechanisms in trees, including analysis of gene expression that controls tree root development and growth. Plants fix carbon through the process of photosynthesis and it may be possible to increase long-term carbon storage in tree roots, or alter root architecture so that fast growing Populus trees can grow on a wider range of sites (Brunner et al, unpublished). Extensive research has been carried out on some of the genes involved with root
development in Arabidopsis thaliana, a small herbaceous plant used as a model organism for genetic studies (Rédei, 1975, Benfey et al, 1993), but little is known about how similar genes might operate in Populus roots.
18
stem cell niche and endodermis layer, as well as directing root and shoot radial patterning (Benfey et al, 1993; Scheres et al, 1995; Fukaki et al, 1998; Aida et al, 2004). Both SHR and SCR are important in Arabidopsis to the indeterminate growth of roots, allowing them to continually grow to access resources in the soil. The third gene, NAC1, is responsible for lateral root initiation from the pericycle layer, but does not affect the length and morphology of lateral roots once they emerge (Xie et al, 2000). Each of the genes analyzed in this study, if there are in fact homologous genes in Populus, have the potential to alter tree root structure and architecture in significant ways.
In the current study, genetically modified constructs were made from Populus
tremula × P. alba hybrid aspen for each target gene to cause either under-expression through
RNA interference (RNAi), also called post transcriptional gene-silencing (PTGS) (Fire et al, 1991; Flavell, 1994), or over-expression by inserting additional copies of the entire cDNA. An RNAi under-expression construct was made for the three target genes PtPLT1, PtSHR, and PtNAC1 in Populus, and I referred to these constructs as PLTi, SHRi, and NACi. A single over-expression transgenic construct was made of the PtSHR gene, which I referred to as SHR+. I screened 17-20 independently transformed lines for each gene construct in tissue culture to detect alterations in growth or form of the roots and shoots compared to the non-transformed wild type (WT).
19
experimental design to determine if the addition of these environmental stressors would bring out altered growth or physiology responses in the transgenic trees.
I hypothesized that:
1.) The three RNAi constructs, NACi, PLTi, and SHRi, would cause alterations in root and shoot growth in comparison to the WT.
2.) The SHR+ over-expression construct would cause alterations in root and shoot growth compared to the WT.
3.) a. Phenotype alterations observed in tissue culture would correlate well with the phenotype alterations in the growth chamber experiment, and
b. Water and nutrient stress would elicit altered growth or physiology phenotypes not visible in trees with ample water and nutrients.
Materials and Methods
Plant material and transformations
Each of the three target genes, PtPLT1, PtSHR, and PtNAC1 were amplified from P. tremula × P. alba hybrid aspen (clone INRA 717-1B4) using the Gateway System (Invitrogen,
Carlsbad, CA) (Lanz-Garcia and Goldfarb, unpublished). For the under-expressed
20
Kanamycin resistance gene was included in each vector to aid in the selection of putative transformants. Transformation of the vectors into the WT clone trees was carried out by Amy Brunner’s lab at Oregon State University. P. tremula × P. alba trees were co-cultivated
with disarmed Agrobacterium tumefaciens using a standard leaf disc protocol as described in Filichkin et al. (2006).
Phenotypic screen of gene constructs in tissue culture
A five-week phenotypic observation study was carried out in sterile tissue culture for all lines in each of the four constructs, alongside WT trees. The experimental set-up was a randomized, complete block design with 4 blocks. Each construct and WT were set-up in a separate experiment with 17 to 20 independent lines as well as 4 explants of WT, for a total of 21 to 24 explants that were randomly assigned in each block. A 1.5 cm section of the apex of the explants was cultured onto half strength MS media (Murashige and Skoog, 1962) in Phytatrays (Sigma-Aldrich, St. Louis, MO). The explants were grown in a growth chamber under 40 watt fluorescent bulbs with a constant temperature of 23 °C and a 12-hr
21
Growth chamber environmental conditions and tree acclimation
A walk-in controlled environment growth chamber in the NCSU Phytotron was used for an 11-week experiment. The explants growing in tissue culture were transferred to Ray Leach SuperCells (Stuewe & Sons Inc., Tangent, OR) filled with river bottom sand and acclimated in a high humidity environment created by using a misting system enclosed in plastic sheeting. Over the four-week acclimation period, the trees were gradually exposed to more light by removing shade cloth, and the humidity level was decreased. Once the roots began to reach the bottom of the super cells, the trees were transferred to 4 × 4 × 14 inch Tall One
Treepots (Stuewe & Sons Inc., Tangent, OR) also filled with river bottom sand and grown with a 16-hr photoperiod, and day/night temperatures of 22 / 20 °C. The trees were given
de-ionized water twice a day until flow-through and nutrients once a day on Mon/Wed/Fri for two weeks.
Growth chamber experimental design
Once the trees were established in the larger pots, they were set up in a randomized split-plot experimental design with four blocks. Each of the blocks had a complete 2 × 2 factorial
22
throughout the experiment as the trees required more water (for actual volume applied see Appendix B). The water treatment started with low water plots being watered 3 days per week and the high water plot being watered 6 days per week, and finished with the low water plots being watered twice per day and the high water plots being watered four times per day. The low nutrient treatment was a 1/3 dilution of the regular Phytotron nutrient solution (see Appendix A for mineral concentrations) applied three days per week in the morning, and the high nutrient treatment was the regular strength Phytotron nutrient solution applied 6 days per week in the morning. All water and nutrient treatments were applied until the soil was saturated and flow-through was occurring. Alongside the main experiment, an incomplete “mini” block was planted with several individuals of only a few lines within each construct. The same treatment conditions were maintained, except only the low water/high nutrient and high water/high nutrient treatments were applied, because there were not enough extra trees to employ all treatment combinations. These smaller plots were maintained so that they could be harvested at a mid-point during the experiment.
Growth measurements
23
3100 leaf area meter (Li-Cor, Inc., Lincoln, NE). The stem and leaves were then separated, and the roots were sieved and washed of sand and rocks. The leaves, stem, and roots were dried to a constant weight in a forced air oven at 70 °C and the mass for each part was
recorded. The total shoot and total root mass data from the mini block and each experimental block were used to calculate the root-to-shoot ratio over the course of the experiment.
Physiology measurements
In the fourth week of the experiment, a SPAD 502 chlorophyll meter (Minolta Camera Co., Ltd., Japan)was used was used to take three measurements of the SPAD value (unitless measure) on each of three leaves per tree and an average was taken. Additionally, the week before each block was harvested, measurements of photosynthesis (A) in µmol m-2
s-1 and stomatal conductance (gs) in mol m-2 s-1 were taken with a Li-Cor 6400 (Li-Cor, Inc., Lincoln, NE) on a single fully expanded and light-exposed leaf per tree. Measurements of leaf water potential (ψL) in MPa were also taken in the week before the harvest using a
pressure chamber instrument (Model 1000, PMS Instrument Company, Albany, OR) on fully expanded, mature leaves that were collected from the top third of the tree in a two-hour window from 9 to 11 am.
Statistical analysis
For the tissue culture experiment, an analysis of variance was run in SAS JMP 8 (SAS
24
block and line, and was used to analyze each response variable measured. Constructs with a significant difference among lines were further analyzed with Tukey’s means test to
determine which lines were significantly different from the WT. A sub-set of lines was then chosen based on these results to study further in the growth chamber experiment.
Alterations in root and shoot phenotypes of all growth and physiology measurements in the growth chamber experiment were assessed by conducting an analysis of variance (ANOVA) in PROC GLM (SAS Institute Inc., Cary, NC) according to the following general linear mixed model:
[Eq. 1] yijklm = µ + αi + βj + γk + (βγ)jk + (αβ)ij + (αγ)ik + (αβγ)ijk + δl + η(δ)m(l) + εijklm
where µ is the base level mean, αi is the random effect of the ith block, βj is the fixed effect of
the jth water treatment, γk is the fixed effect of the kth nutrient treatment, (βγ)jk is the fixed
interaction effect between the jth water treatment and kth nutrient treatment, (αβ)ij is the
random interaction effect between the ith block and jth water treatment, (αγ)ik is the random
interaction effect between the ith block and kth nutrient treatment, (αβγ)ijk is the random
interaction effect between the ith block, jth water treatment, and kth nutrient treatment, δl is the
fixed effect of the lth genetic construct, η(δ)m(l) is the fixed effect of the mth independent line
within the lth genetic construct, and εijklm is the random error with the expectations of ~NID
(0, σ2
25
assumption of having residuals with a homogeneous variance, so these variables were log10
transformed and ANOVA was run on the log10 values. Because the interpretation of the
p-values did not change when the data were transformed, only the p-p-values from the log10
-transformed data are reported in the results. Least square mean differences and F-tests were generated in SAS JMP 8 (SAS Institute Inc., Cary, NC) for constructs and lines within constructs using Tukey’s means test with a 95% confidence level.
The least square means for the independent lines within each construct were then compared between the tissue culture experiment and the growth chamber experiment using Pearson’s correlation coefficient in SAS JMP 8 (SAS Institute Inc., Cary, NC) to determine the strength and direction of the relationship between the two sets of results.
Results
Phenotype screen in tissue culture
26
in leaf length, leaf mass, stem mass, and total mass (Table 1), but only two lines were
significantly smaller than the WT in leaf length, and one line was significantly larger than the WT in stem mass (Fig. 1 C, D). Based on these data, four to six lines were selected from each RNAi construct to see if more defined phenotypes would emerge under imposed water and nutrient stress and a longer growing period in the growth chamber.
The SHR+ over-expression construct had the most phenotypic differences, showing significant differences among lines in shoot height, number of stem nodes, leaf width, leaf length, leaf mass, stem mass, root mass, and lateral root number (Table 1). The means test showed that seven out of twenty lines had significantly less shoot height, leaf mass, and lateral roots, and six lines had less total biomass (Fig. 2). Also, four lines had smaller leaf length, one line had smaller leaf width, two lines had less stem mass, and one line had less root mass. One line also had fewer stem nodes (Fig. 2). Based on these data, eight lines from across the phenotypic range were selected for observation in the growth chamber experiment.
Growth chamber growth measurements
27
line were highly significant for all growth traits measured (Table 2), because the SHR+ construct had significantly less growth in all of the growth traits measured than the other constructs and WT. However, none of the three RNAi constructs (NACi, PLTi, and SHRi) showed any significant differences from the WT in growth. Even though there were a few lines that were different from the WT in tissue culture, these differences could not be detected when the trees were grown for a longer period of time ex vitro. Further analysis was, therefore, focused on the SHR+ over-expression construct.
I tested to find out which lines within the SHR+ construct were significantly different from the WT in each growth trait, and found that six of the eight SHR+ lines had
significantly smaller height, base diameter, average leaf area, shoot biomass and root biomass than the WT (Fig. 3 A, B, D, E). Additionally, five of the eight SHR+ lines had significantly fewer stem nodes than the WT (Fig. 3 C). There were no lines significantly different from the WT in root-to-shoot ratio overall. However, I found some of the lines responded differently in root-to-shoot ratio under the low and high nutrient treatments. The WT trees and two SHR+ lines that grew similar to the WT had higher root-to-shoot ratios in the low nutrient treatment than in the high nutrient treatment (Fig. 4). The rest of the SHR+ lines had much more similar root-to-shoot ratios between the two treatments, except for two lines (SHR+ 160 and 136) that varied somewhat.
Growth chamber physiology measurements
28
for alterations in the basic physiology of the trees: photosynthesis (A), stomatal conductance (gs), leaf chlorophyll content (SPAD value), and leaf water potential (ψL). I found there were significant differences between the low and high nutrient treatments in A (8.47 ± 0.58 and 9.99 ± 0.58 µmol m-2
s-1 respectively) and leaf chlorophyll content (unitless SPAD value) (25.77 ± 0.38 and 29.94 ± 0.38 respectively), but there were no significant differences
between nutrient treatments for gs or ψL (Table 3). None of the physiological measurements had significant differences between the water treatments, except the SPAD value, which had a marginally significant difference between the low and high water treatments (27.27 ± 0.43 and 28.44 ± 0.43 respectively; p = 0.0484), and ψL, which had a marginally significant
interaction between the water and nutrient treatments (p = 0.0453). However, construct and line were again highly significant for all of the physiological measurements (Table 3). Consistent with the growth traits, lines with the SHR+ construct had significantly reduced A overall (7.42 ± 0.62 µmol m-2
s-1) compared to the WT (9.74 ± 0.63 µmol m-2 s-1). The SHR+ lines also had significantly reduced gs overall (0.396 ± 0.035 mol m-2 s-1) compared to the WT (0.530 ± 0.035 mol m-2
s-1). In contrast to the growth traits, only four of the eight SHR+ lines had significantly reduced A and only two of the eight SHR+ lines had
29
of the SHR+ lines that had reduced growth also had significantly higher leaf chlorophyll content (Fig. 5 C) and also were observed to have darker leaves. Finally, four of the eight SHR+ lines had a significantly less negative ψL compared to the WT (Fig. 5 D), meaning
they were further away from the wilting point, most likely due to their reduced size and lower transpirational demand.
Regression analysis between experiments for SHR+ lines
To determine if the phenotypes measured in tissue culture were consistent with the phenotypes measured in the growth chamber, I did an analysis of the strength of the
30
(p = 0.0462) with the leaf mass in tissue culture (Fig. 6 C). The root masses in both experiments were positively correlated (r = 0.7159, p = 0.0301) (Fig. 6 E), and the total biomasses had a positive correlation of 0.7621 (p = 0.0001) (Fig. 6 F). It should be noted that there were two lines (SHR+ lines 60 and 160) that deviated from these relationships more drastically than other lines in leaf mass, root mass, and overall biomass.
Discussion
Effect of water and nutrient treatments
Water and nutrient treatments were incorporated into the experimental design implemented in the growth chamber experiment, because I had hypothesized that water or nutrient stress could cause altered phenotypic responses to stress in the transgenic lines. However, the hypothesis was not supported, and the results did not show any noticeably altered phenotypes as a result of the stress treatments. Phenotype alterations that did emerge in lines of the SHR+ construct were evident in both the low and high water and nutrient treatments. The WT trees exhibited a classical response to lower nutrient availability, and increased their root-to-shoot ratio (Bloom et al, 1985). Except for a couple of lines, the root-to-shoot ratio of the SHR+ lines was much less affected by the difference in nutrient levels. These lines either were limited in their ability to take up nutrients, or because of their reduced size, the low nutrient level was sufficient and the high nutrient level was in excess.
31
large amount of water to keep the trees from dying and it was very difficult to mimic chronic water stress in this type of environment. If similar future studies were carried out, a larger pot size and possibly a different substrate mix would be necessary to more closely mimic chronic water stress. Some more fine-tuned plant-by-plant approaches to imposing water stress have been used by other studies with various Populus species, such as the trees being watered to a certain percentage of their field capacity by weighing the pots every other day and calculating the amount of water lost by transpiration (Yin et al, 2005); or by inspecting each tree to add water when it shows the first sign of leaf wilting (Siemens and Zwiazek, 2003). The main purpose of the limited water treatment was not to exactly measure the response of the trees to water stress, but instead to screen for phenotypic alterations. Because of this objective and the large number of trees included in the study, these more time and labor-intensive options were not practical for this application.
RNAi under-expression constructs
32
could have been due to the introduced sequences not being effective at targeting the gene of interest. Alternatively, the target gene could have been effectively reduced, but there was a related gene or genes that were functionally redundant. Arabidopsis studies of PLT showed that under-expression of only one member of the PLETHORA gene family did not have much effect, but in mutants without PLT1, PLT2, and PLT3 the plants were completely rootless (Galinha et al, 2007). Furthermore, Schrader et al. (2004) documented two homologs of the Arabidopsis SHR gene in P. tremula (PttSHR1 and PttSHR2). Because the tree clone used for this study was a P. tremula × P. alba hybrid, there are potentially even more homologous
genes in the genome which could have similar function. Additional research is being conducted into the actual level of gene expression of the three targeted genes used for under-expression and should bring more information to this result (Chapter 2).
SHR+ over-expression construct
Varying severities of stunted growth and reduced biomass were characterized in lines with the SHR+ over-expression construct that affected both the shoots and roots. The SHR+ lines also had reduced leaf area, obvious curling and twisting of the leaves and petioles, and darker leaves. Arabidopsis studies of shr mutants showed that the plants had shorter roots, darker cotyledons and leaves, and a lack of the endodermis layer in the roots, hypocotyl, and
33
lines the radial pattern was asymmetric (Helariutta et al, 2000), but no report was made of the overall root or shoot growth. The CaMV 35S is a strong promoter that is constitutively expressed in many plant tissues (Odell et al, 1985). In the present study, the CaMV 35S promoter was used to drive the over-expression of PtSHR, which could be leading to expression in tissues where PtSHR is not normally expressed. I would expect from the outcome in these Arabidopsis studies that over-expression of PtSHR might lead to increased root growth, but the root growth of the over-expression lines in this study was reduced.
SHR is a putative transcription factor in Arabidopsis, and has been documented to be up-stream of SCR, another transcription factor and a partner in root and shoot radial
34
Related to this, I also found that the SHR+ over-expression lines had increased chlorophyll content, even though they had reduced leaf area and photosynthetic ability. The SPAD meter used to measure chlorophyll content does have some limitations, because the SPAD values can be affected by variation in leaf thickness and color (Chapman and Barreto, 1997; Campbell et al, 1990; Chang and Robison, 2002). In this experiment, I found that the specific leaf area (SLA), a measure of leaf thickness, was slightly higher in some lines of SHR+ than the WT, and slightly lower than the WT in several other lines (data not shown), but they all had increased chlorophyll content. This leads us to believe that by taking three measurements per leaf on three leaves per plant, I was able to accurately detect a true increase in chlorophyll content and not just variation in leaf thickness or localized color change. Additionally, although photosynthesis is mostly thought of as occurring in the mesophyll cells in C3 plants, bundle sheath cells can also have chloroplasts. Bundle sheath
35
Without further research, I am unable to determine definitively whether the reduced shoot and root growth of the SHR+ lines is caused by increased expression of PtSHR in abnormal tissues or if the growth is affected by an increase in expression of PtSCR and other genes that could be up or down regulated. It is possible that abnormal expression of PtSHR in the shoot tissues and the reductions I found in leaf area and photosynthetic capacity led to extremely reduced root growth, that masked any potential effect of over-expressed PtSHR in the roots. A microarray experiment to detect what other genes PtSHR is regulating
downstream would be necessary to unravel all of the complex patterns of gene expression and related phenotypes involved.
Analysis between tissue culture and growth chamber experiments
There was a considerable amount of agreement between the two experiments that were used to detect altered phenotypes in the transgenic SHR+ lines compared to WT. However, there were a few lines (SHR+ 60 and 160) that behaved differently under the different
36
37
References
Aida, M., Beis, D., Heidstra, R., Willemsen, V., Blilou, I., Galinha, C., Nussaume, L., Noh, Y., Amasino, R., and Scheres, B. (2004). The PLETHORA genes mediate patterning of the Arabidopsis root stem cell niche. Cell 119, 109-120.
Benfey, P., Linstead, P., Roberts, K., Schiefelbein, J., Hauser, M., and Aeschbacher, R. (1993). Root development in Arabidopsis - 4 mutants with dramatically altered root morphogenesis. Development 119, 57-70.
Bergmann, B., and Stomp, A. (1994). Effect of genotype on in vitro adventitious shoot formation in Pinus radiata and correlations between pairs of phenotypic traits during in vitro shoot development. Plant Cell, Tissue and Organ Culture 35, 185-194. Bloom, A., Chapin, F.S., and Mooney, H. (1985). Resource limitation in plants− an
economic analogy. Annual Review of Ecology and Systematics 16, 363-392. Brunner, A., Meilan, R., Strauss, S., Givan, S., and Goldfarb, B. New genetic tools for
modifying tree properties to enhance carbon sequestration. Proposal to DOE. Unpublished.
Campbell, R., Mobley, K., Marini, R., and Pfeiffer, D. (1990). Growing conditions alter the relationship between SPAD-501 values and apple leaf chlorophyll. HortScience 25, 330-331.
Chang, S., and Robison, D. (2003). Nondestructive and rapid estimation of hardwood foliar nitrogen status using the SPAD-502 chlorophyll meter. Forest Ecology and
Management 181, 331-338.
Chapman, S., and Barreto, H. (1997). Using a chlorophyll meter to estimate specific leaf nitrogen of tropical Maize during vegetative growth. Agronomy Journal 89, 557-562. Di Laurenzio, L., Wysocka-Diller, J., Malamy, J., Pysh, L., Helariutta, Y., Freshour, G.,
Hahn, M., Feldmann, K., and Benfey, P. (1996). The SCARECROW gene regulates an asymmetric cell division that is essential for generating the radial organization of the Arabidopsis root. Cell 86, 423-433.
38
Filichkin, S., DiFazio, S., Brunner, A., Davis, J., Yang, Z., Kalluri, U., Arias, R.,
Etherington, E., Tuskan, G., and Strauss, S. (2007). Efficiency of gene silencing in
Arabidopsis: direct invertedrepeats vs. transitive RNAi vectors. Plant Biotechnology Journal 5, 615-625.
Filichkin, S., Meilan, R., Busov, V., Ma, C., Brunner, A., and Strauss, S. (2006). Alcohol-inducible gene expression in transgenic Populus. Plant Cell 25, 660-667.
Fire, A., Albertson, D., Harrison, S., and Moerman, D. (1991). Production of antisense RNA leads to effective and specific inhibition of gene expression in C. elegans muscle. Development 113, 503-514.
Flavell, R. (1994). Inactivation of gene expression in plants as a consequence of specific sequence duplication. Proceedings of the National Academy of Sciences USA 91, 3490-3496.
Fukaki, H., Wysocka-Diller, J., Kato, T., Fujisawa, H., Benfey, P., and Tasaka, M. (1998). Genetic evidence that the endodermis is essential for shoot gravitropism in
Arabidopsis thaliana. The Plant Journal 14, 425-430.
Galinha, C., Hofhuis, H., Luijten, M., Willemsen, V., Blilou, I., Heidstra, R., and Scheres, B. (2007). PLETHORA proteins as dose-dependent master regulators of Arabidopsis root development. Nature 449, 1053-1057.
Helariutta, Y., Fukaki, H., Wysocka-Diller, J., Nakajima, K., Jung, J., Sena, G., Hauser, M., and Benfey, P. (2000). The SHORTROOT gene controls radial patterning of the Arabidopsis root through radial signaling. Cell 101, 555-567.
Kinsman, E., and Pyke, K. (1998). Bundle sheath cells and cell-specific plastid development in Arabidopsis leaves. Development 125, 1815-1822.
Leegood, R. (2008). Roles of the bundle sheath cells in leaves of C3 plants. Journal of
Experimental Botany 59, 1663-1673.
Murashige, T., and Skoog, F. (1962). A revised medium for rapid growth and bio assays with tobacco tissue cultures. Physiologia Plantarum 15, 473-497.
Odell, J., Nagy, F., Chua, N. (1985). Identification of DNA sequences required for activity of the cauliflower mosaic virus 35S promoter. Nature 313, 810-812.
39
Russin, W., and Evert, R. (1985). Studies on the leaf of Populus deltoides (Salicaceae): ultrastructure, plasmodesmatal frequency, and solute concentrations. American Journal of Botany 72, 1232-1247.
Sabatini, S., Heidstra, R., Wildwater, M., and Scheres, B. (2003). SCARECROW is involved in positioning the stem cell niche in the Arabidopsis root meristem. Genes and
Development 17, 354-358.
Scheres, B., Di Laurenzio, L., Willemsen, V., Hauser, M., Janmaat, K., Weisbeek, P., and Benfey, P. (1995). Mutations affecting the radial organization of the Arabidopsis root display specific defects throughout the embryonic axis. Development 121, 53-62. Schrader, J., Nilsson, J., Mellerowicz, E., Berglund, A., Nilsson, P., Hertzberg, M., and
Sandberg, G. (2004). A high-resolution transcript profile across the wood-forming meristem of Poplar identifies potential regulators of cambial stem cell identity. The Plant Cell 16, 2278-2292.
Sheehy, J., Ferrer, A., Mitchell, P., Elmido-Mabilangan, A., Pablico, P., and Dionora, M. (2007). How the rice crop works and why it needs a new engine. In: Sheehy, J., Mitchell, P., and Hardy, B., eds. Charting new pathways to C4 rice. Los Banos, Philippines: International Rice Research Institute, 3-26.
Siemens, J., and Zwiazek, J. (2003). Effects of water deficit stress and recovery on the root water relations of trembling aspen (Populus tremuloides) seedlings. Plant Science 165, 113-120.
Tuskan, G.A., DiFazio, S., Jansson, S., Bohlmann, J., Grigoriev, I., Hellsten, U., Putnam, N., Ralph, S., Rombauts, S., Salamov, A., Schein, J., Sterck, L., Aerts, A., Bhalerao, R.R., Bhalerao, R.P., Blaudez, D., Boerjan, W., Brun, A., Brunner, A., Busov, V., Campbell, M., Carlson, J., Chalot, M., Chapman, J., Chen, G.-L., Cooper, D., Coutinho, P.M., Couturier, J., Covert, S., Cronk, Q., Cunningham, R., Davis, J., Degroeve, S., De´jardin, A., dePamphilis, C., Detter, J., Dirks, B., Dubchak, I., Duplessis, S., Ehlting, J., Ellis, B., Gendler, K., Goodstein, D., Gribskov, M., Grimwood, J., Groover, A., Gunter, L., Hamberger, B., Heinze, B., Helariutta, Y., Henrissat, B., Holligan, B., Holt, R., Huang, W., Islam-Faridi, N., Jones, S., Jones-Rhoades, M., Jorgensen, R., Joshi, C., Kangasja¨rvi, J., Karlsson, J., Kelleher, C., Kirkpatrick, R., Kirst, M., Kohler, A., Kalluri, U., Larimer, F., Leebens-Mack, J., Leple´, C.J., Locascio, P., Lou, Y., Lucas, S., Martin, F., Montanini, B., Napoli, C., Nelson, D.R., Nelson, C., Nieminen, K., Nilsson, O., Pereda, V., Peter, G., Philippe, R., Pilate, G., Poliakov, A., Razumovskaya, J., Richardson, P., Rinaldi, P., Ritland, K., Rouze´, P., Ryaboy, D., Schmutz, J., Schrader, J., Segerman, B., Shin, H.,
40
J., Wall, K., Wessler, S., Yang, G., Yin, T., Douglas, C., Marra, M., Sandberg, G., Van de Peer, Y., Rokhsar, D. (2006) The genome of black cottonwood, Populus trichocarpa (Torr. & Gray). Science 313, 1596–1604.
Vancanneyt, G., Schmidt, R., O’Connor-Sanchez, A., Willmitzer, L., and Rocha-Sosa, M. (1990). Construction of an intron-containing marker gene: Splicing of the intron in transgenic plants and its use in monitoring early events in Agrobacterium-mediated plant transformation. Molecular and General Genetics 220, 245-250.
Williams, M., Farrar, J., Polluck, C. (1989). Cell specialization within the parenchymatous bundle sheath of barley. Plant, Cell and Environment 12, 909-918.
Wysocka-Diller, J., Helariutta, Y., Fukaki, H., Malamy, J., and Benfey, P. (2000). Molecular analysis of SCARECROW function reveals a radial patterning mechanism common to root and shoot. Development 127, 595-603.
Xie, Q., Frugis, G., Colgan, D., and Chua, N. (2000). Arabidopsis NAC1 transduces auxin signal downstream of TIR1 to promote lateral root development. Genes &
Development 14, 3024-3036.
41
Tables and Figures
Table 1. P-values from the individual analysis of variance of the response variables measured in the tissue culture phenotypic observation experiment for each transgenic construct. Each construct was analyzed separately with the WT, and the model contained the fixed effects of block and line. Significant p-values are in bold. In cases where the overall model f-test was not significant, p-values for block and line were omitted.
Source DF
Primary root #
Lateral
root # Height
Stem nodes
Leaf width
Leaf length
Leaf mass
Stem mass
Root mass
Total mass
Root-to-shoot ratio NACi
Model 23 0.2816 0.0411 <0.0001 0.0131 0.2059 0.0990 0.0189 0.0679 0.4056 0.0451 0.7310
Block 3 - 0.2081 0.0013 0.0355 - - 0.0763 - - 0.0063 -
Line 20 - 0.0424 0.0004 0.0278 - - 0.0308 - - 0.2174 - PLTi
Model 19 0.5690 0.0762 0.0243 0.5682 0.9803 0.5424 0.0223 0.0831 0.1842 0.0125 0.8291
Block 3 - - 0.0667 - - - 0.0070 - - 0.0160 -
Line 16 - - 0.0386 - - - 0.1145 - - 0.0391 - SHRi
Model 23 0.8000 0.2577 0.0064 0.7912 0.1263 <0.0001 0.0130 0.0002 0.0594 0.0027 0.1625
Block 3 - - <0.0001 - - 0.0150 0.0121 0.0025 - 0.0060 -
Line 20 - - 0.2552 - - 0.0001 0.0477 0.0013 - 0.0131 - SHR+
Model 23 0.0955 <0.0001 <0.0001 0.0002 0.0003 <0.0001 <0.0001 <0.0001 0.0035 <0.0001 0.1829
Block 3 - 0.2119 0.1512 0.0005 0.0360 0.1831 0.8425 0.0916 0.4017 0.4766 -
42
Table 2. P-values from the analysis of variance of the growth variables measured in the growth chamber experiment for the random effects of block and all interactions with block and the fixed effects of the water and nutrient treatments, transgenic constructs, and lines within constructs. Significant p-values are in bold.
Source of
Variation DF Height
Base diameter
Stem nodes
Average leaf area
Shoot mass
Root mass
Root-to-shoot ratio
Block 3 0.0252 . 0.1198 0.9724 0.3635 0.4058 0.9432
Blk x Water 3 0.4118 0.6308 0.4439 0.5327 0.5703 0.2964 0.1564
Blk x Nutrient 3 0.1641 0.9466 0.4325 0.3649 0.5575 0.7817 0.1853
Blk x Water x Nut 3 0.2923 <0.0001 0.0594 0.0087 0.0601 0.0013 0.0581
Water 1 0.9225 0.3477 0.2378 0.9377 0.3345 0.5980 0.4674
Nutrient 1 0.0021 0.0003 0.0018 0.0379 0.0026 0.0187 0.0791
Water x Nutrient 1 0.1154 0.6614 0.9177 0.4765 0.4374 0.8891 0.1022
Construct 4 <0.0001 <0.0001 <0.0001 <0.0001 <0.0001 <0.0001 <0.0001
43
Table 3. P-values from the analysis of variance of the physiology variables measured in the growth chamber experiment for the random effects of block and all interactions with block and the fixed effects of the water and nutrient treatments, transgenic constructs, and lines within constructs. Significant p-values are in bold.
Source of
Variation DF
Photosynthesis (A)
Stomatal conductance
(gs)
Chlorophyll content (SPAD value)
Leaf water potential
(ψL)
Block 3 0.6109 0.4860 . 0.1990
Blk x Water 3 0.3283 0.5250 0.8169 0.4330
Blk x Nutrient 3 0.9518 0.5686 0.8496 0.1875
Blk x Water x Nut 3 <0.0001 <0.0001 <0.0001 0.2703
Water 1 0.7685 0.5440 0.0484 0.0797
Nutrient 1 0.0090 0.1211 0.0011 0.6635
Water x Nutrient 1 0.7689 0.1838 0.5883 0.0453
Construct 4 <0.0001 <0.0001 <0.0001 <0.0001
44
Figure 1. The least square means ± standard error of the growth traits with significant differences when measured in tissue culture. A) The shoot height for NACi lines, B) the lateral root count for NACi lines, C) the leaf length for SHRi lines, and D) the stem mass for SHRi lines. The WT is designated with a black bar. Lines designated with a star are
significantly different from the WT at α = 0.05. 0
2 4 6
182 222 216 224
179. 1 217 121. 1 124 227 215. 2
220 231 218 221 230 225 229
9 226 198. 1 WT S hoot hei ght ( c m ) 0 20 40 60 229 222 121. 1
224 217 220 124 182
198.
1
215.
2 9
221 230 231 218 225
179.
1
216 226 227 WT
Lat er al r oot c ount 0 1 2 3 4 5 275 285. 2
410 100 69
177. 1 109 237. 2 417 87 2 412. 1
336 365 60.
2
111 418 21 289 212 WT
Leaf l engt h (c m ) 0 2 4 6 8
275 212 289 87 336 111 21
237.
2
365 100 WT 69 60. 2 2 109 417 177. 1 418 410 412. 1 285. 2 S tem m as s ( m g)
D SHRi
*
C SHRi
* *
A NACi
*
B NACi