ISSN(Online): 2319-8753 ISSN (Print): 2347-6710
I
nternational
J
ournal of
I
nnovative
R
esearch in
S
cience,
E
ngineering and
T
echnology
(An ISO 3297: 2007 Certified Organization)
Website: www.ijirset.com Vol. 6, Issue 6, June 2017
Application of EDXRF Technique for Elemental
Analysis of Root Vegetables Collected from Akaki,
Kera and Debre Berhan
W. Wubishet Gezahegna, M. Sudarshanb, A.D.P. Raoa
Department of Nuclear Physics, Andhra University, Visakhapatnam, Andhra Pradesh, Indiaa
UGC- Department of Atomic Energy Consortium for Scientific Research, Kolkata Centre, Kolkata, Indiab
ABSTRACT: The elemental analysis of vegetables namely potato (Solanum tuberosum), carrot (Daucus carota sativus), red beet (Beta vulgaris) and turnip (Brassica rapa) was performed using energy dispersive X-ray fluorescence (EDXRF) spectrometer. The measurements were performed in vacuum using different filters (between the source and sample) for optimum detection of elements. A 0.05-mm-thick Ti filter was used in front of the source for Cr, Mn, Fe, Co, Ni, Cu and Zn with an applied voltage of 14 kV and a current of 900 mA. For higher Z elements such as Pb, Bi, Ag and As, a Fe filter of 0.05 mm thickness was used at a voltage of 37 kV and 45 mA current. All the spectra of the samples were collected for the duration of 1400 seconds. The X-rays were detected using a liquid nitrogen-cooled 12.5 mm2 Si (Li) semiconductor detector (resolution 150 eV at 5.9 KeV). The X-ray fluorescence spectra were quantitatively analysed by the ‘nEXt’, system software runs under the Windows NTTM operating system integrated with the system. Results revealed that the highest concentrations of major elements such as Ca, K, and S were recorded in turnip roots, while the highest content of P was detected in potatoes. The level of As, Pb and Cr in the vegetables collected from Akaki and Kera farm were found to be higher than the permissible limit that set by FAO/WHO. Thus there is some possibility of having neurological disorders, cancer and even paralysis if these vegetables were taken for long duration. Among possible target organs of humans by heavy metals are soft tissues such as the kidney, liver and the central nervous system. Trace and major elements present in plants is affected by various factors such as a type of plant species, soil properties, weather conditions, a way of agricultural practice, use of fertilizers and pesticides, as well as a plant development stage.
KEYWORDS: EDXRF, Root vegetables, Essential element, Heavy metal, ppm.
I. INTRODUCTION
X-ray fluorescence analysis (XRF) has been widely used for elemental analysis in geochemistry, earth science, manufacturing industry and forensic science [1-3]. The technique works based on the fact that all elements produce secondary ‘fluorescent’ x-rays of characteristic energy when exposed to the x-rays of respective element with higher energy and intensity of emitted X-rays used to determine elemental composition. In general, if the atomic weight of an element is higher, then higher energy is required to elicit fluorescence; if fluorescence energy is higher, then it is easy to detect the fluorescence. For XRF analysis of processed foods and beverages, samples are typically homogenized and pressed into pellets. Calibration is achieved empirically by relating the intensity of X-ray emissions concerned to an element pertaining to a set of samples for concentration determined by using a reference method.
ISSN(Online): 2319-8753 ISSN (Print): 2347-6710
I
nternational
J
ournal of
I
nnovative
R
esearch in
S
cience,
E
ngineering and
T
echnology
(An ISO 3297: 2007 Certified Organization)
Website: www.ijirset.com Vol. 6, Issue 6, June 2017
technique has accelerated since the 1960s as a result of the development of liquid nitrogen cooled solid-state detectors, nuclear electronics, and small computers.
Now-a-days compact light-weight electrically cooled detectors are available together with air-cooled low-power X-ray tubes and are perfectly suited for handheld spectrometers. EDXRF is a multi elemental and non-destructive technique that can be applied to large as well as small samples of different composition and character. If conditions are optimized, minimum detection limits may be below the nanogram absolute or micrograms per gram for small laboratory instruments. For more advanced instrumentation (total reflection x-ray fluorescence (TXRF), synchrotron radiation) the detection limits may be femtogram or nano grams per millilitre region.
EDXRF spectrometers exist at many degrees of sophistication, ranging from advanced laboratory instruments to small portable instruments for field observations. They can be designed for analysis of bulk material or for scanning and elemental mapping of small areas. The use of X-ray optics like single or poly capillaries and curved mirrors in Kirkpatrick–Baez geometry lead to x-ray spot sizes of micrometers and below ideally suited for micro- XRF. Mapping with high spatial resolution is thus possible opening investigations down to cell dimension. Typical applications for EDXRF are analysis of agricultural material, medical samples, archaeological and historical objects, painting and fine art objects, and environmental samples such as soil, ores, water, and aerosol particles. A vast number of scientific publications exist on the subject of EDXRF and its applications [4]. Vegetables continue to be the major sources of nutrients including proteins, vitamins, macro and essential trace elements, and minerals in human diet for proper growth, body development, and maintenance of overall health and well-being [5-7].
Root vegetables are the roots of plants that are eaten as vegetables. These roots grow into the ground from the base of the plant stem. They anchor the plant, absorb water and nutrients, and store energy. Root vegetables are divided into six subgroups: Tubers, Tuberous Roots, Tap Roots, Corms, Rhizomes, and Bulbs. Tubers differ from other roots in the way that they are swollen underground stems and capable of producing new plants to store energy for the parent plant. If the parent plant dies, the underground tubers can create new plants. Other roots can take nutrients from the ground, but cannot store energy or use it for reproduction. So while every tuber is a root vegetable, not all roots are tubers. Nutritionally, roots and tubers have a great potential to provide economical sources of dietary energy.
ISSN(Online): 2319-8753 ISSN (Print): 2347-6710
I
nternational
J
ournal of
I
nnovative
R
esearch in
S
cience,
E
ngineering and
T
echnology
(An ISO 3297: 2007 Certified Organization)
Website: www.ijirset.com Vol. 6, Issue 6, June 2017
II.
MATERIAL AND METHODS
Sample collection and preparationAll samples of root vegetables such as potato (Solanum tuberosum), carrot (Daucus carota sativus), red beet (Beta vulgaris) and turnip ( Brassica rapa) with their corresponding soil samples are collected from different fields of Addis Ababa particularly Akaki farm (located at latitude of 9.010, longitude of 38.710 ) and Kera farm (located at latitude of 8.980 , longitude of 38.70 and altitude of 2253.11 m above ellipsoid) and Debre Berhan (located at latitude of 9.60 , longitude of 39.50 and altitude of 2769.68 m above ellipsoid ) and stored in polyethene bags. The selected root vegetables for the study are usually consumed by all income groups of rural and city population. Vegetable samples are washed with a tap water and double distilled water to remove dust particles and non-edible parts are removed from them. After washing, all the samples are peeled and cut in small pieces using stainless steel knife then dried in an oven at a temperature 650C for 48 hours to remove moisture in them. Soil samples are also collected from randomly distributed sampling points within the study farms using plastic spade in the same periods as the vegetables samples. Each soil samples is collected by removing the surface soil and sampling vertically from 0 to 20 cm borehole. During each sampling program, ten to twenty samples are collected and thoroughly mixed in the field, from which three composite samples weighing about 1 kg each brought to laboratory those packed in plastic bags. All the samples are mixed again and quartered in the laboratory and one fourth of each sample was dried in an oven at temperature of 650C for 48 hours. After drying the samples were gently grinded with clean agate mortar and pestle to fine powder and stored in clean dried plastic containers. The homogenized samples are prepared by weighing 150mg and Pellets of (1mm thick and 13mm diameter are prepared using a tabletop pelletizer at a pressure of 100 − 110 kg/cm2. A minimum of 3 pellets of each sample are made to reduce the error in the analysis.
Experimental studies
Experimental studies of the samples have been carried out at UGC-DAE Consortium for Scientific Research, Kolkata Centre using a Xenemetrix (erstwhile Jordan Valley) EX 3600 EDXRF spectrometer and operating conditions of this instrument is shown in table 1. The precision and trueness of the EDXRF method is checked by analysing certified reference materials made from leaves (NIST 1515 ‘Apple leaves’ and Oriental Tobacco leaves (CTA-OTL-1) from National Institute of Standards and Technology), therefore expected to have a similar matrix composition and the measured value of the elements are not significantly different from the certified value as shown in table 2. It is important to be aware of the fact that the measurement of elemental concentrations is fraught with a number of difficulties. Different values are often obtained from the same sample tested at various laboratories. The influencing factors include the precise digestion methodology used, the sensitivity of the heavy metal detection instrument, the potential for contamination of samples and the potential for interference from other chemicals when assessing the levels of certain heavy metals. Great care is taken to assure the reliability of data being presented here. Internationally certified plant standards reference material (SRM) is an important tool for the quality control process. This material has known concentrations of the elements that are concerned with the present study; these can be used to test the reliability of findings from a range of laboratories.
Table 1: Operating condition of EX 3600 EDXRF spectrometer (e1 (spectrum1), e2 (spectrum2), e3 (spectrum 3))
Parameters 1 2 3
Filter None 3-Ti 4-Fe Emission current(µA) 240 900 45 High voltage (Kv) 6 14 37 Preset time(S) 200 900 300 Atmosphere vacuum vacuum vacuum Energy Range(KeV) 10 10 40
ISSN(Online): 2319-8753 ISSN (Print): 2347-6710
I
nternational
J
ournal of
I
nnovative
R
esearch in
S
cience,
E
ngineering and
T
echnology
(An ISO 3297: 2007 Certified Organization)
Website: www.ijirset.com Vol. 6, Issue 6, June 2017
Table 2: Comparison between present results and the certified values of standard reference materials (%(*) and ppm) NIST (SRM 1515) Apple leaves and Tobacco leaves (CTA-OTL-1)
NIST (SRM 1515) (CTA-OTL-1) Elements Certified
value
Present work
Certified value
Present work Ca 15260.00 15581.52 3.17±0.12 * 3.038 * K 16100.00 15878.04 1.56±0.05* 1.36 * S 18000.00 18780.64 0.732±0.081* 0.684 * P 15900.00 15278.01 2892±134 4723.83 Zn 12.5 14.5 49.9±2.4 46.69
Cu 5.64 7.08 14.1±0.5 12.57 Ni 0.91 0.73 6.32±0.65 6.68 Fe 83.00 71.70 989 1000.34 Mn 54.00 47.98 412±14 421.12
Cr 0.30 1.15 2.59±0.32 2.13 Ba 49.00 67.97 84.2±11.5 82.26 Sr 25.00 29.29 201±20 205.27 Rb 10.20 9.85 9.79±1.27 10.61 Br 1.80 4.26 9.28±1.06 11.78 Se 0.05 0.11 0.153±0.018 0.11
*Italic (percent), normal (ppm)
As tabulated in table 2 the standard deviations of the measured values are mostly with in ±5-10%; which may represent a good agreement between the measured and certified values.
III. RESULTS AND DISCUSSION
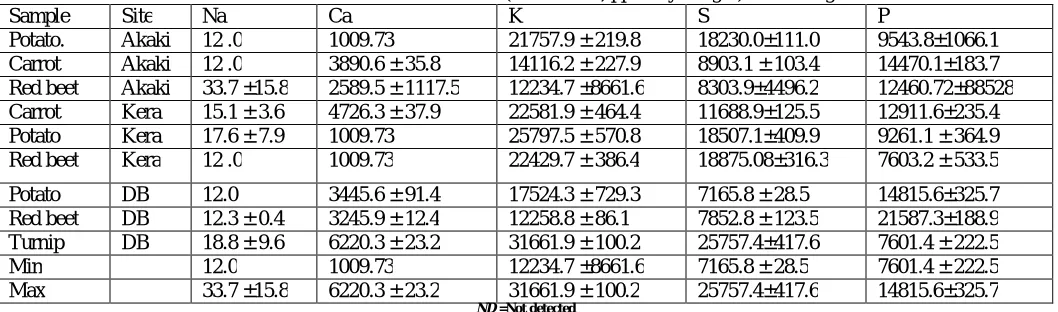
Table 3, shows a wide variation in the elemental concentrations of the different vegetable samples studied. Several trace elements are important micronutrient to the human body and are required for well being of body immune system. The elements that are found in this study are Na, K, Ca, P, Co, Cr, Cu, Fe, Mn, Ni, S, Zn, As, Br, Ba, Pb, Rb, and Sr (table 3-5). These elements are necessary and needed for the proper growth, development, and physiology of an organism. The values are given as (mean ± SD, ppm) and the results are means of three replicates. The elemental concentrations determined are based on plants dry weight. Four elements are found in major compositions; Ca (1009.73 ±0.00 - 6220.3 ± 23.2 ppm), K (12234.7 ±8661.6 - 31661.9 ± 100.2 ppm), S (7165.8 ± 28.5 - 25757.4±417.6 ppm) and P (7601.4 ± 222.5 - 14815.6±325.7 ppm) for all the studied root vegetables.
Table 3: Concentration of macro-elements (mean ± SD, ppm dry weight) in root vegetables
Sample Site Na Ca K S P
Potato. Akaki 12 .0 1009.73 21757.9 ± 219.8 18230.0±111.0 9543.8±1066.1 Carrot Akaki 12 .0 3890.6 ± 35.8 14116.2 ± 227.9 8903.1 ± 103.4 14470.1±183.7 Red beet Akaki 33.7 ±15.8 2589.5 ± 1117.5 12234.7 ±8661.6 8303.9±4496.2 12460.72±88528 Carrot Kera 15.1 ± 3.6 4726.3 ± 37.9 22581.9 ± 464.4 11688.9±125.5 12911.6±235.4 Potato Kera 17.6 ± 7.9 1009.73 25797.5 ± 570.8 18507.1±409.9 9261.1 ± 364.9 Red beet Kera 12 .0 1009.73 22429.7 ± 386.4 18875.08±316.3 7603.2 ± 533.5
Potato DB 12.0 3445.6 ± 91.4 17524.3 ± 729.3 7165.8 ± 28.5 14815.6±325.7 Red beet DB 12.3 ± 0.4 3245.9 ± 12.4 12258.8 ± 86.1 7852.8 ± 123.5 21587.3±188.9 Turnip DB 18.8 ± 9.6 6220.3 ± 23.2 31661.9 ± 100.2 25757.4±417.6 7601.4 ± 222.5 Min 12.0 1009.73 12234.7 ±8661.6 7165.8 ± 28.5 7601.4 ± 222.5 Max 33.7 ±15.8 6220.3 ± 23.2 31661.9 ± 100.2 25757.4±417.6 14815.6±325.7
ISSN(Online): 2319-8753 ISSN (Print): 2347-6710
I
nternational
J
ournal of
I
nnovative
R
esearch in
S
cience,
E
ngineering and
T
echnology
(An ISO 3297: 2007 Certified Organization)
Website: www.ijirset.com Vol. 6, Issue 6, June 2017
The data presented in table 3 indicate that the highest content of Na (33.7 ±15.8) is found in red beet (Akaki farm), followed by turnip (18.8±9.6) and potato (17.6±7.9) of kera farm while the lowest concentration (12.0 ppm) is detected in potato and carrot of Akaki farm, red beet that belong to Kera farm and potato of Debre Berhan. The concentration of Na in potatoes and carrot of agricultural products collected from Belovo, Russia was found to be 28±19 and 450±230 ppm respectively [11]. This element is dominantly responsible for osmotic pressure of blood plasma. Maintaining normal osmotic pressure and volume of circulating blood is a vital process, which is mainly due to regulation of sodium absorption or secretion by kidneys. Sodium takes part in electric activity of nervous and muscular tissue also. Due to the difference in sodium concentration between blood and intracellular medium, living cells can generate electric current participating in activity of the nervous system, muscles and other organs. Sodium is an essential mineral or micronutrient, which along with potassium helps to regulate the body's fluid balance. Sodium deficiency is a very rare case. Excess sodium intake is linked with high blood pressure and heart disease. The current recommendation is to consume less than 2,400 milligrams (mg) of sodium per day. This is about 1 teaspoon of table salt in a day.
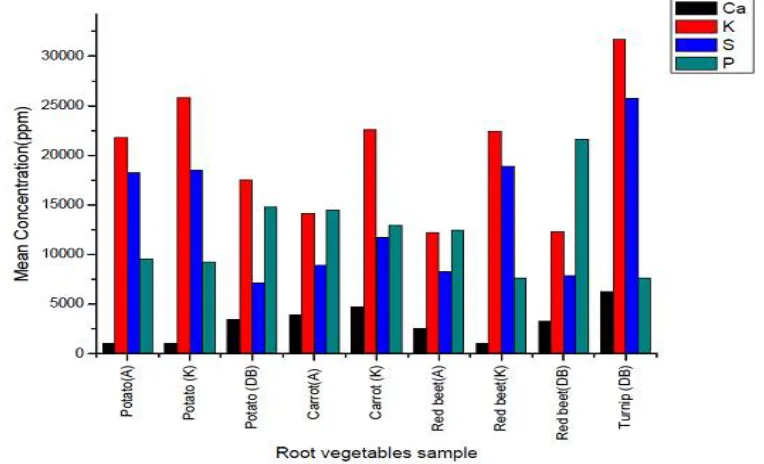
Potassium (K) and calcium (Ca) are the most abundant elements in the samples. It is observed that turnip root containing the highest concentration of K (31661.9 ± 100.2) and Ca (6220.3± 23.2) and the lowest content of K (12234.7 ±8661.6) is detected in red beet (from Akaki farm), similarly the minimum and same content of Ca (1009.73) is obtained from potato of both Akaki and kera farms, and red beet of kera farm. The recommended dietary intakes (DRIs) of K and Ca for adults are 4500 and 1300 mg/day respectively [12]. Earlier the concentration of K and Ca in carrot belong to Bangladesh was found to be 28581±425 and 6441±342 ppm respectively. This value seems to be twice of the present result [13]. The content of K in potatoes and carrots collected from Belovo were reported as 0.53±0.13 and 0.32±0.15% respectively [11]. Similarly the content of Ca in both of those vegetables was reported as 108±40 and 150±89, on comparison of these results with the present results, the presents values are lower by many folds. The observed values of K and Ca in the present study are lower than the earlier values of potatoes (K= 8.29±0.07%, Ca= 0.79±0.03%) and turnip root (K=4.38±0.06%, Ca=2.28±0.06%)) of south western Bangladesh that reported by M.R. Rahman [14]. These differences might be due to several factors such as change in the seed variety, growing area, type of soil, climate, used fertilizer and agricultural practice including analytical techniques.
Potassium is of great physiological importance, contributing to the transmission of nerve impulses, the control of skeletal muscle contractility, and the maintenance of normal blood pressure. Its deficiency symptom includes irregular heartbeat, loss of appetite and muscle cramps [15, 16]. This result indicates that turnip is the preferred root vegetable to reduce the risk related to bone and tooth structure, blood clotting, muscle contraction, and nerve impulse transmission. It also participates in glycogen metabolism [17-19]. Calcium intakes protect against the risk of hypertension and decrease bone loss. Because of the calcium content available in the three varieties of root vegetables that undertaken in the present study is below the Recommended Dietary Allowance (RDA) [20], these vegetables cannot lead to health challenge due to kidney stone problem (i.e. caused by excess intake of calcium).
The maximum content of sulfur (25757.4±417.6) is found in turnip while the lowest 7165.8 ± 28.5 obtained in potato belonging to Debre Berhan. Converse to this, the highest content of phosphorous (14815.6±325.7) is detected in potato (DB) while the lowest (7601.4 ± 222.5) is found in turnip (DB).
Distributions of essential trace elements in different kinds of vegetables viz. Potato, carrot, red beet and turnip collected from the present study areas are listed in Table 4. The observed variation in the element content for all types of analyzed root vegetables could be due to variable capabilities of absorption and accumulation of elements [21], variations in growth period and growth rates [22], and climatic differences of the producing areas [23]. Table 4: shows the mean concentrations of trace elements investigated in root vegetables commonly consumed in Addis Ababa and Debre Berhan of Ethiopia. The results are given as mean ± SD (ppm).
ISSN(Online): 2319-8753 ISSN (Print): 2347-6710
I
nternational
J
ournal of
I
nnovative
R
esearch in
S
cience,
E
ngineering and
T
echnology
(An ISO 3297: 2007 Certified Organization)
Website: www.ijirset.com Vol. 6, Issue 6, June 2017
Fig 1 shows the mean concentration of major elements in root vegetables collected from Akaki farm, Kera farm and Debre Berhan.
Fig. 1 Macro-elements in Root vegetables from Akaki, Kera and Debre Berhan
Table 4: Essential trace elements distribution in root vegetables
Sample Site Zn Cu Ni Co Fe Mn
Carrot Akaki 25.3 ± 1.5 8.5 ± 1.8 1.45 ± 0.9 ND 116.1 ± 5.5 0.43 Potato Akaki 20.6 ± 1.6 6.4 ± 0.8 1.1 ± 0.5 0.47 15.4 ± 0.6 4.8 ± 0.8 Red beet Akaki 28.5 ± 1.4 7.1 ± 0.5 1.2 ± 0.3 ND 231.1 ± 17.1 18.1 ± 1.2 Carrot Kera 29.1 ± 7.5 4.6 ± 1.0 2.0 ± 0.9 0.45 ± 0.02 18.3 ± 0.3 3.4 ± 0.6 Potato Kera 29.6 ± 1.6 2.4 ± 0.5 0.8 ± 0.06 0.46 48.8 ± 0.9 ND Red beet Kera 23.6 ± 0.7 6.2 ± 1.1 2.2 ± 0.7 0.46 28.2 ± 4.9 3.3 ± 1.0 Potato DB 56.4 ± 4.2 7.1 ± 2.4 1.2 ± 0.3 0.42 60.2 ± 43.7 26.9 ± 1.8 Turnip DB 20.2 ± 1.2 2.4 ± 0.5 1.2 ± 0.6 ND 17.3 ± 0.8 ND Red beet DB 46.9 ± 0.6 9.5 ± 0.4 2.3 ± 0.5 ND 67.8 ± 1.6 236.4 ± 4.3 Min 20.2 ± 1.2 2.4 ± 0.5 0.8 ± 0.06 ND 15.4 ± 0.6 0.43 Max 56.4 ± 4.2 9.5 ± 0.4 2.3 ± 0.5 0.47 231.1 ± 17.1 236.4 ± 4.3
ND =Not detected
Some heavy metals are essential to maintain human body normal functions at trace amounts. However, they may be dangerous or even toxic if present at higher concentrations. Among many trace elements Cu, Fe, Mn, and Zn are defined as micronutrients because they are essential for physiological processes in living organisms; therefore, they make significant components of the soil plant food continuum or the food chain.
ISSN(Online): 2319-8753 ISSN (Print): 2347-6710
I
nternational
J
ournal of
I
nnovative
R
esearch in
S
cience,
E
ngineering and
T
echnology
(An ISO 3297: 2007 Certified Organization)
Website: www.ijirset.com Vol. 6, Issue 6, June 2017
in other words zinc is very necessary for the body in varieties of ways including manufacturing of DNA, wound healing, maintaining strong immune system for fighting cold, flu, and other infections [25].
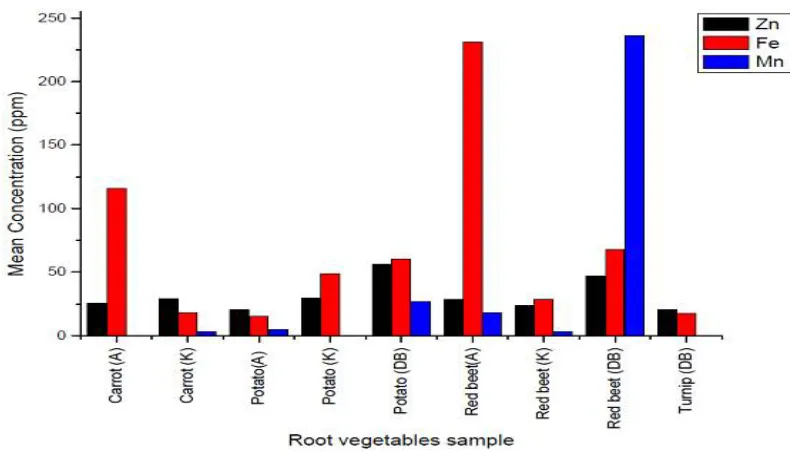
Among the selected vegetables that belong to the above mentioned three sites, the highest concentration of Zn (56.4 ± 4.2 ppm) is detected in potato (DB) while it is lowest (20.2 ± 1.2 ppm) in turnip (DB). The maximum level of copper (9.5 ± 0.4) is available in red beet (DB) where as the lowest (2.4 ± 0.5) observed in turnip (DB). Copper is one of the important nutrients required for the human body. But exceeding the safe limit mentioned by WHO may lead to gastrointestinal problem. It may cause dysfunction of metabolism related with other nutrients. The safe limit proposed by WHO is 73.3 mg/kg (ppm) in vegetables.
The observed values of Zn and Cu in the present study can be compared with the earlier reported values in the investigations did in Bangladesh [13] (Zn=45.28 and Cu=5.35±0.31 ppm). A study from Pakistan [26] reported that the range of Zn concentration in potatoes, turnip, Beet and carrot was 10.35-42.81, 1.28-3.87, 34.73-60.26 and 14.04-25.95 ppm respectively. On the other hand Copper level was reported in the range of 1.09-6.12, 2.87-6.5, 6.49 and 1.9-9.51 ppm. These results can be comparable with the observations of the present study. An investigation entitled “Assessment of some heavy metals in vegetables, cereals and fruits in Saudi Arabian markets” that performed in Saudi Arabia [27] reported the concentration of Zn in potato, turnip and carrot those collected from middle district as 17.65±1.10, 14.27±0.2 and 26.64±0.98 ppm. Similarly copper level in these three root vegetables was also reported as 6.41±0.22, 14.27±0.2 and 4.49±0.19 ppm respectively. The results of the present study are found to be higher in many folds with the observations obtained in the study performed in Russia [11]. Potatoes, beets and carrot belonging to Belovo were found to have Zn level of 3.4±0.9, 7.1±6.8 and 6.1±3.5 ppm respectively. Similarly Cu content of these vegetables were also reported as 0.62±0.3, 1.1±0.22 and 0.44±0.12 ppm respectively. Zinc level in Beet root of the present study that collected from Kera and Akaki farms is found to be in the same range that reported earlier by Sharma et al, [43]. The obtained compliance between the results of the both the studies might be due to the fact that the collected Beet root samples were irrigated with waste water. In the present studies samples are collected from the farm irrigated with waste water related to the rivers of Akaki and Kera.
The Root vegetables are found to contain nickel also at substantive level of quantity. The highest level of Nickel (2.3 ± 0.5) ppm is detected in Red beet (DB) and the lowest level (0.8 ± 0.06) obtained in potato (Kera). In the present studies the observed concentration of Ni in carrot is found to be higher than the result (0.65 ppm) reported earlier [13]. The earlier data reported [26] about Ni concentration in potatoes, turnip, Beet and carrot 1.29-19.02, 1.02-32.51, 1.1-31.03 and 1.13-9.97 ppm respectively found to be higher than the obtained results of the present study. Large quantities of nickel uptake have the chances of lung cancer, nose cancer, larynx cancer and prostate cancer, Asthma and chronic pain development. The result of the present study related to all the samples is found to be lower than the maximum uptake limit (67 ppm) that set by FAO/WHO.
Cobalt is usually contributed with vitamin B12 and its deficiency effect on vitamin B12 show consistency in the body. As shown in table 4 the determined concentrations of cobalt in most of the tuber vegetables fall within a very narrow range having no noticeable variability seen among them. In addition to that cobalt is not detected in the vegetables those collected from Debre Berhan, similarly in potato and carrot of Akaki also. This might be due to low content of cobalt in the soil of the samples collected area.
ISSN(Online): 2319-8753 ISSN (Print): 2347-6710
I
nternational
J
ournal of
I
nnovative
R
esearch in
S
cience,
E
ngineering and
T
echnology
(An ISO 3297: 2007 Certified Organization)
Website: www.ijirset.com Vol. 6, Issue 6, June 2017
Table 4 reveals that the concentration of manganese in the present studies ranges between 0.43 and 236.4 ± 4.3 ppm. The lower concentration in carrot that collected from Akaki farm and higher quantity in red beet, which belong to Debre Berhan university agricultural research centre, is obtained. Manganese content in the examined vegetables samples is higher than the earlier work [27]. Earlier the concentration of manganese in four root vegetables ranges as Potatoes (10.43-30.91 ppm), Turnip (14.47-25.83), Beet (67.39-87.37) and carrot (11.34-22.85 ppm) was reported [26]
having highest in the Beet. Similarly in the present studies also the higher content of Mn is found in red beet while the lowest content observed in the carrot. The results show that among all the selected root vegetables; beet root accumulate much higher concentrations of Mn. In the present study the concentration of Mn in all the studied samples is found to be lower than the permissible limit that set by FAO/WHO (2001) [28].
Fig. 2 Microelements in Root vegetables from Akaki, Kera and Debre Berhan
As shown in fig. 2 above, the mean concentration of Fe is found to be highest in all vegetables sample except in red beet collected from Debre Berhan. In general all root vegetables in present study were found to be a good source of essential trace elements.
Table 5: Trace elements and toxic heavy metals concentration in root vegetables
Sample Site Cr V As Pb Ba Sr Rb Br
Potato Akaki 1.8 ± 0.9 0.4 ± 0.03 0.06 0.7 67.3 9.2 ± 1.2 23.5 ± 2.6 12.7 ± 2.6 Carrot Akaki 3.8 ± 0.4 0.5 ± 0.1 0.6 ± 0.3 5.6 ± 2.9 96.9 ± 21.6 18.2 ± 0.5 39.9 ± 2.9 21.5 ± 1.1 Red beet Akaki 3.3 ± 0.6 1.2 0.8 ± 0.1 7.8 ± 1.1 73.9 ± 8.9 21.7 ± 1.5 8.1 ± 0.8 62.6 ± 2.5 Carrot Kera 2.9 ± 0.2 0.7 ± 0.2 0.16 1.5 72.3 ± 6.3 29.8 ± 1.9 17.9 ± 1.7 48.4 ± 0.5 Potato Kera 2.1 ± 1.2 0.39 0.18 1.77 71.5 ± 4.1 7.2 ± 0.5 36.8 ± 1.7 10.6 ± 1.2 Red beet Kera 2.9 ± 0.5 0.42 ± 0.02 0.1 0.96 67.25 8.0 ± 1.8 27.7 ± 6.1 15.9 ± 2.9 Potato DB 3.2 ± 0.1 0.6 ± 0.2 0.28 2.6 ± 2.1 71.4 ± 3.8 22.6 ± 2.4 31.7 ± 4.4 17.0 ± 1.3 Red beet DB 3.5 ± 0.2 0.6 ± 0.2 1.8 ± 0.3 1.64±0.25 67.3 ± 0.1 20.1 ± 0.9 9.7 ± 0.9 6.5 ± 0.8 Turnip DB 2.0 ± 0.2 0.6 ± 0.07 0.3 ± 0.05 2.6 ± 0.5 69.5 ± 2.2 23.9 ± 2.4 18.9 ± 1.1 13.4 ± 1.5
Min 1.8 ± 0.9 0.39 0.06 0.7 67.25 7.2 ± 0.5 8.1 ± 0.8 6.5 ± 0.8
ISSN(Online): 2319-8753 ISSN (Print): 2347-6710
I
nternational
J
ournal of
I
nnovative
R
esearch in
S
cience,
E
ngineering and
T
echnology
(An ISO 3297: 2007 Certified Organization)
Website: www.ijirset.com Vol. 6, Issue 6, June 2017
Chromium accumulation ranges from 1.8 ± 0.9 (potato of Akaki farm) to 3.8 ± 0.4 ppm mg/kg (carrot of Akaki farm)) in the four species of investigated vegetables. In the present work Cr concentrations are found to be higher than the limit of 2.4 mg/kg dry weight that set by FAO/WHO (2001) except potatoes those collected from Akaki farm. But based on the Cr concentration value 20 mg/kg, which set by Prevention and Food Adulteration Act safe limit pertaining to vegetables [33]; presently selected Ethiopia root vegetables are on the safe side. The chromium content in Rajshahi vegetables was found to be several folds lower than that reported in Titagarh, West Bengal, India (34.83–96.30 mg/kg) [33], and this variation might due to the differences in the sources of pollution. Earlier the observed Cr level 0.01–0.21 μg/g in the northern area and 0.01– 0.22 μg/g in the southern area of Tarragona Province of Spain was reported [34]. Similarly in the present studies also lower concentration of Chromium is obtained. Cr may affect the respiratory tract, stomach and small intestine if the concentration of it exceeds the safe limit of 5.0 mg/kg. Even it may affect the male reproductive system too.
The other micro nutrient detected in the present root vegetables is vanadium; it ranges from 0.39 to 1.2 ppm. The highest level (1.2 ppm) is detected in red beet collected from Akaki vegetable farm while the lowest (0.39) obtained in potato of Kera vegetable farm. In the earlier study [35] vanadium compounds were shown to increase bone formation without any adverse health effects for both diabetic and non-diabetic rats. Vanadium is known to have a role in the regulation of sodium; the metabolism of glucose and sugar. It has also been shown to promote bone health without negative side effect. However, in the literature [36] it indicates that the essentiality vanadium in humans had been hypothesized without demonstration.
Heavy metals such as Arsenic and lead are substantially known as toxic elements due to their ability for bioaccumulation in the human body, resulting in multi-organ disruption. The mechanism of toxicity for heavy metals can be explained by their ability to interact with nuclear proteins and DNA causing oxidative deterioration of biological macromolecules [37]. Among the root vegetables collected from the study areas the highest level of arsenic (1.8 ± 0.3) is measured in red beet (DB) while the lowest level (0.06) is detected in potato of Akaki. The maximum level of lead (7.8 ± 1.1) is found in red beet (Akaki) while the minimum (0.7) in potato (Akaki). Lead is one of the prominent metals that are carcinogenic in nature. The accumulation of lead in human body may cause cancer as it will damage the mitochondria of the cell. As far as the safe limit is concerned it is about 1.0 mg/kg in vegetables. The recommended and tolerance limits of arsenic in foodstuffs, water, and soil are prescribed to be 1.0, 0.05, and 20 mg/kg, respectively [38]. In the earlier studies, arsenic concentration in the vegetables those collected from Bangladesh was found to exist in the range 5 to 540 μg/kg with a mean value 54.5μg/kg. The highest levels of arsenic were detected in ghotkol, taro (loti from arum plant) and snake gourd having values 446, 440, and 489μg/kg respectively [40]. These values are lower when compared with the average arsenic content value obtained in the present investigation.
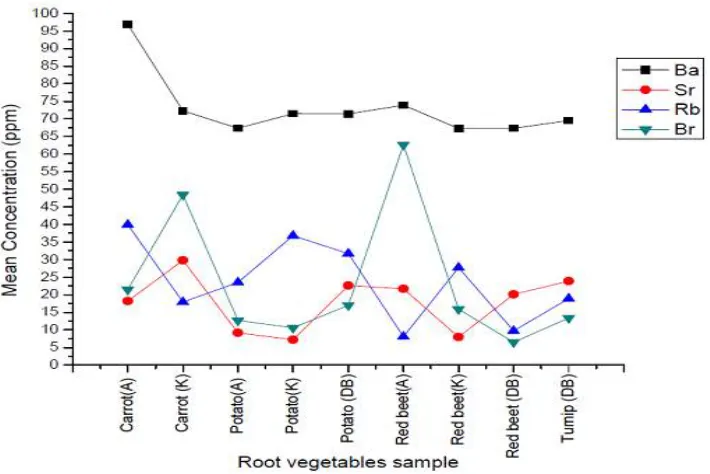
Daily Intake Rate (DIR) is very useful for assessment of human health hazard. The degree of toxicity of heavy metals to humans depends on the daily intake. The safe limit of toxic metals such as Pb and arsenic is about 0.005 mg per person per day. So, as far as the analysis and DIR is concerned to the Pb and arsenic show beyond the safe limit mentioned by WHO/FAO. Thus there is some possibility of having neurological disorders, cancer and paralysis if these vegetables are taken for long duration. The possible targeted organs of heavy metals among humans are soft tissues such as the kidney, liver and the central nervous system. The highest concentration of Barium (Ba), Strontium (Sr) and Rubidium (Rb) are observed in carrot with the value of 96.9 ± 21.6 (Akaki farm), 29.8 ± 1.9 (Kera farm) and 39.9 ± 2.9 ppm (Akaki farm) respectively. The lowest content of these three elements are detected in the both red beet and potato of Kera farm. Similarly these three elements present in Red beet of Akaki farm with the concentration of 67.25, 7.2 ± 0.5 and 18.9 ± 1.1 ppm. On the other hand the highest content of Br (62.6 ± 2.5) is detected in red beet (Akaki farm) while the lowest content (6.5 ± 0.8) observed in red beet (DB).
ISSN(Online): 2319-8753 ISSN (Print): 2347-6710
I
nternational
J
ournal of
I
nnovative
R
esearch in
S
cience,
E
ngineering and
T
echnology
(An ISO 3297: 2007 Certified Organization)
Website: www.ijirset.com Vol. 6, Issue 6, June 2017
Fig. 3 Heavy and Toxic metals in root vegetables collected from Akaki, Kera and Debre Berhan
As shown in Fig.3 heavy metals concentration of all the tested vegetables those grown in the waste water irrigated area of the present study when compared with the prescribed limit of FAO/WHO (2001) are observed that level of As, Pb and Cr in edible parts of the vegetables exceeded the recommended safe limit,
Table 6: Elemental composition of (mean ± Standard deviation, ppm) soil
Elements Akaki Debre Berhan Kera Safe limit a
Na 7327.5 ± 580.2 5428.9 ± 248.6 5661.1 ± 218.9 Ca 17088.1 ± 1467.9 7511.2 ± 214.2 18928.0 ± 34.5 K 15841.6 ± 1655.6 16540.1 ± 628.8 19121.7 ± 244.1
Zn 175.3 ± 6.7 162.4 ± 5.8 386.2 ± 12.5 300-600
Cu 49.5 ± 4.5 61.7 ± 1.1 87.6 ± 2.7 135-270
Ni 51.2 ± 8.9 44.6 ± 2.2 48.2 ± 2.6 75-150
Fe 91347.9±1279.1 86378.2 ±1531.1 94734.8 ± 2684.2
Mn 2546.7 2555.3 ± 156.7 3988.0 ± 101.6
Cr 195.2 ± 12.0 170.7 ± 8.3 204.6 ± 20.3
As 7.0 ± 0.01 6.98 ± 0.01 7.4 ± 0.03
Cd 2.3 1.5 ± 1.1 2.32 3-6
Pb 19.1 ± 7.3 18.1 ± 4.6 208.9 ± 27.5 250-500
V 413.2 ± 8.12 358.1 ± 14.5 485.5 ± 14.4
Ba 346.9 ± 1.1 354.1 ± 2.5 344.8 ± 1.1
Mo ND 0.5 ± 0.3 ND
Sr 176.5 ± 5.7 71.6 ± 4.1 358.5 ± 16.7
Se 0.55 6.06 1.17
a
ISSN(Online): 2319-8753 ISSN (Print): 2347-6710
I
nternational
J
ournal of
I
nnovative
R
esearch in
S
cience,
E
ngineering and
T
echnology
(An ISO 3297: 2007 Certified Organization)
Website: www.ijirset.com Vol. 6, Issue 6, June 2017
Concentration of major and toxic element in soil
Soil is an essential component of the environment. It is the basis for terrestrial ecosystems and acts as the interface between the biosphere and lithosphere; it is the medium in which many biogeochemical cycles occur. Therefore soil quality must be preserved. Nevertheless, recent increase in the concentrations and distributions of anthropogenic xenobiotic (foreign substances to the body or ecological system) resulted possibly to become as toxic elements in soils. This is caused due to the mismanagement of industrial and mining resources resulting as concern one around the world. Elemental concentrations found in the soil that collected from the three sites are summarized in Table 6. The average concentration of major elements Na, Ca, K and Fe of the surface soil are found to have the range of (5428.9-7327.5), (7511.2- 18928.0), (15841.6-19121.7) and (86378.2- 94734.8) mg kg-1 (ppm) respectively whereas the average concentration of heavy and toxic elements like V, Cr, Cu, Zn, As, Mn, Ni, Se, Sr, Ba, Mo and Pb are found to exist in the range of (358.1-485.5), (170.7-204.6), (49.5-87.6), (162.4- 386.2), (6.98-7.4), (2546.7-3988.0), (44.6-51.2), (0.55-6.06), (71.6-358.5), (344.8-354.1), (0-0.5) and (18.1-208.9) mg kg-1 (ppm) respectively. According to Pendias and Pendias (2000) [21] concentration of all the elements measured in the soil is lower than the World Average value. The elemental concentration in the soil follows a trend that related to the above but varied according to the sampling. Molybdenum (Mo) and cadmium (Cd) were detected in soil, which are not present in the present studies might be due to less number of selected vegetables and their low amount. The presence of Mo and Cd depends upon their chemical forms and concentration in the soil, their difference in uptake capacity and growth rate in the soil.
The mobility of metals from soil to plant is a function of bioavailability of metal, which in turn on different plant species [41]. Soil to plant transfer is a parameter used to describe the transfer of trace elements from soil to plant body so that soil to plant transfer is one of the key components of human exposure to metals through food chain. The higher value of metals in leafy parts may be due to higher transpiration rate to maintain the growth and moisture content of the plant.
ISSN(Online): 2319-8753 ISSN (Print): 2347-6710
I
nternational
J
ournal of
I
nnovative
R
esearch in
S
cience,
E
ngineering and
T
echnology
(An ISO 3297: 2007 Certified Organization)
Website: www.ijirset.com Vol. 6, Issue 6, June 2017
IV. CONCLUSION
The analysed vegetables in the present study are important ingredients of human diet that contains essential nutrients and trace elements. Nineteen (19) elements such as Na, K, Ca, P, S, Zn, Cu, Ni, Co, Fe, Mn, Cr, V, As, Pb, Ba, Sr, Rb and Br are detected in four varieties of root vegetables. All the samples are found to have sufficient concentration of essential elements such as K, Ca, P, Zn, Fe and Mn. Rapid industrialization and urbanization of the capital, Addis Ababa with insufficient environmental monitoring planning often results in discharging of the industrial and sewage waste into rivers such as Akaki and Kera rivers leading to gradual increase of pollution in the water resource. Such waste water is drained to the agricultural land where this polluted water is used for irrigating crops including root vegetables. Heavy metals concentration of all the tested vegetables those grown in the waste water irrigated area of the present study when compared with the prescribed limit of FAO/WHO (2001) are observed that level of As, Pb and Cr in edible parts of the vegetables exceeded the recommended safe limit, but Zn, Cu, Ni, Co, Fe and Mn concentrations of all the root vegetables are within the recommended safety standard. The present study revealed that untreated irrigated water is the main cause of soil pollution in Akaki and Kera farms causing to increase in the level of heavy and toxic metal concentrations in root vegetables.
REFERENCES
[1] Beckhoff B, Kanngießer B, Langhoff N, Wedell R, Wolff H (eds) “Handbook of practical X-ray fluorescence analysis”, Springer, Berlin, pp 1–31, 2006
[2] West M, Ellis AT, Potts PJ, Streli C, Vanhoof C, Wegrzynek D, Wobrauschek P, “Atomic spectrometry update. X-Ray fluorescence spectrometry”, J Anal At Spectrom 24 (1289–1):326, 2009
[3] West M, Ellis AT, Potts PJ, Streli C, Vanhoof C, Wegrzynek D, Wobrauschek P, “Atomic spectrometry update–X-Ray fluorescence spectrometry”, J Anal At Spectrom 25 (1503–1):545, 2010
[4] Peter Wobrauschek and Christina Streli , “Energy Dispersive, X-ray Fluorescence Analysis”, Atominstitut, Vienna Universilty of Technology, Vienna, Austria , Eva Selin Lindgren Rector’s Office, University of Boras, Boras, Sweden)
[5] Committee on Military Nutrition Research (CMNR): Institute of Medicine, “The role of Protein and Amino Acids in Sustaining and Enhancing Performance”, 1999
[6] National Cancer Institute (NCI), National Institutes of Health, “Diet, Nutrition & Cancer Prevention”, The Good News. NIH Publication No. 87–2878, Bethesda, Maryland, US, 1986
[7] National Research Council (NRC) Committee on “Diet and Health”, Commission on Life Sciences; Division on Earth and Life Studies., 1989. Diet and Health: Implications for Reducing Chronic Disease Risk.
[8] Ekholm, P., Reinivuo, H., Mattila, P., et al. “Changes in the mineral and trace element contents of cereals, fruits and vegetables in Finland”, Journal of Food Composition and Analysis, vol. 20, N 6, p. 487- 495, 2007
[9] J. H. Block, E. B. Roche, T. O. Soine et al, “Inorganic Medicinal and Pharmaceutical Chemistry”, Varghese Publishing House, India, 1986. [10] A. B. Williams, O. O. Ayejuyo and A. F. Ogunyale, “Trace metal levels in fruit juices and carbonated beverages in Nigeria,” Environmental
monitoring and assessment, vol. 156, no. 1-4, pp.303-306, 2009.
[11] A.V.Garbunov, S.M.Lyapunov, O.I.Okina, M.V.Frontasyeva, S.S.Pavlov, “Nuclear and related analytical techniques in ecology: Impact of geological factors on the balance of trace elements in the human organism”, ISSN 10637796, Physics of Particles and Nuclei, 2012, Vol. 43, No. 6, pp. 783–824. © Pleiades Publishing, Ltd., 2012
[12] Dietary reference intakes (DRIs), “Recommended intake for individuals”, in: food and nutritional board, Institute of medicine, National Academies, Washington DC, 2004
[13] Yeasmin Nahar Jolly1*, Ashraful Islam1, Shawkt Akbar2, “Transfer of metals from soil to vegetable and possible health risk assessment”,
Springer, 2013
[14] M.R. Rahman1,2, M.A. Shariff3, M. O. Rahman2, “Studies of essential and trace elements in some fruit and vegetables of south western Bangladesh by PIXE technique”, Pakistan journal of nutrition 13(2): 62-66, ISNN 1680-5194, 2014
[15] Nielsen, F.H.; Mertz, W. (Ed.), “Importance of Trace elements in Human and Animal Nutrition”, San Diego Academic Press, 245-73b, 1987
[16] Sodium in Food, www.annecollines.com/sodium- food.htm, accessed on March 2009
[17] Mengel, K. and Kirkby, M.A, “ Principles of plant nutrition”, International Potash Institute, Worbaufen-Bern, Switzerland , 687 pp, 1987 [18] Krebs-Smith, S.M.; Cleveland. L.E.; Ballard-Barbash, R.; Cook, D.A.; Kahle, L.L., “Characterizing Food Intake Patterns of American
Adults”, Am. J. Clin. Nutr. 65, 1264S –1268Sd, 1997
[19] World Health Organization (WHO), “Trace Elements in Human Nutrition and Health”, WHO, Geneva, 1996
[20] Tortora, G.J., “Introduction to Human Body; the Essential of Anatomy and Physiology”, 4th ed., John Wiley and Sons: New York, 472-474b,
1997
[21] Pandey, J., & Pandey, U., “Accumulation of heavy metals in dietary vegetables and cultivated soil horizon in organic farming system in relation to atmospheric deposition in a seasonally dry tropical region of India. Environmental Monitoring and Assessment”, 148, 61–74, 2009 [22] Moseholm, L., Larsen, E. H., Andersen, B., & Nielsen, M. M., “Atmospheric deposition of trace elements around point sources and human
ISSN(Online): 2319-8753 ISSN (Print): 2347-6710
I
nternational
J
ournal of
I
nnovative
R
esearch in
S
cience,
E
ngineering and
T
echnology
(An ISO 3297: 2007 Certified Organization)
Website: www.ijirset.com Vol. 6, Issue 6, June 2017
[23] Santos, E. E., Lauri, D. C., & Silveira, P. C. L., “Assessment of daily intake of trace elements due to consumption of foodstuffs by adult inhabitants of Rio de Janeiro city”, Science of the Total Environment, 327, 69–79, 2006
[24] Natural Health Information Centre, “Iodine, Cupper. Medical Control, Modulation of Oestrogen and Foetal Health”, http://www.natural-health-information-centre.com/calcium.html, 2012
[25] NutriHerb, “Dietary Supplement Shop, Health and Wellness Library: Zinc,” http://www.nutriherb.net/zinc.html, 2012
[26] Adeel Mahmood a,*, Riffat Naseem Malik b, “Human health risk assessment of heavy metals via consumption of contaminated vegetables collected from different irrigation sources in Lahore, Pakistan,” Arabian Journal of Chemistry ,7, 91–99, 2014
[27] Mohamed H.H. Ali a,b,*, Khairia M. Al-Qahtani a, “Assessment of some heavy metals in vegetables, cereals and fruits in Saudi Arabian markets,” Egyptian Journal of Aquatic Research, 38, 31–37, 2012
[28] Codex Alimentarius Commission (FAO/ WHO), “Food additives and contaminants. Joint FAO/WHO Food Standards Programme,” ALINORM 01/12A:1–289, 2001
[29] Halliday, J.W., “Hemochromatosis and iron needs”, Nutr. Rev. 56, S30-S37, 1998
[30] Rebouche, C.J.; Carnitine, I.; Shils, M.E.; Olson, J.A.; Shike, M.; Ross, A.C., “ Modern Nutrition in Health and Disease”, 9th ed. Philadelphia: Lippincott, Williams and Wilkins, 505-512b, 1999
[31] Agency of Toxic Substances and Disease Registry (ATSDR), “Toxicological Profile for copper”, Us Department of Health and Human Service Atlanta U.S.; 2004
[32] Goldhaber 2003, Goldhaber, S. B., “Trace element risk assessment: Essentiality vs toxicity”, Regulatory Toxicology and Pharmacology, 38, 232–242, 2003
[33] Gupta, N., Khan, D. K., & Santra, S. C., “An assessment of heavy metal contamination in vegetables grown in wastewater-irrigated areas of Titagarh, West Bengal, India”, Bulletin of Environmental Contamination and Toxicology, 80, 115–118, 2008
[34] Schuhmacher, M., Domingo, J. L., Llobet, J. M., & Corbella, J., “Chromium, copper, and zinc concentrations in edible vegetables grown in Tarragona Province, Spain”, Bulletin of Environmental Contamination and Toxicology, 50, 514–521, 1993
[35] D. M. Facchini, V. G. Yuen, M. L. Battell, J. H. McNeill and M. D. Grynpas, “The Effects of Vanadium Treatment on Bone in Diabetic and Non-Diabetic Rats,” Bone, Vol.38, No. 3, pp. 68-77, 2006
[36] L. L. Hopkins Jr. and H. E. Mohr, “Vanadium as an Essential Nutrient,” Federation Proceedings, Vol. 33, No. 6, pp. 1773-1775, 1974 [37] Leonard SS, Harris GK, Shi X., “Metal-induced oxidative stress and signal transduction”, Free Radic Biol Med; 37(12):1921-1942, 2004 [38] Anon , Codex alimentarius commission—report of the seventeenth session, 29 June–10 July. Rome: FAO/WHO.), 1987
[39] Rmalli, S. W. A., Haris, P. I., Harrington, C. F., & Ayub, M., “A survey of arsenic in foodstuffs on sale in the United Kingdom and imported from Bangladesh”, Science of the Total Environment, 337, 23–30, 2005
[40] Alam, M. G. M., Snow, E. T., & Tanaka, A., “Arsenic and heavy metal contamination of vegetable grown in Samta Village, Bangladesh”, Science of the Total Environment, 308, 83–96, 2003
[41] F.H. Tanianf and S .Barrington, “Zinc and copper uptake by plants under two transpiration ratios Part I. Wheat (Triticum aestivum L.),” Environ. Pollut. 138, 538-547, 2005
[42] Awashthi, S. K., “Prevention of food adulteration”, act no 37 of 1954. Central and state rules as amended for 1999 (3rd ed.), New Delhi: Ashoka Law House, 2000