ABSTRACT
FETZER, BRIAN LEWIS. Determination of Subsurface Nitrogen Contamination Using Tree Leaves and Stable Nitrogen Isotope Ratios. (Under the direction of Elizabeth Guthrie
Nichols).
Swine waste lagoons and waste application fields are a potential source of NH4 and NO3 contamination in groundwater and surface waters. Stable nitrogen isotopes can be used to determine nitrogen sources and their contribution to groundwater and surface waters when sources are specifically known. Swine waste has a unique δ15N signature, usually in the range of +10‰ to +20 ‰, while δ15
N signatures for trees are usually in the range of -4‰ to +2‰. This difference can be used to differentiate between an anthropogenic and
non-anthropogenic nitrogen sources to waters. This study focuses on the use of stable nitrogen isotope ratios, 15N/14N, of tree tissues as an indicator of subsurface nitrogen contamination from swine waste lagoons and waste application fields. Analysis of in situ groundwater parameters, nutrients (N-NO3 and NH4), chlorides, and δ15N-NO3 isotopic values of
groundwater was used to determine the extent of swine waste contamination in groundwater at an inactive swine facility in North Carolina. Increased concentrations of N-NO3 and ammonium, chlorides, as well as more positive δ15
N-NO3 indicated areas of swine waste contamination due to lagoon seepage or prior spray application. Comparisons of tree foliage δ15N and known areas that have swine waste in groundwater have more positive δ15
pines did reflect groundwater δ15
Determination of Subsurface Nitrogen Contamination using Tree Leaves and Stable Nitrogen Isotope Ratios
by Brian L. Fetzer
A thesis submitted to the Graduate Faculty of North Carolina State University
in partial fulfillment of the requirements for the Degree of
Master of Science
Natural Resources
Raleigh, North Carolina
2011
APPROVED BY:
___________________ ___________________
April James Heather Cheshire
___________________ __________________
Elizabeth Nichols Rick Bolich
ii Biography
Brian Fetzer was born in Patuxent River, Maryland, to Beverly and Edwin Fetzer on June 25, 1974. Born into a military family (US Navy), needless to say the family moved around quite a bit. His father’s Navy career took him all over the eastern seaboard of the United States including Maryland, Florida, Virginia, and finally back to Patuxent River, Maryland where his father retired. Due to job prospects in Eastern North Carolina, the family moved to New Bern, North Carolina where he attended middle and high school. Upon the completion of high school, Brian joined the US Navy and spent 1 year in Memphis Tennessee in training and was then stationed in Guam for his remaining time in service. In January of 2006, Brian attended North Carolina State University in pursuit of a bachelor in Environmental Technology which he graduated with in December 2007. Upon completion of his bachelors, he went to work for the NCSU Center for Applied Aquatic Ecology
iii
Acknowledgements
I would like to thank everyone that has supported me throughout the course of the last few years. First, I would like to thank Elizabeth Nichols for this opportunity; her patience and attention to detail aided me throughout the course of the project and especially during the writing of this thesis. In addition, I would like to thank my committee members Dr. April James, Dr. Heather Cheshire, and Rich Bolich for their assistance. I would also like to thank Damian Maddelena for his field, lab, and GIS assistance throughout this project. Many thanks to the Progress Energy Interns, including Terri Mann, Andrew McEachran, Heather Shipman, Chris Rhodes, Elizabeth Foote, and Marta Ponger for their assistance both in the field and the laboratory. Additionally, I would like to thank Linda Mackenzie and Jenny James at the Center for Applied Aquatic Ecology for their expertise and timely analysis of collected nutrient samples. Finally, I would like to thank the North Carolina Department of Environment and Natural Resources, Division of Land Resources – North Carolina
iv
Table of Contents
Page
List of Tables ... vii
List of Figures ... ix
List of Appendices ... xiii
1.Literature Review ... 1
1.1Nitrogen Export from Swine CAFO Lagoons ... 3
1.1.1 Mineralization, Nitrification, and Denitrification ... 3
1.2 Impacts of Lagoon Seepage and Waste Application on Ground and surface waters ... 7
1.3Impacts of Atmospheric Transport ... 10
1.4Tracking Nitrogen Contamination in Groundwater and Surface waters using Stable Nitrogen Isotopes ... 14
1.4.1 Using Stable Nitrogen Isotopes to Track Swine Waste ... 14
1.4.2 Isotope Fractionations Affecting Ground and Surface Waters ... 16
1.4.3 Isotope Fractionations: Rayleigh Equations, Fractionation Factor, and Enrichment Factor ... 19
1.4.4 Isotope Studies: Utilizing δ15N to Track Nitrogen in Ground and Surface Waters ... 20
1.5Stable Nitrogen Isotope Studies of Trees... 26
1.5.1 Tree Physiology Effects Nitrogen Cycling and 15N in Tree Tissues .. 27
1.5.2 Use of Foliar δ15N Tree Tissues as an Indicator of Subsurface Nitrogen Contamination: Recent Studies ... 31
1.6Hypothesized Isotopic Values in Trees Impacted by Swine Waste Lagoons/WAF’s ... 32
2. Site Introduction ... 34
2.1Research Site Description ... 34
2.2Historical Water Quality Data ... 35
2.2.1 Piedmont Geologic ESA Phase II Data ... 35
2.2.2 North Carolina State University Water Quality Data ... 38
2.2.3 Prior Tree Foliar δ15N and Percent Nitrogen Sampling ... 43
v
3. Materials and Methods ... 46
3.1Introduction ... 46
3.2Sample Collection Container Preparation ... 51
3.3Additional Well Installation at the JC Research Site ... 52
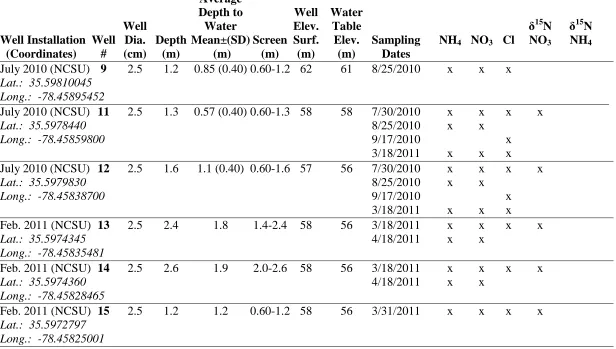
3.4Groundwater Collection ... 53
3.4.1 General Water Quality Parameters ... 53
3.4.2 Chloride Sampling ... 54
3.4.3 Nutrient Sampling ... 54
3.4.4 δ15N-NO3 Isotopic Analysis of Groundwater and Surface Water ... 55
3.4.5 δ15N-NH4 Isotopic Analysis of Groundwater and Surface Water ... 56
3.5Lagoon Sludge ... 57
3.6Foliar Sampling of Trees at Johnston County... 57
3.7Soil Sampling of Waste Application Field ... 58
3.8Quality Assurance/Quality Control... 60
3.8.1 Groundwater Sampling (QAQC) ... 61
3.8.2 QAQC for Groundwater and Lagoon Water pH, DO, and Specific Conductivity ... 62
3.8.3 Chloride Sampling (QAQC) ... 62
3.8.4 Nutrient Sampling (QAQC) ... 63
3.8.5 δ15N-NO3 Isotopic Analysis of Groundwater and Surface Water (QAQC) ... 63
3.8.6 δ15N-NH4 Isotopic Analysis of Groundwater and Surface Water (QAQC) ... 64
3.8.7 Foliar Sampling (QAQC) ... 64
3.8.8 Soil Sampling (QAQC) ... 67
3.9Statistical and Spatial Analysis ... 69
4. Results ... 72
4.0Groundwater Flow Direction ... 72
4.1In Situ Measurements of Groundwater and Lagoons ... 73
4.2Nutrient and Chloride Analysis of Groundwaters and Lagoons ... 77
4.3Stable Nitrogen Isotopic Analysis of Groundwater and Lagoons ... 87
4.4Isotopic and Nutrient Analysis of Soils in Waste Application Field ... 90
4.5Biomass and Species Inventory of Native Trees ... 94
4.6δ15N and Percent Nitrogen (%N) of Tree Leaves ...100
vi
5. Discussion ... 114
5.1Swine N Contamination in Groundwater ... 114
5.2Relationship of Swine N Contamination in Soil to δ15N Values in Pine Trees ... 118
5.3Relationship of Lagoon Seepage in Groundwater to δ15N Values in Trees... 124
5.4Use of Percent Nitrogen (%N) to Predict Subsurface Swine N Contamination ... 131
6. Conclusion ... 137
7. Future Work ... 139
vii List of Tables
Tables: Page #:
Table 1 Studies of nitrate and TAN concentrations at swine facilities in
North Carolina ... 6
Table 2 Chloride concentrations found at swine facilities and waste application field ... 9
Table 3 Ammonia emissions from anaerobic swine waste lagoons ... 12
Table 4 Ammonia dry deposition vs. distance from swine lagoons ... 13
Table 5 δ15N isotopic values of anthropogenic and natural sources ... 15
Table 6 δ18O isotopic values in nitrate from different sources or processes ... 21
Table 7 Values for δ15N-NO3, δ15N-N, δ18O-NO3, δ18O-water, and δ2 H-water in groundwater and lagoons at swine facilities ... 23
Table 8 Stable nitrogen isotopes found in various studies for soil ammonium and nitrate, bole-wood, and foliar tissues ... 30
Table 9 Soil sampling results, February 2007, Phase II ESA ... 37
Table 10 Surface water results, February 2007, Phase II ESA ... 37
Table 11 Groundwater results, February 2007, Phase II ESA ... 37
Table 12 Groundwater and surface water results, 2008, sampled by NCSU personnel ... 40
Table 13 Lagoons surface water results, 2008, sampled by NCSU personnel ... 43
Table 14 Groundwater sampling parameters, January 2009 – March 2011 ... 47
Table 15 Facilities and instruments used for stable isotope analysis ... 56
viii
Table 17 Comparison of N-NO3 in groundwater between Piedmont
Geologic wells and NCSU wells ... 78
Table 18 Comparison of ammonium in groundwater between Piedmont Geologic wells and NCSU wells ... 81
Table 19 Summary of trees randomly selected for 2010 foliar isotopic analysis stratified by biomass ... 97
Table 20 Foliar δ15N isotopic values of trees sampled more than once from 2007 – 2010 ... 105
Table 21 Foliar percent nitrogen for trees sampled between 2007 – 2010 ... 109
Table 22 Foliar δ15N and %N for trees sampled between 2007 – 2010 ... 110
Table 23 Appendix A – tree foliage data collected in June 2009 ... 153
Table 24 Appendix A – tree foliage data collected in July 2010 (small and large trees) ... 156
Table 25 Appendix A – tree foliage data collected in October 2010 (waste application field) ... 162
Table 26 Appendix A – tree foliage data collected in June 2011 (riparian Area and 2006 harvested area) ... 166
Table 27 Appendix B – Groundwater data, February 2010 – April 2011 ... 168
ix
List of Figures
Figures: Page #:
Figure 1 Nitrogen cycle for swine waste lagoons with ammonium
and nitrate concentrations found in prior research ... 4
Figure 2 Stable nitrogen isotopes values of surface and subsurface hydrology found in swine facilities ... 17
Figure 3 Cross-plot of δ15N-NO3 and δ18O-NO3 of groundwater ... 21
Figure 4 Cross-plot of δ15N-NO3 and NO3, denitrification ... 24
Figure 5 Cross-plot δ15N-NO3 and DO, denitrification ... 25
Figure 6 Cross-plot δ15N-NO3 and pH, denitrification ... 25
Figure 7 Hypothesized stable nitrogen isotopes in tree tissues impacted by swine waste lagoons and waste application ... 33
Figure 8 Johnston County research site with soil and 0.6m contours ... 34
Figure 9 Sampling locations for Phase II ESA, February 2007 ... 36
Figure 10 Mean nitrate and ammonia concentrations in surface and groundwater collected in 2008 by NCSU personnel ... 39
Figure 11 δ15N values for composite samples collected in 2007 ... 44
Figure 12 Percent nitrogen of individual trees collected in 2007 ... 44
Figure 13 Groundwater monitoring wells, research site ... 52
Figure 14 Groundwater flow direction for site ... 72
Figure 15 pH in lagoons, natural seep, and groundwater between April 2010 – 2011 ... 73
x
Figure 17 Total dissolved solids in groundwater and lagoons between
April 2010 – 2011 ... 76 Figure 18 Nitrate concentrations in groundwater and lagoons; 2007
Phase II ESA and NCSU February 2010 – March 2011 ... 78 Figure 19 Nitrate concentrations between February 2010 –March 2011 ... 80 Figure 20 Ammonium concentrations in groundwater and lagoons; 2007
Phase II ESA and NCSU February 2010 – March 2011 ... 82 Figure 21 Ammonium concentrations between February 2010 – March 2011 .... 83 Figure 22 Chloride concentrations in groundwater and lagoons, June 2010 –
March 2011 ... 85 Figure 23 Mean chloride concentrations in groundwater and lagoons, June
2010 – March 2011 ... 86 Figure 24 Cross plot of log-transformed conductivity and chloride ... 87 Figure 25 δ15N-NO3 signatures in groundwater ... 89 Figure 26 Soil sampling locations collected for nutrient and isotopic
analysis on waste application field (WAF), March 2011 ... 91 Figure 27 Soil δ15N (‰), soil N-NO3 (µg/g), and soil TKN (µg/g) for
random locations on the waste application field ... 92 Figure 28 Cross plot of log transformed soil data (soil N-NO3 (µg/g)
and soil TKN (µg/g)) at the waste application field ... 93 Figure 29 Summary of biomass inventory ... 95 Figure 30 Biomass, %N, andδ15N foliar signature distributions of large
and small samples collected in July 2010 ... 99 Figure 31 δ15N signatures (‰) for composite foliar samples, September 2007 ... 101 Figure 32 δ15N signatures (‰) for composite foliar samples, June 2009 ... 102 Figure 33 δ15N signatures (‰) for composite foliar samples of individual
xi
Figure 34 δ15N signatures (‰) for composite foliar samples of individual
small trees (< 1.9 m³), July 2010 ... 103
Figure 35 δ15N signatures (‰) for targeted foliar samples, June 2011 ... 103
Figure 36 δ15N (‰) change for trees sampled more than once between 2007-2010 ... 104
Figure 37 Percent nitrogen (% N) of individual trees, September 2007 ... 106
Figure 38 Percent nitrogen (%N) of individual trees, June 2009 ... 106
Figure 39 Percent nitrogen (%N) of individual large trees, July 2010 ... 107
Figure 40 Percent nitrogen (%N) of individual small trees, July 2010 ... 107
Figure 41 Percent nitrogen (%N) of individual small trees, June 2011 ... 108
Figure 42 Percent nitrogen of trees sampled more than once between 2007 – 2010 ... 109
Figure 43 2010 δ15N signatures (‰) and % N of composite needles from loblolly pines in the waste application field ... 112
Figure 44 Correlation of foliar δ15N and % N for loblolly pines on WAF ... 113
Figure 45 Simple linear regression of pine needle and soil δ15N values, October 2010 - March 2011 ... 113
Figure 46 IDW of nitrate concentrations in groundwater, June 2010 ... 114
Figure 47 Dissolved oxygen and N-NO3 concentrations in groundwater ... 115
Figure 48 IDW of chloride concentrations in groundwater, June 2010 ... 116
Figure 49 IDW of groundwater δ15N-NO3 values, June 2010 ... 117
Figure 50 Kriged surfaces of soil TKN and N-NO3 (mg/kg), WAF ... 119
Figure 50a Predictive Standard Error (PSE), Kriged surfaces of soil TKN and N-NO3 (mg/kg), WAF ... 120
xii
Figure 51a PSE, Kriged surfaces of soil and pine needle δ15N signatures,
WAF ... 122 Figure 52 Raster subtractions for soil δ15N values and loblolly pine needle
δ15
N values ... 124 Figure 53 Box-plots of δ15N isotopic values for native large trees
(biomass ≥ 1.9 m³) and small trees (biomass < 1.9 m³) for 2010 ... 125
Figure 54 Kriged surface of foliar δ15N values for small and large
trees in 2010 and 2011 ... 127 Figure 55 PSE, kriged surface of foliar δ15N values for small and large
trees in 2010 and 2011 ... 128 Figure 56 Composite kriged map of foliar δ15N isotopic values of all
trees; composite PSE map ... 130 Figure 57 Raster subtraction of NO3 concentrations (Figure 46)
from foliar δ15N values (Figure 56) ... 131 Figure 58 Box-plots of %N for large and small trees for 2010 ... 132 Figure 59 Correlations of foliar δ15N signatures and % N in native
large and small trees ... 133 Figure 60 Kriged surface of soil and pine needle %N at the WAF ... 134 Figure 61 Composite kriged surface of tree foliar %N; small and large
(July 2010), WAF pines (October 2010), small trees (June 2011) ... 135 Figure 61a PSE, kriged composite of tree foliar %N ... 136 Figure 62 Appendix D – groundwater flow analysis, WAF ... 179 Figure 63 Appendix D – groundwater flow analysis, large lagoon and
xiii
List of Appendices
Appendix: Page #:
Appendix A Foliage data ... 153
Appendix B Groundwater data ... 168
Appendix C Soil Data (WAF) ... 176
1
Chapter 1: Literature Review
1.0 Problem Statement
The extent of nitrogen release to groundwater and surface waters from Concentrated Animal Feed Operation (CAFO) lagoons as well as waste application fields (WAF) is still poorly understood. Currently, North Carolina is home to approximately 4,100 active or abandoned swine waste lagoons, excluding buried lagoons, with ~ 850 lagoons located in the Neuse River Basin alone (CGIA, 2003). These lagoons have the potential to contribute elevated concentrations of nitrate (NO3) and ammonium (NH4) to groundwater and surface waters. Elevated ammonia or nitrate levels can cause not only human health issues via drinking water contamination but also threaten livestock and wildlife (Cook et al., 2008).
Recent studies have evaluated nitrogen transport from CAFO lagoons within the Neuse River Basin. Research, conducted by Showers et al. (2008), Israel et al. (2005), Karr et al. (2002), and Karr et al. (2001), determined that nitrate and ammonium contamination in
shallow groundwater from swine lagoons and waste application fields were dominant sources of excess nutrients to surface waters within the Neuse River Basin. These studies used nutrient concentrations, chlorides, and stable isotopes of nitrogen, oxygen, and deuterium to determine endpoint nitrogen sources. Because swine waste has an enriched nitrogen isotope values between +10‰ to +20‰, swine waste export from CAFO operations can be
monitored in groundwaters and surface waters (Kendall and McDonnell, 1998; Karr et al., 2001).
2
sources of nitrate contamination in drinking water wells from buried waste lagoons (Showers et al., 2008), surface run-off from WAFs (Israel et al., 2005), and lagoon seepage due to
construction method, age, or failure (Huffman, 2004; Cook et al., 2008). Currently, groundwater monitoring wells are used to determine the amount and extent of nitrate contamination in groundwater. The overall costs to determine if swine CAFO’s are
impacting surrounding subsurface hydrology are substantial. These costs include monitoring well installation, sampling and required personnel, as well as lab analysis. The purpose of this study is to test an alternative approach to detect CAFO-derived nitrogen contamination in groundwater. This approach utilizes the stable nitrogen isotope (δ15N) analysis of tree leaves and stem cores. This concept assumes that trees adjacent to and down-gradient of swine waste lagoons and WAF’s access near surface and subsurface water potentially impacted by elevated nitrate and ammonium concentrations from leaching lagoons and WAF’s infiltration.
3
My research will determine if δ15N values in trees can be used to detect swine waste in the subsurface. I hypothesize that trees that utilize groundwater containing swine waste will have more positive δ15N values than trees that utilize groundwater that does not contain swine waste. The goal of this project is to determine if tree leaves can be used to provide
proxy-maps of swine waste contamination in groundwater. 1.1 Nitrogen Export from Swine CAFO Lagoons
Swine lagoons can release nitrogen by diffuse subsurface seepage, volatilization, inadvertent spillage/overtopping, and land application on waste application fields (WAF) (Hunt et al., 1995; Gilliam, 1996; Sloan et al., 1999a). Mineralization, denitrification, nitrification, ammonia volatilization, as well as sorption/desorption at soil interfaces
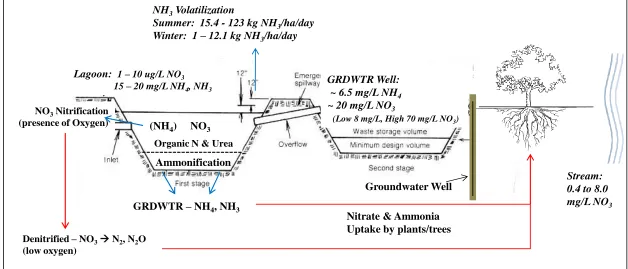
represent biological, physical, and chemical processes that alter nitrogen released from swine lagoons (Kendall and McDonnell, 1998). These pathways can cause potential increases or decreases in ammonia and nitrate concentrations in groundwater and surface waters. Figure 1 shows nitrogen pathways from lagoon to surface waters as summarized from the literature cited in Tables 1 and 2 and discussed in further detail in the next section.
1.1.1 Mineralization, Nitrification, and Denitrification
Mineralization, or ammonification, is defined as the production of ammonium (NH4) from soil organic matter through microbial actions: organic N NH4. Temperature, water content, and soil architecture (pore size distribution and soil aeration) are the dominate factors that control N mineralization in soils (Dessureault-Rompre et al., 2010). In
4
Figure 1. Nitrogen cycle for swine waste lagoons with ammonium and nitrate concentrations found in prior research. Cook et al. 2008; Karr et al. 2002; Karr et al. 2001; Aneja et al. 2000; Harper and Sharp, 1998
Stream: 0.4 to 8.0 mg/L NO3 NH3Volatilization
Summer: 15.4 - 123 kg NH3/ha/day Winter: 1 – 12.1 kg NH3/ha/day
NO3Nitrification (presence of Oxygen)
Organic N & Urea Lagoon: 1 – 10 ug/L NO3
15 – 20 mg/L NH4, NH3
Ammonification (NH4) NO3
GRDWTR – NH4, NH3GRDWTR – NH4, NH3
Denitrified – NO3N2, N2O (low oxygen)
Groundwater Well GRDWTR Well:
~ 6.5 mg/L NH4 ~ 20 mg/L NO3
(Low 8 mg/L, High 70 mg/L NO3)
GRDWTR – NH4, NH3
GRDWTR – NH4, NH3
5 soils reached field-water holding capacity.
Nitrification refers to the oxidation of ammonium into several oxides of nitrogen including NO2, NO, N2O, as well as NO3 through various chemical reactions. Nitrification of ammonium into nitrate is a two-step oxidation reaction in which hydroxylamine, or NH2OH, mediates the reaction between ammonia and water resulting in nitrite followed by a reaction with water into nitrate (Kendall and McDonnell, 1998; Jetten, 2008).
Oxidation by Nitrosomanas: NH4+ + H20 NH2OH +2[H] + H+ NH2OH + O2 NO2- + [H] + H+ Final Oxidation by Nitrobacter: NO2- + H20 NO3- + 2[H] (Kendall and McDonnell, 1998)
If nitrification occurs, acidity in groundwater will increase and pH will decrease due to the production of hydrogen ions or hydronium ions (H3O+)(Stumm and Morgan, 1988; Paul and Clark, 1989; Kendall and McDonnell, 1998).
Heterotrophic denitrification refers to the reduction of nitrate into N2O, NO, and gaseous N2 through the actions of heterotrophic bacteria (utilizes organic matter)(Kendall and McDonnell, 1998; Hill, 2000; Jetten, 2008).
Nitrate reduction by Pseudomonas denitrificans:
4NO3- + 5C + 2H2O 2N2 + 4HCO3- + CO2 (Kendall and McDonnell, 1998)
6
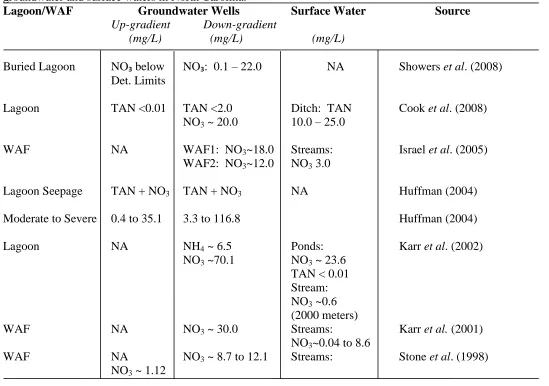
Table 1. Select studies of nitrate and TAN (total ammoniacal nitrogen) concentrations found at swine facilities in groundwater and surface waters in North Carolina.
Lagoon/WAF Groundwater Wells Surface Water Source
Up-gradient Down-gradient
(mg/L) (mg/L) (mg/L)
Buried Lagoon NO₃ below NO₃: 0.1 – 22.0 NA Showers et al. (2008) Det. Limits
Lagoon TAN <0.01 TAN <2.0 Ditch: TAN Cook et al. (2008) NO3 ~ 20.0 10.0 – 25.0
WAF NA WAF1: NO3~18.0 Streams: Israel et al. (2005)
WAF2: NO3~12.0 NO3 3.0
Lagoon Seepage TAN + NO3 TAN + NO3 NA Huffman (2004)
Moderate to Severe 0.4 to 35.1 3.3 to 116.8 Huffman (2004)
Lagoon NA NH4 ~ 6.5 Ponds: Karr et al. (2002)
NO3 ~70.1 NO3 ~ 23.6 TAN < 0.01 Stream: NO3 ~0.6 (2000 meters)
WAF NA NO3 ~ 30.0 Streams: Karr et al. (2001)
NO3~0.04 to 8.6
WAF NA NO3 ~ 8.7 to 12.1 Streams: Stone et al. (1998)
7
1.2 Impacts of Lagoon Seepage and Waste Application on Ground and Surface Waters Several studies have examined waste lagoon seepage and waste application fields (WAF) as a potential source of nitrate contamination in groundwater around CAFOs. Groundwater down-gradient from subsurface lagoon discharge and WAF’s are expected to have elevated Total Kdjedhal Nitrogen (TKN) and nitrate concentrations (Huffman, 2004). This is due to water’s tendency to flow from a higher potential to a lower potential in subsurface hydrology (Freeze and Cherry, 1979). Table 1 summarizes recent studies in North Carolina that observed elevated levels ammonia and nitrate concentrations in groundwater derived from swine sources.
Showers et al., (2008), Cook et al., (2008), Israel et al., (2005), Karr et al., (2002), Karr et al., (2001), and Stone et al. (1998) observed elevated nitrate concentrations in
groundwater at or above the 10 mg/L EPA maximum contaminant level (MCL) around swine operations. Showers et al., (2008), Cook et al., (2008), and Huffman (2004) observed that nitrate and total ammoniacal nitrogen, or TAN (NH3-N + NH4-N), concentrations in groundwater up-gradient of the lagoons/WAF’s were at or below detectible limits (0.01 mg/L). Huffman (2004) observed similar trends in 34 older lagoons in North Carolina (pre-1993). Of the 34 lagoons studied, 28 of the 34 lagoons had moderate to very strong seepage from lagoons to groundwater. Thirty one of the 34 sites had higher concentrations of nitrogen down-gradient of the lagoons (Huffman, 2004).
Nitrification appears to dominate N transformation in the near surface groundwater of WAF’s and swine lagoons. The resulting nitrate that has leached into the subsurface
8
by Israel et al. (2005) and Sloan et al. (1999) observed an increase in nitrate concentrations in groundwater below a WAF due to nitrification; nitrate concentrations decreased as
groundwater infiltrated a riparian zone and denitrification occurred. Sloan (1999) observed a decrease in nitrate concentrations from ~ 60 mg/L NO3 before the riparian zone to < 10 mg/L NO3 after groundwater infiltrated the riparian zone.
Lagoon effluents, through direct seepage or spray application, have the potential to impact surface waters with elevated nitrate and ammonium concentrations. Seepage from the lagoons enters the groundwater and migrates to sources of discharge, such as onsite ditches, streams, or larger waterways. Depending on specific processes dominating the subsurface hydrology, such as nitrification (NH4 into NO3) or denitrification (NO3 into NO, N2O, or gaseous N2), concentrations of nitrate or ammonium may be higher in surface waters. Cook et al. (2008) observed that a channelized stream, down-gradient of a swine waste lagoon, had
elevated nitrate concentrations ranging between 10 to 25 mg/L due to the nitrification of TAN. Stone et al. (1998) found elevated nitrate concentrations (1.12 mg/L compared to non-impacted sites close-by) in an adjacent stream next to a WAF, indicating potential
groundwater or runoff discharge. The authors reported that during cooler months, nitrate concentrations increased, indicating reduced denitrification through the riparian zone due to cooler temperatures (Stone et al., 1998). Karr et al. 2002 observed elevated nitrate
concentrations in surface pond waters indicating either deposition or surface runoff of ammonium and organic N (nitrified into NO3) from the spray application of swine waste effluents (Karr et al., 2002).
9
important tools to indicate if denitrification or nitrification processes dominate in the
subsurface. Karr et al. (2002) cross plotted ammonium vs. nitrate concentrations and found a positive correlation (r2 = 0.77) that these N species originated from the same source. The authors cross plotted dissolved oxygen vs. nitrate or ammonium concentrations to show a negative correlation of DO vs. nitrate (r2 = -0.56) and DO vs. ammonium (r2 = -0.64) which showed that nitrification dominated the subsurface.
An additional tool to source track hog waste to surface water and groundwater is chloride ion concentrations. Swine waste is concentrated in chlorides due to feed additions of NaCl and KCl in order to prevent potassium and sodium deficiencies (Hatfield et al., 1998). This chloride is concentrated during digestion and excreted and disposed of into swine waste lagoons. Lagoons and groundwater wells contaminated with lagoon effluent will have elevated chloride concentrations ranging from 54 to 153 mg/L for lagoons and 15 to 124 mg/L for groundwater wells (Table 2). Israel et al. (2005) found that chloride concentrations were greatest near the sources (anaerobic swine waste lagoons, WAF) and decreased with distance away from the source. Karr et al. (2001) used cross plots of chloride vs. nitrate or ammonia to show a positive correlation (Cl vs. nitrate: r2 = 0.46; Cl vs.
ammonium: r2 = 0.71) between nutrient concentrations and chloride ions.
Table 2. Chloride concentrations found at existing/abandoned swine facilities and WAF
Well/Lagoon/WAF Chloride Concentrations Source
(mg/L)
Well (Closest to Buried Lagoon) 25.5 to 124.0 Showers et al., (2008)
Well (WAF) 15.3 to 4.59 Showers et al., (2008)
Well (WAF) 20 to 90 Israel et al., (2005)
Stream 18 to 24 Israel et al., (2005)
Lagoon 54 – 153 Karr et al., (2001)
10 1.3 Impacts of Atmospheric Transport
Animal wastes contain several N-bearing constituents, but most of the N found in waste application effluents is in the form of urea. This source of urea is hydrolyzed to ammonia and then later nitrified into nitrates. This process can cause hydrolyzed ammonia to diffuse from aqueous ammonia into gaseous ammonia. Ammonia release at CAFOs occurs when ammonia volatilizes from surface soils and open top lagoons; several factors enhance ammonia release such as warmer temperatures, elevated pH, greater wind-speed, and air-moisture (Kendall and McDonnell, 1998).
Atmospheric transport of NH3, N2O, and N2 from swine waste lagoons is dependent on ammonium concentrations within the lagoon (Harper et al., 2004). During warmer weather and higher temperatures, biological activity greatly increases in lagoon sludge, producing ammonia that diffuses upwards and replaces volatilized ammonia from the surface (Aneja et al., 2008). Ammonium concentrations and ammonia flux from the waste lagoons are highly dependent on temperature and have been shown to vary diurnally as well as seasonally. Studies by Aneja et al. (2008), Harper et al., (2006), Aneja et al. (2001), and Harper and Sharpe, (1998), indicate major differences in ammonia flux seasonally with increased concentrations observed during the summer while lower concentrations were observed during the winter. Days with greater wind speeds will also enhance ammonia loss. Table 3 provides seasonal ammonia flux, TAN, and TKN concentrations from anaerobic swine waste lagoons.
11
2001; Bajwa et al., 2008). Deposition of volatilized ammonia close to hog lagoon sources is more likely due to its high dry deposition rates, low source elevation, and relative short lifespan (1 – 5 days) in the atmosphere (Aneja et al., 2001). Ammonia’s short lifespan is attributed to its reactive tendencies with other atmospheric compounds to form other
molecules. These factors help to inhibit ammonia transport away from the source causing a deposition rate of about 20% – 40% of ammonia close to the source. Ammonium aerosols tend to have a much longer atmospheric lifespan (1-15 days) causing deposition over larger areas away from the source (Aneja et al., 2001).
Recent studies evaluated ammonia deposition on different plant surfaces
including crop and forest canopies (Table 3). Walker et al. (2008) and Bajwa et al. (2008) found that the amount of ammonia deposition differed depending on wind speed, wind direction, temperature, distance, as well as plant surfaces themselves. The authors found that the greatest concentrations of ammonia deposition occurred closest to the lagoons,
12
Table 3. Lagoon ammonia emissions (flux) as well as lagoon TAN and TKN concentrations.
Lagoon Lagoon Period NH3 Flux TAN (NH4 + NH3) TKN
(μg-N/m2/min) (mg/L) (mg/L) Sept. 9-20, 2002 2349 ± 986.4 442 ± 18.1 561 ± 33.3 Aneja et al., 2008
Jan. 6-17, 2003 153 ± 52.4 560 ± 19.4 700 ± 18.3
Aneja et al., 2008
Sept. 30 to Oct. 11, 2002 1685 ± 516.4 364 ± 35.9 583 ± 136
Aneja et al., 2008
Jan. 27 to Feb. 2, 2003 371 ±147 636 ± 36.9 782 ± 38.9 Aneja et al., 2008
(kg NH3-N/ha/day)
Jan 2001 – Mar 2001 1 to 3 NA NA
Harper et al., 2006
Apr 2001 – July 2001 20 to 65 NA NA
Harper et al., 2006
Aug. 1-15, 1997 34 to 123 NA 587 to 695
Aneja et al., 2000
Feb. 1 – 26, 1998 1.3 to 10 NA 580 to 727
Aneja et al., 2000
Aug. 6-9, 1997 15.4 to 22 574 NA
Harper and Sharpe, 1998
Jan. 23 – 29, 1997 4.7 to 12.1 538 NA
13
Table 4. Modeled ammonia dry deposition vs. distance downwind of a swine waste lagoon in North Carolina using ammonia flux and meteorological (temperature, relative humidity, wind speed, and wind direction) measurements.
Season/Period Distance from Lagoon NH3 Deposition Source
(m) (kg NH3/ha/yr)
Winter: 2003 – 2005 ≤ 500 48 to 60 Walker et al., (2008)
(Forest)
Spring: 2003 – 2005 ≤ 500 72 to 84 Walker et al., (2008)
(Forest)
Summer: 2003 – 2005 ≤ 500 36 to 48 Walker et al., (2008)
(Forest)
Fall: 2003 – 2005 ≤ 500 36 Walker et al., (2008)
(Forest)
Cumulative Deposition ≤ 75 50 Walker et al., (2008)
Season/Year Distance from Lagoon (gram/hr)
(m)
Winter 2002 (Crop) ≤ 500 38 Bajwa et al., (2008)
Winter 2002 (Crop) 500 to 2500 20 Bajwa et al., (2008)
Summer 2003 (Crop) ≤ 500 327 Bajwa et al., (2008)
Summer 2003(Crop) 500 to 2500 173 Bajwa et al., (2008)
14
1.4 Tracking Nitrogen Contamination in Groundwater and Surface waters using Stable Isotopes
1.4.1 Using Stable Nitrogen Isotopes to Track Swine Waste
A stable isotope is defined as an atom that has the same number of protons but different numbers of neutrons in an atoms nucleus. As an example, nitrogen has two stable isotopes: the heavier isotope 15N and the lighter isotope 14N. The ratio of the isotopes
(15N:14N) provide valuable information about nitrogen sources as well as what processes may be altering nitrogen from those sources. The atmosphere is ~ 99.6337% 14N and ~ 0.3663% 15
N; biological, chemical, and physical processes generally utilize the lighter isotope of 14N over 15N and cause an enrichment of 15N in residual substrates. In order to quantify this isotope ratio, we express the analyzed sample relative to an internationally known standard, which for N is N2 or the atmosphere (0‰) (Kendall and Mcdonnell, 1998; Bedard-Haughn et al., 2003; Hoefs, 2004; Dawson et al., 2007). Proper notation for the isotopic ratio is “delta”
(δ), expressed as permil (‰), with the formula: δ15
N (‰) = [(15N/14Nsample) / (15N/14Nstandard)-1] * 1000
Table 5 below provides examples of δ15N values for both anthropogenic and natural background isotopic values.
Stable nitrogen isotopes are used in ecology to determine food web positions of various organisms from primary producers to consumers. Nitrogen isotopes are useful in determining the contribution of plants and animals to a food web and whether an
15
Table 5. Stable nitrogen isotope ratios (δ15N) of anthropogenic and natural sources (Xue et al. (2009) and references therein).
Source δ15N (‰)
Ammonium Fertilizer -5 to +5
Nitrate Fertilizer -4 to +6
Urea -5 to +2
Soil N 0 to +8
Swine Waste +10 to +20
Sewage +4 to +19
Ammonium Precipitation -13 to +13
Nitrate in Precipitation -8 to +8
Uncontaminated Groundwater -2 to +6
Uncontaminated Surface Water -5 to +8
trophic step. This is caused by the fact that 14N is preferentially removed during urea
production from the nitrogenous waste production in the digestive tract of animals. Because swine are omnivores, they occupy a trophic position between herbivores and carnivores with an average δ15N value between 5‰ and 8‰ as measured by bone collagen (Kelly, 2000). Thus, relative to natural background nitrogen (soil N = 0‰ to +8‰), swine manure δ15N values are enriched to approximately +17‰ ± 11‰ (n = 9) (Cravotta, 2002) through
fractionation during digestion. This enriched δ15N value in swine waste allows for a natural isotopic tracer in groundwater and surface waters.
16
fertilizers with low δ15N ratios may undergo denitrification and increase its 15N/14N ratio to
δ15N ratios observed for swine waste. The use of other isotopes, such as δ18O and δD, can assist in source identification as well as identify subsurface processes that may be causing
δ15N isotopic shifts. Figure 2 below shows expected δ15N values at swine facilities in North Carolina that may be impacted by different chemical, biological, or physical processes (denitrification, nitrification, or ammonia volatilization).
1.4.2 Isotope Fractionations Affecting Ground and Surface Waters
Isotopic fractionation of subsurface and surface waters are characterized by mass-dependent isotopic effects (N – 14N, 15N); the small differences in mass between isotopes of the same element may induce isotopic shifts during physical, chemical, and biological processes, causing a relative proportion of different isotopes in different substrates (Peterson and Fry, 1987; Kendall and McDonnell, 1998). This isotopic effect can identify a particular nitrogen source or processes that formed particular nitrogen species. There are two main forms of isotopic fractionations: equilibrium and kinetic (Kendall and McDonnell, 1998; Hoefs, 2004; Xue et al., 2009).
Equilibrium fractionations occur in mainly closed systems at equilibrium where reactions are reversible, allowing for the redistribution of isotopic values among substrates. In an equilibrium fractionation, the heavier isotope usually accumulates in the element with the higher oxidation state. This implies that as a reaction occurs and the state of the element changes (i.e. liquid to vapor), the more dense, remaining material will become more positive with the heavier isotope while the newly formed product will be more negative with the lighter isotope (Kendall and McDonnell, 1998;Hoefs, 2004; Xue et al., 2009).
17
Figure 2. Stable nitrogen isotope values of surface and subsurface hydrology found at swine facilities in North Carolina. Showers et al. 2008; Israel et al. 2005; Karr et al. 2002; Karr et al. 2001.
NH3Volatilization
(uses 14N & enriches 15N)
Organic N & Urea Lagoon: Total δ15N
+10.0 (Jan.) to +18.0 (June)
Ammonification (NH4) NO3
Nitrate & Ammonia Uptake by plants/trees
Stream: δ15N-NO 3 +15.2‰ Waste Application Field
δ15N-NO
3 +14.7 to +30‰
Groundwater (Nitrification) δ15N-NO
3 +7.6 to +15.4‰
Groundwater (Denitrification) δ15N-NO
3 ≥ +20 to +70 ‰
18
Kinetically driven isotopic fractionations are usually unidirectional, dependent on mass ratios of the isotopes, their atomic vibrational energies, and occur in systems not at equilibrium (chemically and isotopically) (Kendall and McDonnell, 1998; Hoefs, 2004). Kinetic fractionation has several limiting factors including reaction pathway, reaction rate, as well as the bond strength of the reactant. These limiting factors ensure that as fractionation occurs, the bonds that are easily broken (lighter isotopes) will react first, causing the heavier isotope to become more positive in the substrate, while the newly formed product will be isotopically more enriched with the lighter isotope or more negative than the parent material (Kendall and McDonnell, 1998; Hoefs, 2004; Xue et al., 2009).
Isotopic fractionation can occur during oxidation/reduction reactions (nitrification/denitrification), ammonia volatilization, mineralization, assimilation,
19
1.4.3 Isotope Fractionations: Rayleigh Equations, Fractionation Factor, and Enrichment Factor
The Rayleigh Equation is used to determine the partitioning between two isotopic reservoirs of a material when one reservoir is decreasing in size (Kendall and McDonnell, 1998; Hoefs, 2004). The equation can be used only if (1) a material is continuously removed and contains two elemental species (18O and 16O), (2) the fractionation occurring in the material is known and expressed as the fractionation factor, and (3) the fractionation factor does not change. This can be useful in estimating isotopic shifts during processes
(denitrification or nitrification) that can alter isotopic composition in groundwater and surface waters.
As mentioned previously, isotopes are subject to kinetic isotopic fractionation causing the products to have more negative isotopic values (lighter isotope) while the remaining substrate becomes more positive with the heavier isotope. An enrichment factor (‰) characterizes the fractionation process which causes the substrate to become more positive with the heavier isotope (Xue et al., 2009). The enrichment factor is determined by the following formula:
ε =10³ (α – 1)
where α is the fractionation factor. The fractionation factor (α) is defined as the rate constant of the heavier isotope divided by the rate constant of the lighter isotope. In a closed system, isotopic enrichment can be expressed by the Rayleigh Equation:
δS(t) = δS0 + εln(St/S0)
20
S0 and St are the concentrations of the substrate at time 0 and t, respectfully (Xue et al., 2009).
1.4.4 Isotope Studies: Utilizing δ15N to track nitrogen in ground and surface waters Stable nitrogen isotopes alone cannot always differentiate between nitrogen sources; the use of other stable isotopes, including δ18O-NO3, can help identify N sources to waters. These isotopic tracers can be used to determine the source of nitrogen contamination as well as track potential nitrogen plumes that may be derived from animal feed operations. The use of dual isotopes, such as the δ15
N-NO3 and δ18O-NO3 can distinguish between subsurface denitrification and nitrification processes.
Israel et al. (2005) found that δ18
O-NO3 and δ15N-NO3 values were proportional indicating similar trends during fractionation. Subsurface denitrification in the riparian zone caused both the isotopic values of nitrate-N and nitrate-O to become more positive. These results show that as the δ15
N-NO3 approached ~ +50‰ in the riparian buffer, the δ18O-NO3 approached ~ +20‰, which follows a 1:2 vector plot indicating denitrification in the
subsurface hydrology (Israel et al., 2005). This1:2 denitrification vector occurs because the isotopic enrichment factor value for nitrogen is twice that of oxygen in nitrate (Aravena and Robertson, 1998; Kendall and McDonnell, 1998; Seiler, 2005). Hence, δ18O-NO3 values that are not elevated indicate that denitrification is not occurring. Table 6 provides δ18O values for nitrate from different sources including atmospheric, fertilizers, and organic manure.
Dual plots of δ18
O-NO3 vs. δ15N-NO3 can be used to identify when nitrification is occurring (Figure 3). Showers et al. (2008) used a dual isotopic approach to (δ15N-NO3 and
21
groundwater. Nitrate concentrations in wells down-gradient from a buried animal waste lagoon were 20-22 mg/L, with δ15N-NO3 values ranging from +11‰ to +15‰. If
denitrification is occurring, the dual plot of δ15N-NO3 vs. δ18O-NO3 in wells down-gradient of the lagoon should fall along a 1:2 vector plot resulting from more positive δ15N-NO3. If Table 6. δ18O values in nitrate from different sources and or biological or chemical
processes.
Source δ18O (‰) Source
Background Soil Nitrate and -5 to +15 Kendall and McDonnell (1998)
Organic Manures -5 to +15 Kendall and McDonnell (1998)
Nitrification (process) 0 to +18 Xue et al. (2009)
Nitrate Fertilizer +18 to +25 Xue et al. (2009)
Ammonia Fertilizer 0 to +15 Showers et al. (2008) Nitrate Precipitation +23 to +78 Xue et al. (2009)
22
this is not the case, other processes may dominate such as nitrification. In Figure 3, this 1:2 vector plot is not apparent indicating that nitrification dominates subsurface hydrology (Showers et al., 2008).
Ammonia volatilization is important to N isotopic enrichment of nitrogen found beneath waste application fields (WAF). The δ15N of N in the remaining materials (soils and groundwater) may be between +7‰ to +30 ‰ (Kendall and McDonnell, 1998; Sloan et al., 1999b; Israel et al., 2005; Xue et al., 2009). Karr et al. (2002) observed an increase from ~15.0 ‰ (total N) in lagoon biosolids to ~ 28.0 ‰ (total N) in lagoon biosolids during spray
application due to ammonia volatilization (Table 7).
Volatilization and ammonia loss are at their greatest during the summer months with an ammonia loss of approximately 50% relative to the lagoon with δ15
N-NH4 values ≥18‰ compared to 10‰ for lagoon sludge during the winter (Table 7) (Karr et al., 2001). Wetted soil cores were collected in order to determine how cooler temperatures affected ammonia volatilization during spray application. Spray application in cooler temperatures had δ15N isotopic values that remained consistentwith lagoon samples (+10‰) indicating very little ammonia volatilization.
23
Table 7. Values for δ15N-NO3, δ15N-N, δ18O-NO3, δ18O-water, and δ2H-water in groundwater and lagoons at swine facilities.
Well/Lagoon δ15N-NO3 (‰) δ18O-NO3 (‰) δ18O-water (‰) δ2H-water (‰) Source
Wells (near lagoon) 11.4 to 15.4 6.3 to 8.8 -2.6 to -13.4 -10.9 to -23.9 Showers et al. (2008) Wells (Central) 7.6 to 11.4 2.2 to 11.3 -3.5 to -6.9 -18.6 to -31.8 Showers et al. (2008)
Wells (WAF) 18 to 30 5 to 28 NA NA Israel et al. (2005)
Wells (Streamside) ≥ 20 10 to 30 NA NA Israel et al. (2005)
Wells (WAF) +14.7 NA NA NA Karr et al. (2002)
Wells (WAF) +16.7 NA NA NA Karr et al. (2001)
Streams +15.2 NA NA NA Karr et al. (2001)
Total N δ15N-Total N (‰) δ15N-NH4 (‰)
Lagoon +15.7 NA Karr et al. (2002)
Spray (WAF) +28.0 NA Karr et al. (2002)
Lagoon Sludge (June) NA +≥18.0 Karr et al. (2001)
24
oxidation reaction, or the utilization of oxygen, that occurs during nitrification (Kendall and McDonnell, 1998). A similar trend is seen between a cross plot of dissolved oxygen and ammonium; a strong negative correlation occurs because oxygen has been depleted by biochemical oxygen demand associated with the nitrification of ammonium into nitrate (Karr et al., 2002).
One can determine which processes dominate subsurface groundwater by comparing δ15
N-NO3 values to pH and concentrations of nitrate and dissolved oxygen. Karr et al. (2001) used cross plots of δ15
N-NO3 and nitrate to show that denitrification occurs when nitrate concentrations were low and δ15N-NO3 were more positively enriched (Figure 4).
Figure 4. Elevated δ15N-NO3 and low NO3 concentrations indicate denitrification Karr et al. (2001).
Low dissolved oxygen in conjunction with more positive δ15
N-NO3 ratios is an indicator for denitrification (Figure 5). The authors also found that higher pH values accompanied more positive δ15
25
Figure 5. Elevated δ15N-NO3 and low DO concentrations indicate denitrification Karr et al. (2001).
26 McDonnell, 1998).
Karr et al., (2001) observed that shallow monitoring wells have more positive δ15 N-NO3 values and lower nitrate concentrations than deep wells. The authors concluded that denitrification is more prevalent in the shallow monitoring wells due to the presence of higher concentrations of organic matter. Additionally, temperature plays an important role in groundwater processes; more positive δ15
N-NO3 values were observed during warmer seasonal temperatures indicating enhanced dentrification (Karr et al., 2001).
1.5 Stable Nitrogen Isotope Studies of Trees
The stable nitrogen isotopic values of tree tissues reflect internal nitrogen
translocation and intermixing between δ15N sources. δ15N sources include atmospheric deposition (ammonia) as well as nitrate and ammonium assimilation from soil, groundwater, and surface waters. Robinson et al. (1998) discussed several factors that can affect δ15N values in tree tissues. These factors include: the uptake of different N sources with varying δ15
N values; internal fractionations during assimilation and translocation; N efflux by the roots; and the uptake of N from soil microbes such as mycorrhizal fungi.
The δ15N values in tree leaves have been used to trace sources of nitrogen deposition from the atmosphere due to industrial discharge. Xiao et al., 2010, used leaves of the Cinnamomum Camphora tree to trace the deposition of anthropogenic nitrogen from
industrial sources such as fertilizers like ammonia and urea. The authors observedthatfoliar δ15
27
sediment, and years of ammonia loss without replacement of swine N for ongoing CAFO operations.
1.5.1 Tree Physiology Effects Nitrogen Cycling and 15N in Tree Tissues
The uptake and assimilation of nitrogen into tree tissues involves the uptake of nitrogen from the soil solution, nitrogen translocation to the site of assimilation, and finally inorganic nitrogen assimilation into organic nitrogen of tree tissues (Bloom, 1988; Kozlowski et al., 1997; Evans, 2001). Evans (2001) showed that ammonium and nitrate are assimilated
in trees by two different mechanisms that are dependent on NH4 and NO3 concentrations. Ammonium is assimilated in a single process (GS-GOGAT) at one location (roots) while nitrate can be assimilated (NRA) via multiple pathways (roots, shoots, or leaves) within a tree (Evans, 2001; Dawson et al., 2002).
Nitrate acquisition into tree tissues occurs through the root system or through leaves and uses the nitrate reductase-NR pathway. The conversion from nitrate to ammonium in tree tissues is mediated by two enzymes, nitrate reductase activity (NRA) which converts the nitrate to nitrite, and nitrite reductase, which converts the nitrite to ammonium (Gebauer and Schulze, 1997). NRA is localized in the cytoplasm of tree cells while the nitrite reductase activity is localized in the chloroplasts of green tissues or the proplastids of roots (Kozlowski et al., 1997; Evans, 2001). Evans (2001) states that the ammonium produced from NRA
28
lighter isotope 14N over the heavier isotope 15N, causing a residual accumulation of 15N in the inorganic nitrogen pool of the tree (Robinson et al., 1998; Evans, 2001).
The phloem is responsible for the transport of nutrients needed throughout the tree for growth/survival while the xylem is responsible for the transport of water from the roots to all parts of the tree (Raghavendra, 1991; Kozlowski et al., 1997). The analyses of xylem and phloem have found that the δ15N values in phloem (1.6‰ ± 1.9‰) are less positive than xylem (4.2‰ ± 2.0‰). Xylem δ15N are also more positive than 15N in the roots (0.8‰ ±
0.9‰) (Yoneyama et al., 1997). The δ15
N isotopic value varies within different tissues of trees due to organ specific loss of nitrogen, reallocation of nitrogen during translocation and assimilation, or different patterns of assimilation within different tree tissues (Evans, 2001; Dawson et al. 2002; Kolb and Evans, 2002).
When soil inorganic/organic N is abundant, plants do not utilize mycorrhizae fungi for N uptake (Allen et al., 2003) and isotopic values reflect the abundant N source (Evans, 2001). When nitrogen is limiting, plants will use mycorrhizae fungi to take up N. This causes a residual increase in δ15N of the fungi and a decrease in δ15
N in the plants (Hogberg, 1997; Hobbie, 2000; Evans, 2001). When mycorrhizae fungi supply N to the plants, percent foliar nitrogen is low and leaf δ15
N ratios are lower (Hobbie et al., 2000).
When the main source of N is nitrate, variations of 15N within tree tissues are observed due to various pathways (leaves and roots) of nitrate entry into the tree (Evans, 2001; Dawson et al., 2002). Kolb and Evans (2002) found that the δ15N composition of tree leaves was more positive than roots due to the utilization of prior assimilated N by tree leaves. Tree leaves use nitrogen already processed by the tree and thus have δ15
29
positive relative to nitrogen assimilation by root tissue. When trees were provided a specific nitrate source solution, both Yoneyama et al. (1989) and Evans et al. (1996) found that leaves more closely reflect the isotopic value of assimilated nitrate than roots. Yoneyama et al. (1989) observed that leaf δ15
N was 10.6‰ and root δ15N was 4.9‰ when a nitrate source of 10.3‰ was provided to trees. Evans et al. (1996) observed similar trends; leaf δ15
N was 3.3‰ and root δ15
N was -0.1‰ when a nitrate source of 1.8‰ was provided to plants (Lycopersicon esculentum).
Table 8 compares isotopic values for N sources and tree leaves as well as δ15N values of nitrate and ammonia in tree leaves and soil. Several important trends are apparent in Table 8. The Hobbie et al. (2000) study showed typical δ15N values from -6.91‰ to 0.35‰ for trees in natural environments without specific anthropogenic N sources. The other studies demonstrated that δ15N of leaves more closely reflected the δ15N nitrogen source to the tree. When the δ15N of the nitrogen source changed, the δ15N of tree leaves reflected that relative positive or negative change over time.
30
Table 8. Stable nitrogen isotopes found in various studies involving soil ammonium and nitrate, bole wood, and foliar tree tissues.
Tree Species 15N - Enriched 15N-NO3 15N- 15N-Foliar 15N-Foliar Source
Tracer (‰) Soil (‰) Soil (‰) (1999)(‰) 1-yr old (‰)
Tracer (‰) – Urea
Loblolly Pine (July) -2.7 (urea) -8.6 ± 1.5 -4.9 ± 1.4 -1.3 ± 0.9 -1.2 ± 0.4 Choi et al. (2005) Loblolly Pine (Sept.) -2.7 (urea) -8.2 ± 0.8 -2.8 ± 1.0 -0.6 ± 0.4 -1.5 ± 0.6
Tracer (‰) – Soil N
Populus (genus) none -0.36 to 2.42 NA -6.91 to 0.35 NA Hobbie et al. (2000)
Bole wood Foliar–NH4 Foliar–NO3
δ15N (‰) δ15N (‰)
δ15N(‰)
Hardwoods (Oak)
Before tracer addition (1996) -1.5 -2.6 ---- Nadelhoffer et al. (2004) After 15NH4Cl addition +965 (2003) 17.2 16.4 ----
After K15NO3 addition +761 (2003) 17.9 ---- 15.6 Pine
Before tracer addition (1996) -1.3 -1.8 ---
After 15NH4Cl addition +965 (2003) 12.7 13.9 ---
After K15NO3 addition +761 (2003) 17.0 --- 17.7
Foliar δ15N (‰) Foliar δ15N(‰)
Wastewater Irrigation pre - irrigation (1987) post – irrigation (2years of irrigation) (1989)
Wastewater δ15
N +13 to +25 ‰
All trees (Control) -5 to -2 -4.0 to -1.0 Jordan et al. (1997)
Quercus alba -2.0 to 1.0 4 to 6.0
Quercus velutina -4.0 to -3.0 3.0 to 6.0
31
values of living leaves and abscised leaves were observed for Quercus rubra or Quercus alba. Thus, analysis of leaves for δ15
N values should avoid early spring budding for deciduous trees and composite sampling of new and established leaves/needles should be used during stable growth periods such as mid-summer. The reduction of total N (% N) inabscised leaves can interfere with isotopic analysis by reducing analytical sensitivity; collection from trees in late fall is not ideal compared to collection during mid-summer months.
1.5.2 Use of Foliar δ15N Tree Tissues as an Indicator of Subsurface Nitrogen Contamination: Recent Studies
Recent studies have utilized δ15
N values to trace subsurface/surface nitrogen
transport, understand tree uptake and translocation of nitrogen, as well as help to determine the environmental fate of nitrogen (Table 8). Choi et al. (2005) determined the extent of ammonium and nitrate uptake using foliar δ15N values and the application of fertilizers containing primarily urea with a δ15N value of -2.7‰. According to foliar analysis of current and 1-year old needles, loblolly pine (Pinus taeda L.) preferentially absorbed ammonia to nitrate. The plots of ammonium vs. δ15N-NH4 were positively correlated for 1 year old needles (average r2 = 0.49). Thus, the δ15N values of needles represented δ15N-NH4 of soil N, and not δ15N-NO3 (Table 8) (Choi et al., 2003; Choi et al., 2005).
32
compared to ammonium, especially in the foliar tree tissues (Table 8). This study showed that nitrate was more likely to enter the tree nitrogen pools due to rapid assimilation in roots and leaves.
Jordan et al. (1997) used 15N enriched-wastewater to study the fate of nitrogen in grassland and forested ecosystems for two years. Wastewater had δ15N differences of +13‰ to +25‰ relative to vegetation and +6‰ to +20‰ relative to soil-N. The authors observed a
dramatic increase in foliar δ15N values by +10‰ over a two year application period. Pre-application δ15N values were between -2.0‰ to -4.0‰ for all trees (Quercus alba, Pinus ridida, and Quercus velutina) and +4.0‰ to +6.0‰ for all trees two years after irrigation
started (Table 8).
1.6 Hypothesized Isotopic Values in Trees Impacted by Swine Waste Lagoons/WAF’s Groundwater impacted by swine lagoon effluent will have δ15N isotopic values between +5‰ to +25‰ for both nitrate and ammonia (Xue et al., 2009). Trees that use groundwater enriched with swine waste should see rooting zone δ15N values in the range of +5‰ to +25‰. Foliar tissues should have more positive δ15N values compared to the stem and roots, especially if the tree preferentially absorbs nitrate. However, as shown in the prior section, the δ15N of leaves more closely reflects the δ15
N of the N source, particularly if the primary N source is nitrate. Figure 12 provides hypothesized δ15N values expected in trees if groundwater and soil are impacted by swine waste lagoons leachate or land application of lagoon waters on waste application fields.
33
objectives need to be evaluated to determine the feasibility of this method:
1. Characterize the extent of swine waste contamination (N) in subsurface. 2. Characterize tree leaves for δ15N values.
3. Correlate groundwater data to isotopic tree data.
I hypothesize that when trees utilize groundwater contaminated with swine waste, these trees will have more positive δ15N values than trees that utilize non-contaminated groundwater. Secondly, I hypothesize that higher concentrationsof swine waste in the subsurface will result in more positive δ15N values in tree leaves.
34
Chapter 2 – Site Introduction
2.1 Research Site Description
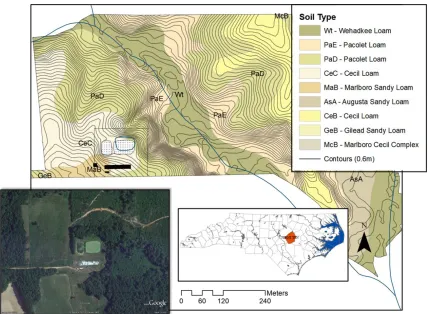
The study site is located in Johnston County, NC, and is an inactive hog operation with two lagoons (Figure 8). The Johnston County (JC) site is 127 acres that was given to
Figure 8: Johnston County, NC, research site with soil and 0.6 meter contours.
35
(Piedmont Geologic, 2006). The 5-acre pasture was planted with Loblolly Pine (Pinus taeda) in 2007 by North Carolina State University.
Piedmont Geologic completed a Phase II Environmental Site Assessment (ESA) of the site in February 2007. The ESA involved collection and analysis of groundwater, surface water, and soils samples (Figure 9; Piedmont Geologic, 2007). Soil samples were analyzed for nitrates, ammonia nitrogen, and Kjeldahl nitrogen; ground water and surface water samples were analyzed for nitrates, ammonia nitrogen, and Kjeldahl nitrogen. At that time, the regulatory standards were 10 mg/L for nitrate in ground water/drinking water (Piedmont Geologic, 2007).
2.2 Historical Water Quality Data
2.2.1 Piedmont Geologic ESA Phase II Data
Results of the Phase II ESA for soil samples and surface waters are shown in Table 9 and 10. Surface water samples were all less than 0.7 mg/L nitrate, 0.10 mg/L or less for ammonia, and < 1.9 mg/L for Kjeldahl nitrogen (Table 10). Soil samples collected on the waste application field (WAF) had nitrate concentrations ranging between <1.0 mg/kg (S-2) and 19.0 mg/kg (S-5). Regulatory standards do not exist for soil and surface waters (Class C waters, NCDENR Redbook, Surface Waters and Wetlands Standards). Piedmont Geologic concluded no major impact on soil or stream quality due to land application of hog lagoon materials to the pasture area (Piedmont Geologic, 2007).
Piedmont Geologic also installed temporary ground water monitoring wells to
36
37
Table 9. Soil sampling results taken in February 2007 at various locations on the WAF, JC. Sources: Piedmont Geologic (2007).
Sample ID Nitrate/Nitrite N Ammonia Nitrogen Kjeldahl Nitrogen
(mg/kg) (mg/kg) (mg/kg)
Background Sample-1 <1.0 <5.0 1200
S-1 1.5 <5.0 1200
S-2 <1.0 <5.0 580
S-3 4.0 <5.0 3200
S-4 1.2 <5.0 970
S-5 19 10 1300
Table 10. Surface water sampling results collected in February, 2007 at various locations along the stream running through the property. Source: Piedmont Geologic (2007).
Sample ID Nitrate/Nitrite N Ammonia Nitrogen Kjeldahl Nitrogen
(mg/L) (mg/L) (mg/L)
S1-Downstream 0.66 <0.10 0.56
S2-Midstream 0.68 <0.10 1.7
S1-Upstream 0.59 <0.10 1.8
S2-Downstream 0.57 <0.10 0.71
S2-Midstream 0.56 0.10 1.9
S2-Upstream 0.60 <0.10 <0.50
Table 11. Concentrations of nitrate, ammonia, Kjeldahl nitrogen (mg/L) in groundwater collected at site in February 2007 (Piedmont Geologic, 2007).
Sample ID Sample Depth Nitrate/Nitrite N Ammonia Nitrogen Kjeldahl Nitrogen
(m) (mg/L) (mg/L) (mg/L)
GW-Background 8.5 0.84 <0.1 1.7
GW-1 4.3 10.0 1.8 5.7
GW-2 5.5 8.7 3.1 5.1
GW-3 4.3 10.0 0.20 5.9
GW-4 4.1 0.15 0.25 4.1
GW-5 12 14 0.14 2.2
NCDENR State Standards (NC 2L) 10.0a 1.5b a
NCDENR State Standards, 15A NCAC 02L .0202 Groundwater Quality Standards b
38
respectively, which is at and above the 10 mg/L NC 2L Groundwater Standards. Wells 1 and 2 had ammonia concentrations at 1.8 and 3.1 mg/L which is above the 1.5 mg/L Interim Maximum Allowable Concentrations (IMAC), NC 2L, groundwater standard (NCDENR DWQ Groundwater Standards, 2010). Methods utilized for soil, surface water, and groundwater for analysis were EPA Method 9056 for Nitrate N, EPA Method 350.1 for ammonia, and EPA Method 351.2 for Kjeldahl nitrogen. These 2007 data show that groundwater down-gradient of the lagoons (well 3) as well as on the waste application field was contaminated with ammonia and nitrate nitrogen at and above the current North Carolina regulations.
2.2.2 North Carolina State University Water Quality Data
Students and student interns from the Department of Forest and Environmental Resources collected surface water and ground water samples from the site in 2008 (Figure 10). NCSU students hand- augered a one-inch diameter PVC shallow ground water
monitoring well in 2007 in accordance with USGS, National Field Manual for the Collection of Water Quality Data (USGS, 2006). Surface water samples were collected at nine specific locations along the stream running through the property including the two inactive swine waste lagoons and a natural seep located down gradient of the lagoons.
39
Figure 10: Mean nitrate/nitrite and ammonia concentrations (mg/L; + one standard deviation) in surface water and groundwater samples collected in 2008 (April – December). Mean nitrate concentrations are shown in bold. (personal communication – Elizabeth Nichols.
0.61 mg/L ± 0.90 mg/L 0.03 mg/L ± 0.03 mg/L (n = 7)
Nitrate Concentrations (mg/L) Ammonia Concentrations (mg/L)
SW-1
0.58 mg/L ± 0.36 mg/L 0.08 mg/L ± 0.05 mg/L (n = 9)
SW-2
0.60 mg/L ± 0.40 mg/L
0.07 mg/L ± 0.04 mg/L (n = 8)
SW-3 0.67 mg/L ± 0.46 mg/L
0.07 mg/L ± 0.05 mg/L (n = 7)
SW-4
6.96 mg/L ± 0.51 mg/L
0.05 mg/L ± 0.02 mg/L (n = 7)
SW-7
0.53 mg/L ± 0.32 mg/L
0.06 mg/L ± 0.05 mg/L (n = 8)
SW-8
0.44 mg/L ± 0.16 mg/L
0.06 mg/L ± 0.04 mg/L (n = 8)
SW-9 SW-6 (Seep)
0.57 mg/L ± 0.34 mg/L
0.07 mg/L ± 0.04 mg/L (n = 6)
GW-5 (Well 7)
2.75 mg/L ± 1.09 mg/L
0.04 mg/L ± 0.02 mg/L (n = 7)
0.06 mg/L ± 0.06 mg/L
0.26 mg/L ± 0.23 mg/L (n = 3)
0.05 mg/L ± 0.04 mg/L
1.89 mg/L ± 1.58 mg/L (n = 3)
NC State Regulations, NC 2L Standards (Groundwater) Nitrate/Nitrite – 10 mg/L
40
Table 12. Concentrations of nitrate, ammonia, total Kjeldahl nitrogen (TKN), total phosphate (TP) for surface water and groundwater samples collected in 2008 by NCSU (personal communication – Elizabeth Nichols).
Sampling Date
4/1/2008 5/14/2008 6/18/2008 7/11/2008 8/2/2018 8/16/2008 10/3/2008 11/7/2008 12/19/2008 SW-1
Nitrate (mg/L) 0.15 0.17 - 2.5 - 0.93 0.04 0 0.48
Ammonia (mg/L) 0.02 0.03 - 0.03 - 0.10 0.02 0.01 0.02
TKN (mg/L) 0.26 0.16 - 0.65 - 1.1 0.32 0.19 0.28
TP (mg/L) 0.03 0.04 - 0.06 - 0.28 0.04 0.04 0.04
SW-2
Nitrate (mg/L) 0.37 0.25 1.2 0.32 - 0.48 0.51 0.36 0.57
Ammonia (mg/L) 0.06 0.18 0.03 0.13 - 0.13 0.07 0.04 0.07
TKN (mg/L) 0.52 0.70 0.52 0.83 - 0.89 0.62 0.64 0.53
TP (mg/L) 0.05 0.06 0.08 0.18 - 0.17 0.06 0.05 0.06
SW-3
Nitrate (mg/L) 0.35 1.4 0.41 0.97 - 0.45 0.47 0.18 0.57
Ammonia (mg/L) 0.05 0.05 0.11 0.04 - 0.13 0.06 0.02 0.06
TKN (mg/L) 0.49 0.63 0.82 0.44 - 0.95 0.58 0.58 0.57
TP (mg/L) 0.05 0.11 0.17 0.06 - 0.18 0.06 0.07 0.06
SW-4
Nitrate (mg/L) - - 1.6 0.35 0.84 0.42 0.49 0.33 0.61
Ammonia (mg/L) - - 0.06 0.14 0.03 0.12 0.05 0.01 0.06
TKN (mg/L) - - 0.66 0.86 0.48 0.80 0.65 0.45 0.57
TP (mg/L) - - 0.11 0.19 0.05 0.15 0.07 0.05 0.07
GW-5 (Well 7)
Nitrate (mg/L) 1.9 2.2 - 1.8 - 4.8 2.9 3.5 2.1
Ammonia (mg/L) 0.07 0.05 - 0.04 - 0.01 0.03 0.01 0.05
TKN (mg/L) 1.1 0.32 - 1.0 - 0.42 1.0 0.49 0.71