Transactions of the 17th International Conference on
Structural Mechanics in Reactor Technology (SMiRT 17)
Prague, Czech Republic, August 17 –22, 2003
Paper # K11-3
Development of Uniform Hazard Response Spectra for a Site
A.K.Ghosh and H.S.Kushwaha
Reactor Safety Division; Bhabha Atomic Research Centre; Mumbai 400085; India
ABSTRACT
Traditionally, the seismic design basis ground motion has been specified by normalised response spectral shapes and peak ground acceleration (PGA). The mean recurrence interval (MRI) used to be computed for PGA only. The present work develops uniform hazard response spectra i.e. spectra having the same MRI at all frequencies for Tarapur Atomic Power Station site. Sensitivity of the results to the changes in various parameters has also been presented. These results determine the seismic hazard at the given site and the associated uncertainties.
KEY WORDS: earthquakes, seismic hazard, faults, lineaments, line and point sources, peak ground acceleration, response spectrum, mean recurrence interval, probability of exceedence, seismic risk, magnitude-frequency relationship, uniform hazard response spectrum.
INTRODUCTION
The objective of aseismic design of power plant components and structures is to ensure safety of the plant and the people around in the event of an earthquake. Safety needs to be ensured against a set of postulated events originating at various locations, as dictated by the local geological and tectonic features and data on past earthquakes. The design basis ground motion is generally specified by normalised response spectra (also known as response spectral shapes or the dynamic amplifications factors, DAFs) for various values of damping and a PGA. The former is obtained by a statistical analysis of a large number of records having earthquake parameters in the range of interest and selecting a shape with an acceptable value of the probability of exceedence.
The various uncertainties and randomness associated with the occurrence of earthquakes and the consequences of their effects on the NPP components and structures call for a probabilistic seismic risk assessment (PSRA). Seismic hazard at the site is one of the key elements of the PSRA [1].
The seismic hazard at a given site is generally quantified in terms of the probability of exceedence of the design level PGA [2] and the probability of exceedence of the specified ground motion response spectral shapes [3]. In the approach which has traditionally been adopted the probability of exceedence of the spectral shape is with respect to the database from which it has been derived and is not related with the temporal or spatial distribution of earthquakes. The probability of exceedence of the PGA is, however, evaluated considering the spatial and temporal distribution of earthquakes.
The new SRP [4] and Regulatory Guide [5] of USNRC recommend development of unnormalised response spectra. USNRC [5] further proposes to carry out a probabilistic safety hazard analysis (PSHA) based on uniform hazard response spectra (UHRS).
THEORY
3
Cornell [2] has presented a model for evaluating the MRI or the probability of exceedence, P of a specified value of PGA. Ghosh et al. [6] extended the method to spectral acceleration for line and point sources of earthquakes considering a generalised form of correlation. In this paper, a similar methodology is applied to determine a uniform hazard response spectrum.
SEISMIC HAZARD ANALYSIS
The seismic hazard analysis presented by Cornell [2] is based on the peak ground acceleration (ap ) which is
assumed to be of the form
a
p=
b
b M R
−b1
exp(
2)
3 (1)where b1,b a n d b2 are constants, M is the earthquake magnitude and R is the hypocentral distance.
It has been observed that PGA predicted by relations of the type given by equation (1) does not agree very well with observations particularly for smaller values of R and a distance correction term (D) has been considered by many workers.
Several correlations are available for defining the peak ground acceleration (a) for horizontal motion - each developed from a particular data set, and therefore, best suited for interpolation within a particular range of parameters. A widely used form for PGA is:
a = b1 exp(b2M) (R+D)-b3 (2)
where M is the magnitude, R is the distance and D is a correction term to account for ‘zero distance’. For any application, an equation has to be chosen that is best suited to a given source-site combination and the range of parameters under consideration.
ATTENUATION RELATION FOR SPECTRAL ACCELERATION
The present regulatory documents [4,5] require the ground motion to be presented as the unnormalised response spectrum itself without scaling it to PGA. Attenuation relation has been developed for the unnormalised response spectrum [6].
The response spectral acceleration is assumed to be of the same form as given by equation (2) i.e.
S = S(M, R, ζ,.T) = b1 exp(b2M) (R+D)-b3 (3)
where M is the magnitude and R is the hypocentral distance. D is a distance correction factor, ζ is the value of damping and T is the period for which the response spectrum is being evaluated. The constants, b1 , b2 , b3 depend on ζ
and T.
Line Source Model
The number of earthquake of magnitude greater than or equal to M occurring annually is given by Richter’s equation
lo
g
10N
M= −
a b
M
(4)
a and b for a given region are determined from the earthquake occurrence records of that region.
Considering the effect of all possible values of the focal distances, the cumulative probability is obtained.
]
[
S
S
dP
≥
G
S
C
dr
r
f
r
R
S
S
P
S
S
P
b d r d d d 2 0)
(
]
[
)
(
β −=
=
≥
=
≥
∫
(5)f
R( )
r
the probability density function of finding an earthquake at a radius r, and G for various types of fault orientation have been presented in [6].- 2 0 1b M
b
e
C
=
β β
and β = b ln 10.
Equation (6) yields the probability that the spectral acceleration (for given values of damping and period) at site, S will exceed a certain value, Sd , given that an event of interest ( M ≥ M0 ) occurs anywhere on the fault.
If certain events are Poisson arrivals with average arrival rate ν and if each of these events is independently, with probability p, a special event, then these special events are Poisson arrivals with average annual arrival rate p
ν. The probability, pi, that any event of interest M ≥ M0 will be a special event is given by equation (6).
Thus the number of times, N, that the spectral acceleration (for given values of damping and period) at the site will exceed Sd in an interval of time t has the probability:
;
0
,
1
,
2
,...
!
)
(
)
(
)
(
=
=
≥
=
−n
=
n
t
p
e
S
S
n
N
P
n
P
n i t p d Niν
ν
(6)
Of particular interest is the probability distribution of Smax, the maximum spectral acceleration (at given damping
and period) over an interval of time t.
t p d d i
e
S
S
N
p
S
S
p
ν −=
≥
=
=
≤
]
[
0
]
]
[
max(7)
The annual probability of exceedence of Smax > Sd is then
)
(
exp
1
1
/b2d p
a
C
G
S
F
=
−
−
ν
−β−
2 /b dS
G
C
ν
−β
The mean recurrence interval ( Ty ) of the spectral acceleration Sd is then the reciprocal of ( 1 - F ap ) i.e.,
2
1
bd
y
S
G
C
T
β
ν
=
(9)Then equations (7) and (9) may be used to obtain the probability of exceedence of Sd in a given span of t
years as
P
=
1
−
exp
(
−
t
/
T
y)
(10)The seismic hazard at a site is quantified by the probability (P/S >Sd) and
T
and the uncertainties in thesequantities due to variations in the correlations for spectral acceleration and uncertainties in the seismic source and occurrence models i.e. a and b, depth of focus, h.
y
Point Source Model
When there are clusters of earthquakes away from the site, each cluster could be modelled as a point source of earthquakes. In case of a single point source there is no randomness with respect to the location of the earthquake, hence for a specified value of spectral acceleration the magnitude is also fixed by the chosen correlation for spectral acceleration. The probability of exceedence of the specified value of spectral acceleration is therefore decided by the temporal distribution of earthquakes.
G
S
C
r
d
S
S
P
[
d)
]
db2β
−
=
=
≥
(11)2 3
)
(
bb
D
r
G
where
β
−
+
=
(12)Multiple Line and Point Sources
When there are a number of line or point sources the probability of non-exceedence of a specified value of spectral acceleration is obtained by multiplying the probability of non-exceedence of the specified value of spectral acceleration from each of the sources i.e.,
∏
=≤
=
≤
NSi
source ith the from d
d
p
S
S
S
S
p
1
max
max
]
[
]
[
]
[
exp
1
2
∑
=−
−
=
NSi i i
b d i
S
G
C
ii
ν
β
PRESENT STUDY
The present study uses 144 horizontal acceleration records from rock sites to develop attenuation relation for response spectral acceleration [6]. The range of magnitude is generally from 4.1 to 8.1 and there are few records of magnitude lower than 4.1. The distance from the fault varied generally about from about 6 km to 125 km. The salient features of the accelerograms are given in [6]. The digitised accelerograms were obtained on magnetic tapes from the World Data Center[7] . In these data, the original accelerograms have been band-pass filtered between 0.07 Hz and 25 Hz and base line corrections have been made. Analysis has been carried out with the recorded accelerograms representing the free-field conditions. The geological conditions of the recording sites, identified by the name and number of the recording station, are verified from published sources.
It has been observed that the response spectra of the two horizontal components recorded at the same location are often significantly different. This may be attributed to the orientation of the instrument with respect to the fault. To ensure conservatism, the attenuation for spectral acceleration (equation (3)) at any frequency was developed by selecting only the higher of the two horizontal spectral values of the records at a particular site. The attenuation relations thus developed were used for the development of uniform hazard response spectra.
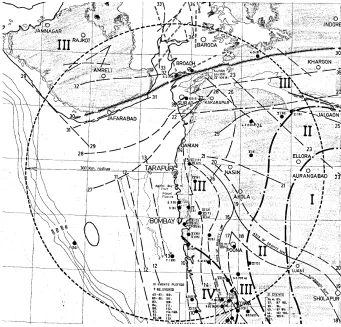
The geological, tectonic and seismic study for the site was earlier carried out to develop the design basis Ground motion [8]. The lineament map is presented in fig. 1. Each of these lineaments shown in the 300 Km. radius circle around the site has been considered as a line source. The length of the lineaments and their distance from the site has been obtained from this map. Fig. 1 also shows some of the epicenters of earthquakes.
Earthquake data for the period 1504-2001 AD have been obtained from various catalogues available as published literature (global sources). Data have also been obtained from the Gauribidanur Seismic array (GBA) of Bhabha Atomic Research Centre period for the period 1977-1995 AD. Broadly the data from both the sources can be viewed as (i) those belonging to Koyna and (ii) others. The first recorded earthquake from Koyna is in the year 1965. The magnuitude –frquency relationships for the earthquake data from global sources are presented in Figs. 2a and 2b. The figures include the observed data and results of an earlier study by Ravi Kumar et al. [9]. A least square fit of the data was carried out (see equation (3)) and the constant of the equation (‘a’ value) was increased to obtain a modified fit to envelope the observed data which is also included in the figures.
The ‘a’ and ‘b’ values obtained from [9] yields a rather unconservative value of the occurrence rates of earthquakes in the Koyna region. Based on all the data a realistic set of values have been used for obtaining the UHRS which is close to the least square fit and conservative for the magnitude range M > 6 which produces acceleration in the range of interest for design. The least square analysis showed a large variation of ‘a’ values obtained from the earthquake data from global sources and GBA (see Table-1). The variation of ‘a’ for Koyna earthquakes was, however, not significantly large. The ‘a’ and ‘b’ values obtained from various studies are presented in Table-1.
The Koyna earthquakes occur in a small cluster. These earthquakes are assumed to be generated from a point source. The ‘a’ and ‘b’ values for all the line sources are assumed to be the same.
The analysis has been carried out considering a maximum magnitude of 6.5 for earthquakes occurring in the region under study [9].
NUMERICAL RESULTS
Usually, the value of Ty for PGA is required to be of the order of hundred years for the operating basis
earthquake (OBE or S1) and ten thousand years for the safe shutdown earthquake (SSE or S2).
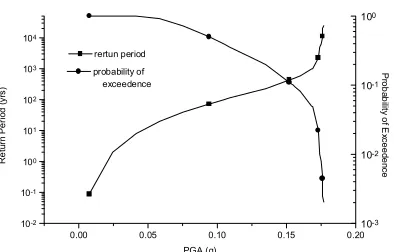
Fig. 3 shows the variation of MRI and the probability of exceedence in 50 years as a function of PGA. The ‘a’ and ‘b’ values for various sources are the reference values given in Table-1. A sensitivity study was carried out to see the variation of MRI with PGA for various values of ‘a’ and ‘b’ (Fig.4). ‘a’ and ‘b’ shown in Figs 3 and 4 refer to those of the lineaments The ‘a’ value for Koyna source was kept at the base value while ‘b’ followed the value for the other lineaments.
REFERENCES
1. Kennedy RP and Ravindra MP. Seismic Fragilities for Nuclear Power Plant Hazard Studies, Nuclear Engineering and Design, 1984; 79, 47-68.
2. Cornell, C.A. Engineering Seismic Hazard Analysis, Bulletin of the Seismological Society of America, 1968; 59, 5, 1583-1606.
3. Ghosh AK, Rao KS and Kushwaha HS. Development of ResponseSpectral Shapes and Attenuation Relations from Accelerograms Recorded on Rock and Soil Sites, Report BARC/1998/016, Bhabha Atomic Research Centre, Government of India, 1998.
4. U.S.N.R.C. Vibratory Ground Motion, Standard Review Plan 2.5.2, NUREG- 800, Rev.3., 1997.
5. U.S.N.R.C. Identification and Characterisation of Seismic Sources and Determination of Safe Shutdown Earthquake Ground Motion, Regulatory Guide 1.165. ,1997.
6. Ghosh AK and Kushwaha HS. Development of Uniform Hazard Response Spectra for Rock Sites Considering Line and Point Sorces of Earthquakes, Report BARC/2001/E/031, Bhabha Atomic Research Centre, Government of India, 2001.
7. World Data Centre. Catalogue of Seismographs and Strong Motion Records, Report SE-6, Solid Earth Geophysics Division, Environmental Data Service, Boulder, Colorado, U.S.A, 1985.
8. Ghosh AK and Banerjee, D.C. Earthquake Design Basis for Tarapur Site, Internal Report, Bhabha Atomic Research Centre; March 1990
9. Ravi Kumar, M. and Bhatia, S.C. A New Seismic Hazard Map for the Indian Plate Region Under the Global Seismic Hazard Assessment Programme, Current Science,999, 77(3), 447-453.
TABLE –1
Magnitude – Frequency Relationships
Koyna
Others
Remarks
Data
a
b
a
b
Global
2.63
0.505
1.10
0.505
Least Square Fit data modified to
envelope the observed values
GBA
2.794
0.505
1.785
0.505
Least Square Fit data modified to
envelope the observed values
Ref [9]
2.1016
0.5989
2.1016
0.5989
2.8
0.5989
2.1016
0.5989
Base values used in analysis (see
FIG. 1: TECTONIC MAP
2 3 4 5 6 7
-2.0 -1.5 -1.0 -0.5 0.0 0.5 1.0
Fig. 2a: Magnitude-Frequency Relationship; Koyna Data; Global Sorces
obs. data mod. fit ref. [9] used in analysis
lo
g 10
N
Magnitude 3 4 5 6 7
-3.0 -2.5 -2.0 -1.5 -1.0 -0.5 0.0 0.5
Fig. 2b: Magnitude Frequency Relationship; Other Data; Global Sources
obs. val. mod. fit ref[9] and used in analysis
lo
g 10
N
0.08 0.10 0.12 0.14 0.16 0.18 0.20 100 101 102 103 104
Fig. 4: Sensitivity of the Return Period for PGA to a and b (for line sources) a=2.1016; b=0.505
a=2.1016; b=0.5989 a=1.1; b=0.505 a=1.8; b= 0.505
R e tu rn P e ri od ( yr s) PGA (g)
0.00 0.05 0.10 0.15 0.20
10-2 10-1 100 101 102 103 104 rertun period
Fig.3 : Return Period and Probability of Exceedence for PGA; a= 2.1016 and b=0.5989 for Line Sources
R e tu rn P e ri od ( yr s) PGA (g) 10-3 10-2 10-1 100 probability of exceedence P rob ab ilit y of E xc eed en ce
0.0 0.5 1.0 1.5 2.0 2.5 3.0
0.00 0.05 0.10 0.15 0.20 0.25 0.30 0.35 0.40 0.45
Fig. 6: 5% Damping UHRS for Various Values of P
P=0.5 P=0.05 P=0.005 Spe ct ral A cc. ( g ) Period (sec)
0.0 0.5 1.0 1.5 2.0 2.5 3.0
0.00 0.05 0.10 0.15 0.20 0.25 0.30 0.35 0.40 0.45 0.50
Fig. 5: 5% Damping UHRS for Various Values of Return Period
Ty = 100 yrs Ty = 1000yrs T
y = 10000yrs