ESTIMATING BALD EAGLE POPULATION SIZE USING DUAL FRAME SAMPLING TECHNIQUES DAWN E. HAINES AND KENNETH H. POLLOCK
Estimating Bald Eagle Population Size Using
Dual Frame Sampling Techniques
Dawn E. Haines and Kenneth H. Pollock Department of Statistics
North Carolina State University Raleigh, NC 27695-8203
Institute of Statistics Mimeo Series No. 2287
June 28, 1996
Abstract
Monitoring the number of animals in any wildlife population is an important task. Studying the bald eagle population is particularly worthwhile for a variety of reasons. In addition to being our national symbol and having threatened status under the Endangered Species Act of 1973, bald eagles serve as good indicators of environmental health. To estimate the number of bald eagles in a specific area, we recommend the implementation of a dual frame sampling technique widely used in agricultural surveys by the U. S. Department of Agriculture. This methodology combines an incomplete list frame with an area frame that is assumed to be complete. A key assumption in this scenario is that the list and area frame sampling schemes are independent. Hartley's "screening" estimator is used to combine sample information from both frames. The quantities estimated include both the number of active and successful nests along with their standard errors. The properties and advantages of the dual frame method are discussed. Finally, an example illustrating the methodology is presented.
1
INTRODUCTION
The bald eagle (Haliaeetus leucocephalus) is one of the most widely recognized birds in
the United States. The eagle, regarded by most Americans as our national symbol, is
currently listed as threatened under the Endangered Species Act of 1973. Therefore,
populations of bald eagles are widely studied. One reason for continued monitoring of
these populations is that bald eagles are good indicators of ecosystem health as well as
overall water quality. In particular, eagles nesting around large bodies of water in the
United States are being examined for the purpose of measuring several environmental
and ecological variables (Bartish 1994).
Deciding how to measure the total well-being of the environment is not a simple task.
However, justification for including bald eagles as an indicator of the health of a region
is overwhelming. First ofall, eagles are at the top of the food chain and depend heavily on a diet consisting of aquatic prey. Toxic substances existing in the aquatic habitat
eventually poison the inhabitants. Consequently, bald eagles ingest the poisoned prey
and become contaminated themselves. Eagles are known to be very sensitive to many
contaminants, especially over an extended period of time. Eagle nestlings, which are
young birds not yet ready to leave the nest, are not free from the influence of the toxins.
In fact, evidence of toxic compounds has been detected in unhatched bald eagle eggs in
addition to nestling plasma samples. Obvious responses to contamination include egg
shell thinning and decreased productivity.
Assessment of the health of the overall ecosystem using eagles is necessarily based on
several variables. First, eagle productivity and mortality rates are measured.
Contam-inant burden is another plausible variable to include in our study. Most contamination
data are collected on dead eagles, egg shells, and plasma samples. Other data may be
collected on contaminant exposure, habitat suitability, and human disturbance pressures
but will not playa role in our bald eagle population study. Rather, our study is primarily
concerned with estimating the total number of active eagle nests in a predefined region.
In addition, we consider estimating the number of successful nests in this population.
a successful nest is a nest that produces at least one fledgling. General trends in the
population, such as those that may be observed in reproductive performance, are usually
evaluated and reported. Although the bald eagle is a desirable species for measuring
environmental health, the methodology developed here may be applied to other wildlife
populations where the breeding individuals use consistent and highly visible nesting
ter-ritories. Examples include herring gulls, hawks, osprey, and other raptors. These species
also have similar feeding habits to those of the bald eagle and may accumulate toxins in
a comparable fashion.
Developing a sampling frame is the first step in any probability sampling scheme. Two
types of sampling frames exist and are commonly known as list and area frames. The
most significant information contained on a list frame includes a written description of
eagle nest locations. Other quantities of interest may be ascertained and, hence, included
on the list frame. A list of nest locations from the previous year is typically available
although it will never be complete. In contrast to a list frame, an area frame is used to
describe the geographic boundaries of a population of eagle nests. Eagle populations are
known to physically occupy territories or regions whose exact surface areas are known.
To successfully implement an area frame, the population of bald eagles is partitioned into
sampling units, or subareas. A simple random sample of subareas is then selected from
the population. In addition to simple random sampling, it is common to perform stratified
random sampling. Stratification of the bald eagle population is based on habitat type,
geography, or another variable of interest. Once stratification is complete, each stratum
is divided into subareas. Finally, a simple random sample of subareas is drawn from each
stratum. Each subarea in the stratified random sample is then personally examined and
characteristics relevant to the study are recorded. Of primary interest is the number and
location of active nests. For each active nest discovered via enumeration, the enumerator
records whether it was an element of this year's list frame. Further, observed active nests
are categorized as successful or not successful.
The statistical literature discusses several advantages and disadvantages of both list
pop-ulation. Lists routinely collected for some purpose are usually found to be incomplete,
partially illegible, or to contain an unknown amount of duplication. List frames are
rel-atively inexpensive to construct and are more efficient to sample than area frames. In
contrast, an area frame is a collection of geographical areas defined by easily identifiable
boundaries. Area frames are often utilized because they provide complete coverage of the
target population. As a result, every sampling unit has positive probability of selection.
Area frames cost more to develop than list frames. The reason for this pertains to the
fact that area frames require personal enumeration whereas list frame enumeration can
be conducted via mail, telephone, or electronically. One desirable trait of area frames is
that they require very little maintenance and, hence, are relatively inexpensive to
main-tain. Major frame revisions are needed only when geographic characteristics substantially
change, which is not common in practice. Additionally, once an area frame is constructed,
it lasts many years. These favorable qualities along with advanced developments in aerial
photography and satellite imagery necessitate the implementation of area frames.
Instead of favoring one type of frame over the other, our approach is to use a joint
list-area sampling design to achieve full coverage of the target population. Multiple frame
survey methodology combines one or more incomplete list frames with an area frame that
is assumed to be complete. The purpose of this combination of frames is to offset the
weaknesses of each individual frame with the strengths of the other frames (Kott and
Vo-gel 1995). Since sampling from the incomplete list frame is conducted at such low cost, a
large percentage of sampling units are selected from the list. As a result, the list frame
portion of the dual frame estimator provides an efficient method of obtaining precise
es-timates. A much smaller proportion of sampling units are selected from the area frame
due to increased enumeration costs. However, the area frame offers a means to measure
the incompleteness of the list frame. In this paper, we illustrate how to combine the list
and area frame information to efficiently estimate the number of active eagle nests and
the total number of successful nests in the target population. In Section 2, we describe
the dual frame method and discuss different estimation methods. Section 3 presents an
discussion of the paper.
2
THE DUAL FRAME METHOD
2.1 Background: The Screening Estimator
To apply appropriate list frame methodology to the population of eagle nest locations, the
experimenter utilizes the list frame from last year. This list frame is usually available but
is inevitably incomplete. The list frame of nests includes a detailed description of both
active and inactive eagle nest sites. Since we are interested in locating the nests annually,
it is imperative to carefully document the exact location of each nest.
The list frame for this year is constructed by taking last year's list frame and adding
to it any active nests discovered during last year's area frame sample. There are several
ways for an enumerator to discover nests that are not recorded on last year's list frame.
First, the nest discovered may be brand new to the population. This is regarded as a
birth and indicates that the nest originated since the last eagle study. Another feasible
explanation for the emergence of new nests relates to the incompleteness of last year's list
frame. That is, not all nests existing in the study area last year were represented on last
year's list frame. Finally, eagle nests are often abandoned. Formerly abandoned nest sites
may now be occupied by different pairs of eagles. As a result, a nest may be discovered
in last year's area sample but not be present on last year's list frame. Once this year's
list frame is constructed, we are ready to select our sample.
One method of sampling is initiated by stratifying this year's list frame on a chosen
variable. For example, stratification may be based on geography, habitat features, or
other physical characteristics. A simple random sample of nest sites is then drawn from
each stratum. Next, each sampled site is personally visited by an enumerator. At this
point, the enumerator's job is to classify sampled nest sites as active or inactive.
A number of changes in the nests may have taken place since last year's survey. For
instance, nests that were active last year may now be inactive. This is referred to as
estimate the total number of successful nests in the population.
The area frame procedure is applied to a region whose exact surface area is known.
As with the list frame, the area frame is stratified on a designated variable. The
strati-fication variables for the list and area frames are not required to be the same. However,
stratification may be based on the same variable for both frames. The analysis is greatly
simplified in this case. For the bald eagle area frame, it is reasonable to define 3 - 5
strata based on a chosen variable. Furthermore, each stratum contains explicit sampling
units or subareas. Once stratification is performed, subareas are randomly selected from
each stratum. The enumerator visits each subarea in the stratified random sample and
thoroughly searches for nest sites. Note that we assume enumeration within subareas is
conducted without error. That is, we assume all active nests contained within selected
subareas are discovered. Moreover, we assume inactive nests existing within subareas are
not recorded in the area sample.
Multiple frame sampling is a popular sampling scheme that combines list and area
frame information. The technique of multiple frame estimation has been utilized for
more than 40 years. Hartley (1962) was the first to theoretically derive the multiple
frame methodology. Considerable extensions to this work are due to Cochran (1965),
Lund (1968), Fuller and Burmeister (1972), Hartley (1974), and Bosecker and Ford (1976).
Hartley's approach considers two sampling frames, denoted A and B, along with the
domains generated by their intersection. In addition, Hartley assumes simple random
sampling within each frame and ignores finite population correction factors. In the case
of two frames A and B, we define domains a, b, and abo Domain a consists of those
elements belonging only to frame A, and likewise, domain bconsists of those elements belonging only to frame B. Domain ab, however, contains units that belong to both
frames A and B.
Multiple frame sampling requires two assumptions, namely completeness and
identifi-ability. Completeness requires that every unit in the target population belong to at least
one of the frames in the study. This requirement is satisfied simply by using an area
parti-tion the populaparti-tion elements into 2k - 1 mutually exclusive domains. The completeness
assumption prohibits the existence of a domain with no member elements; hence, the 1
is subtracted in the above formula. In the same manner, we partition sample units into
2k - 1 domains. Identifiability, on the other hand, is the ability to discern whether or not
a sampled unit from one frame could possibly belong to any other frame in the study.
Validating the identifiability assumption determines frame overlap. In our context, a
pro-cess called unduplication is used to remove any sampling units from the area sample that
were accessed by way of the list frame sample.
To illustrate multiple frame estimation techniques for the bald eagle population, we
first introduce appropriate terminology and later define relevant notation. Unduplication
is the process by which sampling units in the area sample are separated into two distinct
domains, commonly known as the nonoverlap and overlap domains. This means active
nests discovered in subareas by way of personal enumeration are categorized into one
of these two domains. In this context, the portion of the area frame referred to as the
nonoverlap domain includes nest sites sampled from the area frame that are not included
in this year's list frame. Consequently, only area sample nests not on this year's list frame
contribute to the area portion of the multiple frame estimate. By contrast, the overlap
domain contains nests sampled from the area frame that are also included in this year's
list frame.
Unduplication is a complex process. Although the method seems simple to
em-ploy, it is typically the leading source of nonsampling error in multiple frame sampling
(Nealon 1984). To unduplicate a sample, enumerators carry a copy of this year's list
frame with them in the field. After contact with each active nest in the sampled subareas,
the enumerator records whether or not this nest was included on this year's list. Ifarea
sample nests which appear on the list frame are not identified as such, then resulting
multiple frame estimates are inflated. Also, difficulties may arise if a reporting unit is not
defined and identified in a consistent manner. For the population of eagle nest sites, this
In this framework, an appropriate estimator of the population total,Ys, of a variable
of interest is Hartley's "screening" estimator, denoted
whereYA is the area frame estimate of the population total,YA, of the variable of interest
in the nonoverlap domain, and
YL
denotes the list frame estimate of the populationtotal, YL, of the variable of interest in the overlap domain. As a result, we estimate
the population total Ys by combining the individual estimates ofYA and YL. The name
screening estimator follows from the fact that elements of the area frame sample are
"screened" and included in the estimation process only if they are not found on this
year's list frame.
No matter the type of sampling employed in the multiple frame approach, it is vital
that we maintain independence of the area and list frame sample selections. When this
assumption holds true, the variance of the screening estimatorYs is given by
Ifindependence of sampling procedures between the two frames is guaranteed, it is
possible for the area frame to estimate the incompleteness of the list frame. Independence,
or guarding one frame from the influences of the other, implies that list frame information
cannot be used to aid in the discovery of nests in area frame samples. Additionally, it
is necessary to ensure that nests found through area frame sampling are not added to
the list frame until we construct the subsequent year's list frame. Adding nests to the
list frame prematurely can bias the estimation process by effectively changing selection
probabilities (Kott and Vogel 1995). Additions to the list frame should only be allowed
when an entirely new sample is selected from both frames.
2.2 Estimation of Active Nests: The Screening Estimator
To relate the screening estimator directly to the bald eagle population, we completely
all area frame nests recorded are assumed to be active. Once a nest is found, it is first
classified as to whether or not it is on this year's list frame. Ifthe nest is on this year's
list frame, then information collected from this nest is not included when estimating YA.
Hence, entire nests are subject to withdrawal from the nonoverlap domain estimation
process. Ifa given nest was not a member of this year's list frame, we retain that nest in
our sample and record the relevant data.
Throughout the eagle survey, it is assumed that this year's list frame is readily available
to the practitioner. Thus, the list frame size is a known quantity. Further, it is recognized
that the list frame is not complete and that yearly maintenance is essential. As a result,
the screening estimator previously defined must be modified to account for these list frame
deficiencies.
In classical sampling theory, a population total estimator is defined as the product of
the population size and the sample mean of measurements taken on a variable of interest
from elements belonging to that population. In our example, we are initially interested in
estimating the total number of active nests on both the area and list frames. This is akin
to estimating population totals where the nonoverlap and overlap domains constitute the
two populations, respectively. We first consider the case where stratification is not used
in either the area or list frame sampling schemes. An estimator of the total number of
active nests in the nonoverlap domain of the area frame is
where
NA number of area sampling units in the area frame,
nA number of area sampling units selected,
and
YA
sample mean number of active nests in the nonoverlap domaintotal number of active nests in the nonoverlap domain
An estimator of the total number of active nests in the list frame is given by
where
NL number of nests on this year's list frame,
nL number of nests selected from this year's list frame,
and
fiL
sample mean number of active nests on this year's list frametotal number of active nests in sample from this year's list frame
nL
To obtain
fiL,
define the indicator variable Yi asy; = {
~
ith nest is active
ith nest is inactive
i=l, ... ,NL·
Since Yi is an indicator variable, note that
fiL
also represents the sample proportion ofactive nests on this year's list frame.
Combining the area and list frame estimators yields the screening estimator
which offers an estimate of the total number of active nests in the population. We express
ith nest is successful
The screening estimator is easily generalized to include multiple strata, and is described
in detail in the next subsection.
2.3 Estimation of Other Related Variables
In practice, it may be of interest to estimate variables such as the total number of successful
nests, number of young fledged, or contaminant burden among the active nests. Let Xi,
i
=
1, ... ,NL,denote the value of the variable of interest and NL denote the total numberof nests on this year's list frame. For example, if we are interested in estimating the
total number of successful nests, Xi takes the value 1 if the ith nest is successful, and 0
otherwise. That is,
Xi
= {
1o
ith nest is not successfuli
=
1, ... ,NL.However, if we are interested in estimating the number of young fledged, Xi gives the
number of young fledged in the ith nest. As before, let Yi denote 1 or 0, depending on
whether theith nest on the list frame is active or inactive, respectively. Define the random
variable
IfXi is zero for all inactive nests, as in the case of the number of successful nests or young
fledged, then Zi is the same as Xi. For the sake of concreteness, let us assume that we are
interested in estimating the total number of successful nests.
As previously stated, the total number of successful nests III the population, Zs,
consists of two parts:
and
ZL = total number of successful nests in this year's list frame.
To estimate Zs, a random sample of size nA area sampling units is selected from the NA
subareas in the area frame. In addition, an independent random sample of size nL nests
from the list frame is selected. Let ZA denote the sample mean number of successful nests
that are in the nonoverlap domain of the area samples, and let ZL denote the proportion
of successful nests among nL nests selected. That is,
total number of successful nests in the nonoverlap domain
nA
and
total number of successful nests in sample from this year's list frame
nL
A screening estimator for the total number of successful nests is
Zs
The variance of the screening estimator is
where
a;A
anda;L
are the population variances of the number of successful nests inthe nonoverlap domain and the list frame, respectively. Note that the finite population
correction factor(fpc) is utilized only in the list frame portion of the screening estimator. This is because a moderately-sized sample is selected from the list frame, whereas only
a small percentage of area sampling units are selected. An unbiased estimator of the
ith list frame nest is successful where
and
Note that ZAi is the number of successful nests in the nonoverlap (NOL) domain of the
ith subarea unit selected, whereas ZLi is an indicator variable for the success of the list
frame nests. That is,
ZLi = { 1
o
otherwisei = 1, .. .,NL'
One further extension that is applicable to the screening estimator is the
stratifica-tion of the list and/or the area frame. The stratificastratifica-tion may be performed on different
variables in different frames. Suppose that the area frame consists ofif strata and the list
frame consists of1strata. Stratified random samples are selected from both frames. A
screening estimator of Zs is given by
where
P I
Zs
=
L
NA(h)ZA(h)+
L
NL(h)ZL(h)'h=l h=l
(1)
total number of successful nests in NOL domain of hth area frame stratum
total number of successful nests in sample from hth list frame stratum
nL(h)
number of area sampling units selected from hth area frame stratum, and
=
number of nests selected from hth stratum on this year's list frame.An unbiased estimate of the variance of
Zs
is given bywhere
2
SzA(h)
Note that
Ys,
the estimator of the total number of active nests, and ~CYs), an unbiased estimator ofthe variance of:VS,
may be obtained using (1) and (2), respectively,where zi's are replaced by yi's. In Section 3, we give an example to illustrate the above
computations.
3
EXAMPLE
Consider a population consisting of three strata defined in the upper Michigan peninsula.
Assume that in this particular study a single variable is used to define three strata for
both the area and list frames. That is, ['
= [ =
3. Hypothetical data from such anTable 1: List Frame Data for Upper Michigan Peninsula
h NL(h) nL(h) No. Active Nests YL(h) No. Successful Nests ZL(h)
1 40 32 30 0.9375 27 0.84375
2 41 33 29 0.8788 28 0.84848
3 19 16 15 0.9375 13 0.81250
Table 1 contains typical data from a list frame. These numbers represent possible
observed values for the eagle population in the upper Michigan peninsula. To make sense
of the data, we describe how the numbers are obtained as well as the implications of their
values. For strata 1, 2, and 3, the current list frame has 40, 41, and 19 nests, respectively.
For each stratum, we take an approximate 80% sample of nests. A large percentage of
nests are selected from the list frame since it is relatively inexpensive to locate list frame
nests. In this experiment, we have selected 32, 33, and 16 nests from strata 1, 2, and 3,
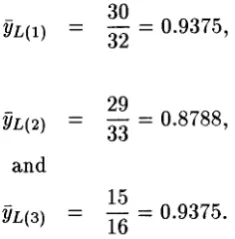
respectively. Of these nests, we observed that 30, 29, and 15 are active. As a result, the
sample proportions, YL(h) , of active nests for the three strata are
30
YL(l) 32 = 0.9375,
29
YL(2) 33 = 0.8788,
and
15
YL(3) 16 = 0.9375.
In addition to recording whether or not a nest is active, the enumerators also recorded
whether sampled nests were successful or not. They observed that in the sample of nests
selected, 27, 28, and 13 nests were successful in strata 1,2, and 3, respectively. Therefore,
27
28
2£(2) 33 = 0.84848,
and
13
2£(3) 16 = 0.81250.
Itis important to notice that 2£(1) here estimates the proportion of successful nests in
stratum 1, not the proportion of active nests in stratum 1 that were successful. The same
holds true for strata 2 and 3.
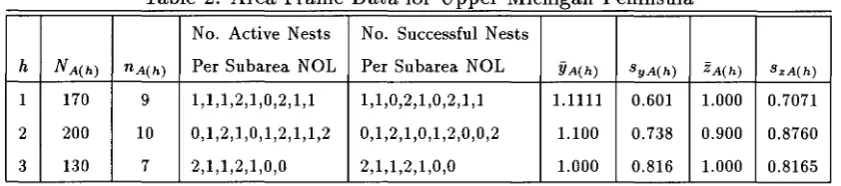
Table 2: Area Frame Data for Upper Michigan Peninsula
No. Active Nests No. Successful Nests
h NA(h) nA(h) Per Subarea NOL Per Subarea NOL YA(h) SyA(h) ZA(h) SzA(h)
1 170 9 1,1,1,2,1,0,2,1,1 1,1,0,2,1,0,2,1,1 1.llll 0.601 1.000 0.7071 2 200 10 0,1,2,1,0,1,2,1,1,2 0,1,2,1,0,1,2,0,0,2 1.100 0.738 0.900 0.8760 3 130 7 2,1,1,2,1,0,0 2,1,1,2,1,0,0 1.000 0.816 1.000 0.8165
Table 2 contains similar hypothetical data from area frame sampling. For strata
1, 2, and 3, there are 170, 200, and 130 area sampling units, respectively. We take an
approximate 5% sample of subareas within each stratum and carefully enumerate all active
nest sites within each sampled subarea. The set of all active nest sites thus enumerated
is compared with the current list frame sites to determine the number of active nests in
the nonoverlap domain. Also, the number of successful nests in the nonoverlap domain
within each sampled subarea is recorded.
From Table 2, we note that 10 active nests not found on this year's list frame are
discovered via enumeration of the nine subareas selected in stratum 1. Similarly, 11 and
7 active nests are found in the nonoverlap domain in the subareas selected in strata 2 and
3, respectively. Such large numbers of active nests in the nonoverlap domain emphasize
the incompleteness of the current list frame. As the quality (i.e. completeness) of the list frame improves, we expect to see a decrease in the number of nests in the nonoverlap
domain.
in the population is
Y
s=
(170·1.1111)+
(200·1.1000)+
(130·1.0000)+
(40·0.9375)+
(41·0.8788)+
(19·0.9375)(538.887
+
91.3433)=
YA
+
YL
=
630.23.Therefore, our estimate for the total number of active nests is 631, of which 539 are from
the nonoverlap domain and 92 are from the list frame. Ifone uses only the list frame, then
an estimate of the total number of active nests is 92, which is seriously biased downwards.
An unbiased estimate of the variance of
-Vs
is[
40 41 19 ]
+
31 (8) (0.9375) (.0625)+
32 (8) (0.8788) (.1212)+
15 (3) (0.9375) (.0625)[1159.857
+
2178.576+
1607.567]+
[0.6048+
1.0917+
0.2227]As a result, our estimate of the active number of nests is 631 with an estimated standard
error of 70.342. Notice that a large portion of the estimated variance of
-Vs
is due to thearea frame sample. Both the sampling rate (5%) and the variability in the number of active
nests in the nonoverlap domain contribute significantly to the large estimated variance of
-VA.
Also, the high sampling rate (80%) for the list frame and the high percentage of nestsin the list frame being active yield a small estimated variance for
-VL.
To estimate the total number of successful nests in the population, we use equation
Zs (170 ·1.000)
+
(200·0.900)+
(130·1.000)+
(40·0.84375)+
(41·0.84848)+
(19·0.81250)(480
+
83.975)=
ZA
+
ZL =
563.975.Therefore, our estimate for the total number of successful nests is 564, of which 480
are from the nonoverlap domain and 84 are from the list frame. An unbiased estimate of
the variance ofZs is
~(Zs)
=
[1702(0.7071)2+
2002 (0.8760)2+
1302(0.8165)2]9 10 7
+
[~~
(8) (0.84375) (.15625)+
~~
(8) (0.84848) (.15152)+
~~
(3) (0.81250) (.1875)][1605.0707
+
3069.504+
1607.567]+
[1.3609+
1.3178+
0.5789](6282.1417
+
3.2576)=
~(ZA)+
~(ZL)=
6285.4.Thus, an estimate of the total number of successful nests in the population is 564 with an
estimated standard error of 79.28.
4
DISCUSSION
The methodology proposed in this paper is not restricted to bald eagle populations.
Rather, it is useful for monitoring any wildlife population where the breeding
individ-uals have highly visible nesting territories which are stable over the course of many years.
As stated, we conduct our estimate of population totals by observing active nests with
breeding birds. Note that this measure automatically underestimates the total number of
eagles since it does not incorporate adolescents and non-breeding adults. However, as long
monitor the status of the entire population. Another issue to mention is that this paper
only addresses dualframe sampling techniques. This means only one area frame and one
incomplete list frame are employed in the estimation process. One area of future research
will focus on incorporating one area frame with multiple incomplete list frames. The
re-sulting estimator will be called a multiple frame estimator. Capture-recapture techniques
may also be utilized to obtain improved estimates of list frame size when there is more
References
[1] Tim Bartish, Design Considerations for Trust Species Monitoring: Bald Eagles and
Their Habitat in the Great Lakes Region, Biomonitoring of Environmental Status and
Trends (BEST) Program, December 1994.
[2] R. R. Bosecker and B. 1. Ford, Multiple Frame Estimation with Stratified Overlap
Domain, Proceedings of the Social Statistics Section, American Statistical Association
(1976), 219-224.
[3] R. S. Cochran, Theory and Applications of Multiple Frame Surveys, Ph.D. thesis, Iowa
State University, 1965.
[4] W. A. Fuller and 1. F. Burmeister, Estimators for Samples Selected from Two
Over-lapping Frames, Proceedings of the Social Statistics Section, American Statistical
Association (1972),245-249.
[5] H. O. Hartley, Multiple Frame Surveys, Proceedings of the Social Statistics Section, American Statistical Association (1962), 203-206.
[6] , Multiple Frame Methodology and Selected Applications, Sankhyci 36 (1974), 99-118.
[7] P. S. Kott and F. A. Vogel, Multiple-Frame Business Surveys, Survey Methods for
Businesses, Farms, and Institutions (B. G. Cox, ed.), John Wiley & Sons, 1995, pp. 185-203.
[8] R. E. Lund, Estimators in Multiple Frame Surveys, Proceedings ofthe Social Statistics
Section, American Statistical Association (1968),282-288.
[9] J. P. Nealon, Review of the Multiple and Area Frame Estimators, Staff Report 80, U.