ABSTRACT
LUONG, MARY GENEVIEVE. The Effect of Visual Cues on Visual Attention in a Novel Graph-Reading Task. (Under the direction of Dr. Brad Mehlenbacher and Dr. Douglas J. Gillan).
The Effect of Visual Cues on Visual Attention in a Novel Graph-Reading Task
by Mary G. Luong
A thesis submitted to the Graduate Faculty of North Carolina State University
in partial fulfillment of the requirements for the degree of
Master of Science
Psychology
Raleigh, North Carolina 2012
APPROVED BY:
_______________________________ ______________________________
Dr. Brah Mehlenbacher Dr. Douglas J. Gillan
Committee Co-Chair Committee Co-Chair
DEDICATION
BIOGRAPHY
ACKNOWLEDGMENTS
I would like to thank Dr. Anne Collins McLaughlin, whose passion for scholarly research is evident every day. I would also like to thank my committee members, Dr. Brad
Mehlenbacher, Dr. Doug Gillan and Dr. Don Mershon, for your insight and unwavering support.
TABLE OF CONTENTS
LIST OF TABLES ... vii
LIST OF FIGURES ... viii
The Effect of Visual Cues on Visual Attention in a Novel Graph-Reading Task ...1
Controlled and Automatic Processing ...2
Visual Information Processing ...3
Visual Attention ...4
Location Pre-Cuing ...7
Graphical Representations ...10
Summary ...12
The Present Study ...13
Hypotheses ...13
Method ...14
Participants ...14
Apparatus ...15
Materials ...16
Design ...17
Procedure ...18
Results ...19
Discussion ...24
Implications...25
LIST OF TABLES
Table 1 Demographics of Mechanical Turk Participants ...16 Table 2 Effects Summary for the Spatial Location and Visual Cue Mixed-Design
LIST OF FIGURES
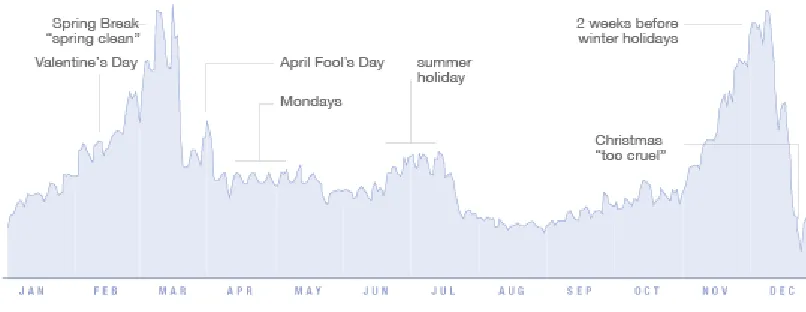
The Effect of Visual Cues on Visual Attention in a Novel Graph-Reading Task In the current digital era data is being generated at an unprecedented rate, especially on the Internet. Even the most mundane bits of web content become worthy of analysis because their sheer volume gives us insight into societal trends. One prodigious example is Facebook. McCandless (2009) used 10,000 Facebook™ status updates to create a graphic visualization of trends in relationship break-ups (see Figure 1). The Facebook™ example was just one of several in McCandless’ (2010) TED presentation used to make the point that “visualizing information [graphically] is a form of knowledge compression. It’s a way of squeezing an enormous amount of information and understanding into a small space” (13:40-13:53). But as increasing amounts of visual information are compressed graphically into small spaces, there are consequences to understanding.
Figure 1. McCandless’ data visualization of 10,000 Facebook™ updates about relationship
Controlled and Automatic Processing
One consequence to understanding is the amount of processing that is needed to interpret the information. Schneider and Shiffrin (1977) suggested that human information processing is comprised of controlled and automatic mechanisms. In controlled processing, information is viewed and interpreted with cognitive effort and is based on the individual’s goals. Conversely, automatic processing requires no mental effort by the individual but rather is handled automatically – after extensive training. For example, in a visual search task a participant is shown a target or set of target values (e.g., the letters J and D or the numbers 1 and 5), which must be committed to memory, then shown a series of displays filled with distractors (i.e., letters other than J and D or numbers other than 1 and 5) that may or may not also contain one of the targets.
cognitive processing by the participant, the target is found quickly and detection accuracy is high. There is also no effect of adding more distractors to the display.
Schneider and Shiffrin’s (1977) theory would generally attribute consequences to understanding to either controlled or automatic processing. In the case of controlled
processing, which they claim is necessary in the absence of extensive training, response time would be slowed and errors would increase with the compression of more visual information into a graphical display. However, if extensive training were provided on interpreting large amounts of graphical information, the researchers would argue that comprehension would be unaffected by the addition of visual stimuli to the display.
There is, however, a qualitative difference between understanding graphically presented data and simply searching for visual stimuli. The problem with using Schneider and Shiffrin’s theory is that in the absence of extensive training controlled search and automatic detection do not sufficiently explain the consequence of compressing large amounts of information into a graphic visualization. To more fully understand this
consequence, the following sections will look at visual information processing theory and, specifically, visual attention.
Visual Information Processing
attention. To review their work from this perspective, visual attention during controlled search was paramount to performance, activated by the individual, and effortful. Conversely, visual attention was unnecessary during automatic detection of visual information. As
previously noted, however, the central distinction between controlled and automatic
processing was extensive training, not visual attention. The following section will situate the evaluation of visual information processing in visual attention.
Visual Attention
Kahneman’s (1973) review of psychological research in attention offers a
foundational explanation of visual attention. Relevant details to the present study are that it is defined as a set of control mechanisms for assigning significance to visual information, or stimuli. Visual attention can be allocated spontaneously and sequentially; the former is instantaneous and the latter takes mental effort. One’s visual attention can be focused on a particular stimulus when its characteristics capture the viewer’s attention. Alternatively, an individual can direct his or her visual attention to areas that may or may not contain task-relevant stimuli. A central theory of visual attention was developed by Treisman and Gelade (1980).
of features; e.g., contrast and shape. Features are processed automatically, with negligible mental effort. Objects are processed serially and require mental effort.
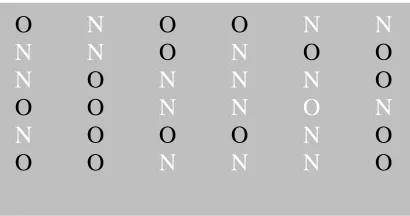
In visual search tasks a feature search is characterized by a target’s distinctiveness in a single feature from its distractors. Conjunction search targets are distinguished from distractors by a combination of features that form objects. Egeth and Yantis (1997) noted that both types of targets are also distinct from the background on which they are viewed. Figure 2 shows a feature search example. Figure 3 shows a conjunction search example.
Figure 2. Example of a feature search where the target, a white “O”, is on a gray background
and surrounded by black O and N distractors.
Figure 3. Example of a conjunction search where the target, a white “O”, is on a gray
background and surrounded by black O and white N distractors.
O N O O N N
N N O N O O
N O N N N O
O O N N O N
N O O O N O
O O N N N O
O N O O N N
N N O N O O
N O N N N O
O O N N O N
N O O O N O
Like automatic detection, visual attention is directed to features very quickly and is unaffected by increasing the number of distractors. Unlike automatic detection features do not require the extensive training required to achieve these effects on visual attention. Conversely, conjunctions require cognitive resources to direct visual attention to each stimulus so cognitive processes can interpret which features were combined to form the object and then compare the object target to the distractors in the surrounding area.
Conjunctions, therefore, affect visual attention in a manner similar to controlled search. In terms of understanding the consequences of compressing more and more visual information into a graphical display, the possible conclusions here are similar to those drawn from
Schneider and Shiffrin’s work. If the featural characteristics of the stimuli are able to operate on visual attention, the features will quickly capture one’s attention with negligible mental effort regardless of the amount of stimuli in the display. If features are unable to capture visual attention, the individual must direct his visual attention to the conjunctions in a serial manner, which is slow, effortful, and negatively affected by the amount of information in the display.
Location Pre-Cuing
Location pre-cuing is a method for investigating visual attention in which the participant is shown a visual stimulus that serves as a cue about where to direct one’s visual attention followed by the stimuli of the experimental task (e.g., a single target to be detected, a target whose characteristics must be reported, one or more targets that must be found in a field of distractors). The cue may be a valid or invalid indicator of the location of the target based on whether the cue focuses one’s attention on the same location as the target or on a location away from the target. In location pre-cuing studies of visual attention, some researchers have described the focusing of attention like a spotlight (Posner, Snyder, & Davidson, 1980; Posner & Petersen, 1990) or a zoom lens (Eriksen & St. James, 1986). In the spotlight metaphor the size of the area on which one’s visual attention can be focused is fixed and small. In the zoom lens metaphor one’s focus of visual attention can change in size but once it is zoomed in it behaves much like the spotlight. It has been argued that
information inside the narrow spotlight or zoomed-in lens is processed more quickly or more efficiently, whereas outside the spotlight information is processed less (Posner & Petersen, 1990), differently (Crick, 1984), or not at all (Luck & Hillyard, 1994).
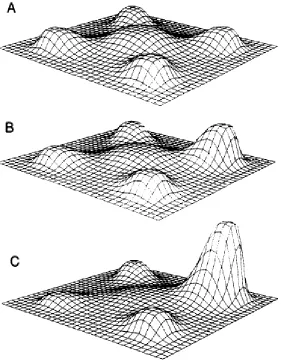
Gradient metaphors of visual attention have been proposed in response to inconsistent spotlight findings. Gradient metaphors describe visual attention as processing visual
change in peak height indicates the movement of information processing across one’s visual field with higher peaks indicating that more visual information is being processed at that location.
Figure 4. Hypothetical representation of the change in distribution of information processing in a location pre-cuing study of visual attention at time points A, B, and C.
consequence to understanding is the effect of where one’s visual attention is focused, which increases information processing at the location of focal attention and decreases information processing at the point farthest from that location.
Thus far, a review of the literature has presented findings based on tasks where the underlying meaning of the stimuli is irrelevant to the task. In other words, it is not necessary for participants to use the meaning of the stimuli, the quantitative value of the symbol 1 for example, to detect its presence or report on its orientation in the display. As suggested earlier, there is a qualitative difference between understanding graphically presented data and simply searching for or detecting visual stimuli. In a bar graph the amount of space a bar takes up and its spatial relationship to other bars in the graph provides critical information about the underlying data. The bar’s height is a direct representation of its quantitative value such that a bar that is twice as tall as another represents a value that is twice as large. The next section will discuss the role of graphical representations on visual attention and, accordingly, understanding and performance.
Graphical Representations
will have varying degrees of relevance to weather-prediction tasks. According to Lowe, “there is in fact no necessary relationship between the perceptual properties of [weather symbols] and their meteorological importance. Indeed, it is often the case that relatively inconspicuous aspects of a meteorological pattern are highly significant indicators of the likely weather conditions in a specific region” (p. 167). The question for the present study then is whether compressing large amounts of quantitative data into a graphical form affects one’s ability to accurately interpret the underlying meaning of the symbols (e.g., the values represented by bars in a bar graph).
The effect of particular visual stimuli on understanding was demonstrated in Lowe’s study. Participants in the experimental group were given software that animated the weather map changes. The control group did not have access to the software but rather were shown a static image of a weather map. The experimental group performed better at predicting weather pattern changes compared to controls; however the superiority of the experimental group’s predictions was not comprehensive. Rather, only certain patterns were predicted with greater accuracy. When the stimuli had high visual salience (e.g., the correct pattern had pronounced changes in position), prediction accuracy was high. Conversely, when the cue had low visual salience (e.g., animation of the correct pattern was brief), predictions had low accuracy. Lowe concluded that subjects demonstrated both selective attention to
perceptually salient stimuli and neglect of stimuli with low perceptual salience, regardless of relevance to the task.
characteristics of the stimuli more visually salient than others, their underlying meaning may be applied more directly in performing the task; regardless of their true relevance.
Summary
Visual information processing can be either slow and cognitively demanding or quick and cognitively effortless. One component of visual information processing is visual
attention. Kahneman (1973) defined visual attention as a set of control mechanisms for assigning significance to visual stimuli. Slow and effortful processing is a result of an individual’s sequential allocation of visual attention and is negatively affected by an increase in the number of stimuli in a display. Quick and undemanding processing is a result of visual attention being spontaneously captured by some characteristic of a stimulus that is unaffected by increasing the number of stimuli in a display. The sequential allocation or spontaneous capture of visual attention can both aid and hinder performance, depending on where visual attention is focused.
When visual attention is focused on task-relevant areas of a display, performance is enhanced. Conversely, when visual attention is focused on task-irrelevant areas,
performance is impaired. If a stimulus spontaneously captures one’s visual attention, it may act like a visual cue. Some stimuli are graphical stand-ins for other constructs, like
quantitative values, and if they act like a cue they can cause an individual to apply the underlying values to the task at hand, regardless of their actual applicability.
performance. If the cue directs visual attention to task-relevant or task-irrelevant information performance will be positively or negatively affected, respectively.
The Present Study
With the ever increasing production of digital data, being able to interpret quantitative data may increase the need for better data visualizations and techniques for understanding the underlying values. Directing one’s attention to task-relevant stimuli or locations via cues is a powerful strategy for enhancing understanding, but little is known about the effectiveness of different types of cues in the context of graph comprehension. The present study sought to investigate the effect of visual cues on visual attention in a novel graph-reading task.
Hypotheses
Visual cues were expected to improve accuracy and decrease response time on a novel graph-reading task; i.e., visual arithmetic. Spatial location of the mean (bottom-, middle-, or top-third of the Y-axis) was expected to have increasing error sizes as the means moved from bottom- to top-third due the increasing number of possible incorrect locations from bottom to top. In other words, assuming participants would not mark the mean as being spatially located above the highest bar in the graph, there are 32 possible incorrect locations in the bottom-third, 65 in the middle-third, and 99 in the top-third.
H1: Participants in the visual cue conditions will be more accurate than those in the no visual cue condition.
H3: Errors for means spatially located in the top-third of the Y-axis will be larger than errors for means in the middle-third of the Y-axis which will both be larger than errors for means in the bottom-third of the Y-axis.
H4: There will be no effect of spatial location of the mean on response times. Method
Participants
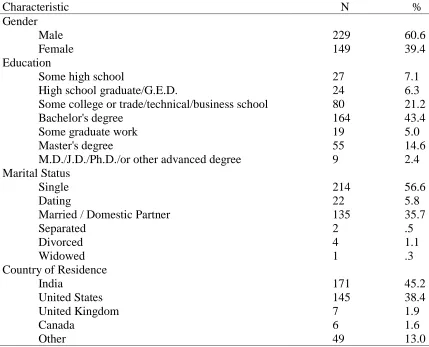
Three hundred seventy-eight participants (see Table 1 for demographics) were
recruited via Amazon’s Mechanical Turk workforce marketplace website (www.mturk.com). A number of studies have successfully used Mechanical Turk Workers as participants to collect research data from psychology experiments (Colowick & Pool, 2007; Kaisser, Hearst, & Lowe, 2008; Kittur, Chi, & Suh, 2008; Behrend, Sharek, Meade & Wiebe, 2011). The present study was advertised as a single Human Intelligence Task (HIT) and participants were compensated $0.60 for their participation.
Participants were randomly assigned to one of seven visual cue conditions: no cue (N=53), central block (N=55), central rectangle (N=54), central gradient (N=54), peripheral bars (N=54), peripheral brackets (N=54), or peripheral gradients (N=54).
Given that the participants were performing the study in non-laboratory environments, it was concluded that trials with long response times were due to factors unrelated to the study. Table 1.
Demographics of Mechanical Turk Participants
Characteristic N %
Gender Male Female 229 149 60.6 39.4 Education
Some high school
High school graduate/G.E.D.
Some college or trade/technical/business school Bachelor's degree
Some graduate work Master's degree
M.D./J.D./Ph.D./or other advanced degree
27 24 80 164 19 55 9 7.1 6.3 21.2 43.4 5.0 14.6 2.4 Marital Status Single Dating
Married / Domestic Partner Separated Divorced Widowed 214 22 135 2 4 1 56.6 5.8 35.7 .5 1.1 .3 Country of Residence
India United States United Kingdom Canada Other 171 145 7 6 49 45.2 38.4 1.9 1.6 13.0
Note. For participant age, M = 30.72 (SD = 9.54) years. Apparatus
experimental trials and distributing the debriefing document. Participants located around the world used computers in environments that were local to each participant. These computers covered the range of possible hardware configurations (i.e., desktop to laptop, home-built to commercially manufactured) running the gamut of operating systems. Because of this potential variety of systems, the application also collected hardware and operating system information.
Materials
The spatial arithmetic task was adapted from Gillan (1995) such that each graph had 150 bars with values from 1 to 100. In order to emphasize the spatial characteristics of the task, the Y-axis was hidden from the participants’ bar graphs. There were 24 unique graphs whose mean values were spatially distributed along the vertical axis: 8 in the bottom-third of the y-axis, 8 in the middle-third, and 8 in the top-third (see Figure 5).
Figure 5. Illustration of the spatial locations of mean values for each of the 24 unique stimuli graphs. Eight graphs had means spatially located in the bottom-third of the Y-axis, 8 means
0 20 40 60 80 100
Graphs
Top Third
Middle Third
The 24 graphs were randomly sorted and repeated 3 times to make a total of 72 trials. All participants saw the same graphs in the same order. All but the control group saw graphs with visual cues indicating the third of the graph wherein the mean was spatially located. Visual cues were either centrally located behind the graph or peripherally located on either side of the graph. There were 3 centrally located cues (i.e., a solid block, a rectangle outline, and a gradient block) and 3 peripherally located cues (i.e., 2 solid bars, 2 square brackets, and 2 gradient bars). See Figures A1 to A7 in Appendix A for examples of each visual cue. Design
This study used a 7 x 3 (Visual Cue x Spatial Location of Mean) factorial design. The independent variables were Visual Cue (no cue, central block, central rectangle, central gradient, peripheral bars, peripheral brackets, and peripheral gradients) and Spatial Location of Mean (bottom-, middle-, and top-third of the graph). Visual Cue was a between-subjects factor and Spatial Location of Mean was a within-subject factor.
Procedure
The experiment was conducted online and took approximately thirty minutes to complete. Participants were asked to read and digitally sign an electronic informed consent document (see Appendix B) after which they completed a demographics questionnaire (see Appendix C), 2 twelve-item mental rotation tasks (Peters, Laeng, Latham, Jackson,
Zaiyouna, & Richardson (1995), and a vocabulary test (Shipley, 1986). Participants were then randomly assigned to a visual cue condition and given an explanation of how, using a visual arithmetic technique, to spatially determine the mean of values displayed in a bar graph (see Appendix D).
After reading the visual arithmetic explanation participants completed two sets of practice trials separated by a 15 second break. Neither set used visual cues. Practice trials were designed to introduce participants to the interface and to the task of spatial arithmetic. In the practice trials, participants were shown two sets of graphs; the first set had 5 graphs and the second set had 20 graphs. In the first set, participants were instructed (see Appendix E) to move a horizontal line up and down in search of the graph’s mean. When the
Upon completing the second set of practice trials, participants were given a 15 second break and taken to the study trials. In the study trials, participants were presented with seventy-two graphs. Participants marked their answers by first clicking on a graph, which placed a horizontal line on the graph, and then used the mouse to move the line up or down until it was in the desired location. At the end of the study trials, participants completed an exit interview questionnaire (see Appendix H), were given a link to a debriefing document that they could download (see Appendix I), and were approved for payment through the Mechanical Turk website.
Results
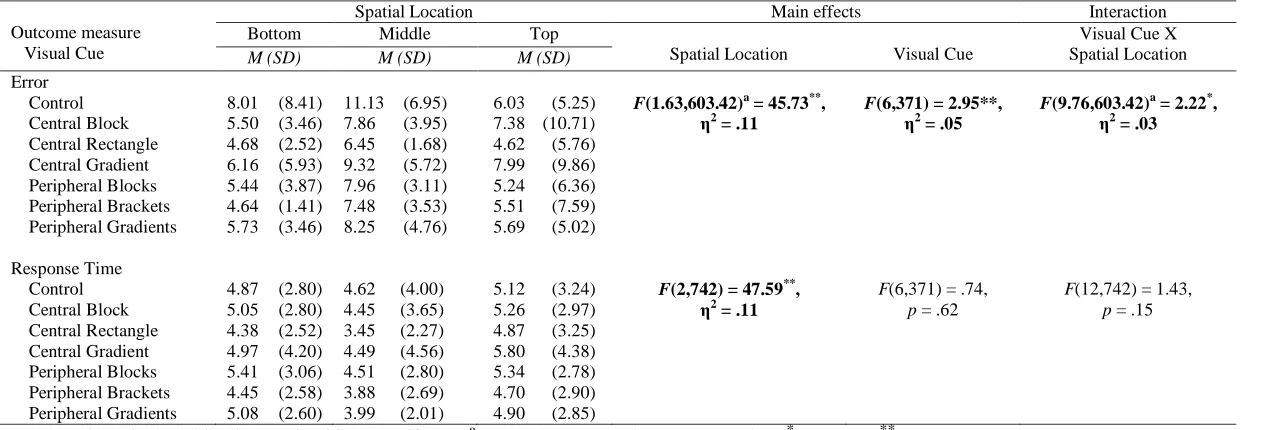
Errors and response times were analyzed using simple mixed design ANOVAs. Table 2 summarizes the main and interaction effects for both outcome measures. Error was
calculated as the absolute value of deviation from the correct spatial location. For example, if the graph’s mean was 90 and the participant’s line was placed at 74, the error value would be: ABS(90-74) = 16. Or if the graph’s mean was 16 and the participant’s line was placed at 32, the error value would be: ABS(16-32) = 16. Response time was recorded in milliseconds and converted to seconds.
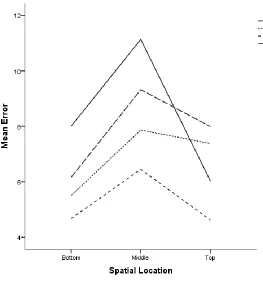
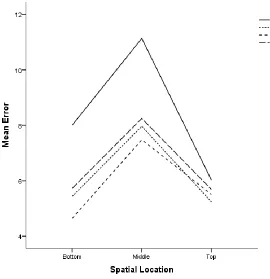
larger than top-third errors in the control, peripheral bars, and peripheral gradient conditions. Middle-third errors were no different than top-third errors in the central block, central
rectangle, central gradient, and peripheral brackets conditions. Simple effects analysis of
visual cue on errors indicated errors in the control condition were significantly larger than central rectangle and peripheral brackets conditions in the bottom-third and significantly larger than all other conditions, except the central gradient condition, in the middle-third. In the top-third, there were no significant differences between any of the visual cue conditions. For response time, only the spatial location main effect was significant. Neither the visual cue main effect nor the Visual Cue x Spatial Location interaction effect was
significant. Participants took significantly longer determining means that were spatially located in the top-third (M = 5.14, SE= .17) of the graphs than those in the bottom-third (M = 4.89, SE= .15) followed by response times to determine the mean of middle-third (M = 4.20,
Table 2.
Effects Summary for the Spatial Location and Visual Cue Mixed-Design ANOVAs
Outcome measure Visual Cue
Spatial Location Main effects Interaction
Bottom Middle Top
Spatial Location Visual Cue
Visual Cue X Spatial Location
M (SD) M (SD) M (SD)
Error Control Central Block Central Rectangle Central Gradient Peripheral Blocks Peripheral Brackets Peripheral Gradients Response Time Control Central Block Central Rectangle Central Gradient Peripheral Blocks Peripheral Brackets Peripheral Gradients
8.01 (8.41) 5.50 (3.46) 4.68 (2.52) 6.16 (5.93) 5.44 (3.87) 4.64 (1.41) 5.73 (3.46)
4.87 (2.80) 5.05 (2.80) 4.38 (2.52) 4.97 (4.20) 5.41 (3.06) 4.45 (2.58) 5.08 (2.60)
11.13 (6.95) 7.86 (3.95) 6.45 (1.68) 9.32 (5.72) 7.96 (3.11) 7.48 (3.53) 8.25 (4.76)
4.62 (4.00) 4.45 (3.65) 3.45 (2.27) 4.49 (4.56) 4.51 (2.80) 3.88 (2.69) 3.99 (2.01)
6.03 (5.25) 7.38 (10.71) 4.62 (5.76) 7.99 (9.86) 5.24 (6.36) 5.51 (7.59) 5.69 (5.02)
5.12 (3.24) 5.26 (2.97) 4.87 (3.25) 5.80 (4.38) 5.34 (2.78) 4.70 (2.90) 4.90 (2.85)
F(1.63,603.42)a = 45.73**, η2
= .11
F(2,742) = 47.59**,
η2
= .11
F(6,371) = 2.95**, η2
= .05
F(6,371) = .74,
p = .62
F(9.76,603.42)a = 2.22*, η2
= .03
F(12,742) = 1.43,
p = .15
Figure8. Graph of response times in each of the 3 spatial locations. Response times are reported in seconds.
Discussion
behind an already visually dense graph may have been too much information to process. This conclusion can find support in the higher accuracy of the central rectangle in the top-third of the graph, which was a simple outline, over the control condition. This conclusion can also find support in the higher accuracy of all the peripheral cues in all 3 spatial locations over the control group.
H2 was not supported by the data as there was no significant effect of visual cue on response time. H3 was not supported as means that were spatially located in the middle-third of the graph had significantly higher errors than means in the bottom- and top-thirds. H4 was also not supported as there was a significant main effect of spatial location on response time that found participants spent significantly less time estimating the mean when it was in the middle of the graph. The significant main effect of spatial location on response time may account for the unsupported H2 and H3 hypotheses. These may be a result of a systemic translation of “find the mean” to “find the middle” thereby misleading the participants to act
quickly in the middle third and more thoughtfully in the bottom- and top-thirds. This thoughtful attention in the bottom- and top-thirds of the graph thereby led to fewer errors. Implications
A theoretical implication of the use of visual cues to direct visual attention to task-relevant areas in a graph comprehension task is that cues improve performance but do not appear to have an effect on response times.
of a bar graph, it may be necessary to also teach students that mean does not necessarily mean middle and that the middle of a graph still has a range of possible mean locations.
A second practical implication is related to teaching mathematics in general. It has been shown that expert mathematicians think visually. Novice mathematicians may well benefit from learning mathematics using a spatial metaphor and visual cues should improve their performance.
Future Research
Generally, the supported results of visual cues aiding in graph comprehension using the novel, visual arithmetic technique was encouraging. Additional research is needed to investigate the causes of the increased error and decreased response times for estimating means spatially located in the middle-third of a graph.
Future research could also examine the role of visual cues in branches of mathematics with an extensive symbol system whose spatial characteristics are integral to problem
References
Behrend, T. S., Sharek, D. J., Meade, A. W., & Wiebe, E. N. (2011). The viability of crowdsourcing for survey research. Behavior Research Methods, 1-14.
Cheal, M.L., Lyon, D.R., & Gottlob, L.R. (1994). A framework for understanding the allocation of attention in location-precued discrimination. Quarterly Journal of Experimental Psychology, 43A, 825-857.
Colowick, S.M & Pool, J. (2007). Disambiguating for the web: a test of two methods.
Proceedings of the 4th international conference on Knowledge capture (K-CAP '07), Derek Sleeman and Ken Barker (Eds.). New York, NY: ACM.
Crick, F. (1984) Function of the thalamic reticular complex: The Searchlight Hypothesis.
Proceedings of the National Academy of Sciences of the USA, 81, 4586-4590.
Egeth, H. E., & Yantis, S. (1997). Visual attention: Control, representation, and time course.
Annual Review of Psychology, 48, 269-297.
Eriksen, C. W., & St. James, J. D. (1986). Visual attention within and around the field of focal attention: A zoom lens model. Perception & Psychophysics, 40, 225–240. Gillan, D. J. (1995). Visual arithmetic, computational graphics, and the spatial
metaphor. Human Factors, 37, 766–780.
Kahneman, D. (1973). Attention and effort. Englewood Cliffs, NJ: Prentice Hall.
Kittur, A., Chi, E. H., & Suh, B. (2008). Crowdsourcing user studies with Mechanical Turk.
Proceedings of 26th SIGCHI Conference on Human factors in Computing Systems, 453–456.
Lowe, R. K. (2003). Animation and learning: selective processing of information in dynamic graphics. Learning and Instruction, 13, 247–262.
Luck, S. J., & Hillyard, S. A. (1994). Spatial filtering during visual search: Evidence from human electrophysiology. Journal of Experimental Psychology: Human Perception and Performance, 20, 1000-1014.
Luong, M. G., & McLaughlin, A. C. (2009). Bar graphs and small screens: Mitigating cognitive load in mobile visualizations. Proceedings of the Human Factors and Ergonomics Society 53rd Annual Meeting. Santa Monica, CA: Human Factors and Ergonomics Society.
McCandless, D. (2010, August). David McCandless: The beauty of data visualization [Video file].Retrieved from
http://www.ted.com/talks/david_mccandless_the_beauty_of_data_visualization.html Paas, F. G. W. C., & Van Merriënboer, J. J. G. (1994). Instructional control of cognitive load
in the training of complex cognitive tasks. Educational Psychology Review, 6, 351-371.
Posner, M.I., & Petersen, S.E., 1990. The attention system of the human brain. Annual ReviewNeuroscience, 13, 25 – 42.
Posner, M. I., Snyder, C. R., & Davidson, B. J. (1980). Attention and the detection of signals.
Journal of Experimental Psychology: General, 109(2), 160-174.
Schmidt, R. A., & Bjork, R. A. (1992). New conceptualizations of practice: Common principles in three paradigms suggest new concepts for training. Psychological Science, 3, 207-217.
Schneider, W., & Shiffrin, R. (1977). Controlled and automatic human information processing: I. Detection, search, and attention. Psychological Review, 84(1), 1-66. Spoehr, K. T., & Lehmkuhle, S.W. (1982). Visual information processing. San Francisco:
W.H. Freeman.
Shipley, W. C. (1986). Shipley Institute of Living Scale. Los Angeles: Western Psychological Services.
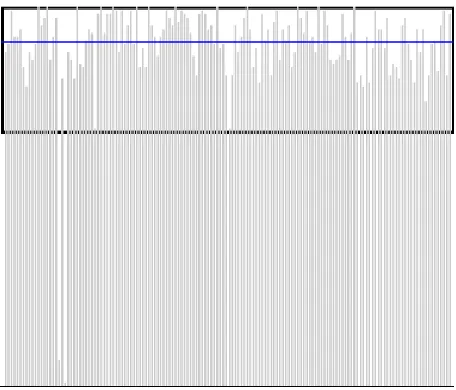
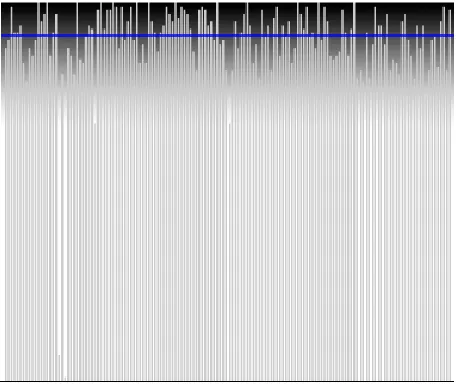
Appendix A
The following figures are screen captures of Trial 1. The mean of the 150 bar values in this graph was 90. The blue horizontal lines were placed by the participants and indicate their estimate of the spatial location of this graph’s mean. These figures were selected at random for inclusion herein.
Figure A2. Image of a Central Block group participant’s graph. This participant’s line was recorded at 72.11.
Figure A4. Image of a Central Gradient group participant’s graph. This participant’s line was recorded at 91.44.
Figure A6. Image of a Peripheral Brackets group participant’s graph. This participant’s line was recorded at 80.98.
Appendix B
North Carolina State University
INFORMED CONSENT FORM for ONLINE RESEARCH Title of Study
Learning a Novel, Visuospatial Task
Principal Investigator Experimenter
Dr. Anne McLaughlin Mary Luong
What are some general things you should know about research studies?
You are being asked to take part in a research study. Your participation in this study is voluntary. You have the right to be a part of this study, to choose not to participate or to stop participating at any time without penalty. The purpose of research studies is to gain a better understanding of a certain topic or issue. You are not guaranteed any personal benefits from being in a study. Research studies also may pose risks to those that participate. In this
consent form you will find specific details about the research in which you are being asked to participate. If you do not understand something in this form it is your right to ask the
researcher for clarification or more information. A copy of this consent form will be provided to you. If at any time you have questions about your participation, do not hesitate to contact the researcher(s) named above.
What is the purpose of this study?
To assess how people learn a new skill using graphical data. What will happen if you take part in the study?
If you agree to participate in this study, you will be asked to:
1. Be shown how to visually determine the mean of data presented in a bar graph. 2. Practice visually determining the mean of data presented in a bar graph.
3. Mark the mathematical mean of bar graphs using your mouse.
4. Complete a vocabulary test, a mental rotation test, and a demographics questionnaire. This session will run approximately 30 minutes, with periodic breaks.
Risks
Benefits You will receive $0.80 for participating in this study.
Confidentiality
The information in the study records will be kept strictly confidential. Data will be stored securely in locked cabinet in a locked lab. No reference will be made in oral or written reports that could link you to the study.
As per our Institutional Review Board's strict experimental guidelines (http://www.ncsu.edu/sparcs/irb/), all information is completely anonymous.
Compensation
For participating in this study you will receive $0.80. If you withdraw from the study prior to its completion, you will not receive any compensation.
What if you have questions about this study?
If you have questions at any time about the study or the procedures, you may contact the researcher, Dr. Anne McLaughlin, at (919) 513-2709.
What if you have questions about your rights as a research participant?
If you feel you have not been treated according to the descriptions in this form, or your rights as a participant in research have been violated during the course of this project, you may contact Deb Paxton, Regulatory Compliance Administrator, Box 7514, NCSU Campus 4514), or Carol Mickelson, IRB Coordinator, Box 7514, NCSU Campus (919/515-7515).
Consent To Participate
Appendix C
Demographics Questionnaire Items
Birth Month, Day, Year
Gender
Education (Check highest level completed) o Some high school
o High school graduate / G.E.D.
o Some college, or trade, technical, business school o Bachelor’s degree
o Some graduate work o Master’s degreee
o M.D., J.D., Ph.D., or other advanced degree
Current marital status (Check one) o Single
o Married / Domestic Partner o Separated
o Divorced o Widowed
o Other (Please specify )
Race / Ethnicity (Check all that apply) o Black / African American
o Asian American / Pacific Islander o White / Caucasian
o Hispanic / Latino
o American Indian / Alaskan Native
o Other (Please specify )
Occupational status (Check all that apply) o Working full time
o Working part time o Student
o Homemaker o Retired
o Volunteer worker
o Seeking employment, laid off o Leave of absence / sabbatical
Appendix D
Visual Arithmetic Explanation
Appendix E
Practice Trial Instructions, Set 1 In this section you will see (5) bar graphs.
Your task is to CLICK on the graph and slowly slide the line that appears up and down until you FIND THE GRAPH's MEAN.
**When you see the message indicating the mean's location, click on the graph again to LOCK THE LINE ONTO THE GRAPH.
NOTE WHERE THE MEAN IS IN RELATION TO THE HEIGHT OF THE BARS. In future graphs, you will have to find the mean.
After you have locked the line, a [Next] button will appear. Click the [Next] button to take you to the next graph.
Appendix F
Practice Trial Instructions, Set 2 In this section you will see (20) bar graphs.
Your task is to CLICK on the graph and slide the line up and down to the location you've determined is WITHIN 5% OF THE GRAPH'S MEAN. Click on the graph again to lock the line onto the graph. A message will appear indicating whether or not you are within the 5% accuracy range.
When you've correctly extrapolated the mean, a [Next] button will appear. Click the [Next] button to take you to the next graph.
Appendix G
Screen Capture of Practice Trial Feedback
Figure G1. Feedback on a graph (not to scale) from the first set of practice trials.
Appendix H Exit Interview Items
In the figure below, which line represents the mean?
o 1 o 4
o 2 o 5
o 3 o 6
In the study you just completed, where were most of the means located? o Top third of the graph
o Middle third of the graph o Bottom third of the graph o Equally in all thirds
o Only in the top and middle thirds o Only in the top and bottom thirds o Only in the bottom and middle thirds
On the scale below, please rate your math skills.
| | |
Excellent Average Poor
On the scale below, please rate your reading skills.
| | |
Excellent Average Poor
Complete the following sentence: Using visual arithmetic, I spatially determined the mean of values displayed in a bar graph by
Appendix I Debriefing Information
Thank you very much for participating in this experiment. We could not conduct our research without your help. This study was designed to examine what type of visual cue is best for the task you did. Some of the people in the study saw a high-contrast cue indicating the approximate location of the graph’s mean. Others saw a line that demarcated the
approximate location of the mean. And still others saw no cue.
You also completed several ability tests: the vocabulary test and a few mental rotation tests. We are interested in determining whether individuals need different kinds of visual cues to learn a novel, visuospatial task. For example, perhaps people with high verbal skills use certain visual cues better than others.
The results of this study may provide direction and potential guidelines for presentation of visuospatial information, like graphs, in media and education. Again, we would like to thank you for your participation. If you have any questions about the study or any suggestions, please do not hesitate to contact one of the directors of the project: