Automated Network Debugging Tool For
Offline and Online Debugging of Optical
Networks
Achala G, Vikram Seshasai
PG Scholor, Dept of Telecommunication, RVCE , Bengaluru, India
PE- PV Tejas Networks, Bengaluru, India
ABSTRACT:Telecom networks are deployed in a large area and consist of diverse elements which have to work together to ensure that the network is up and running all the time. In order to achieve the same, debugging of the problems should be quick and accurate. Debugging of problems seen in the network can be done in multiple ways, either offline or online. Offline debugging involves collecting data from a network element and then trying to reconstruct the sequence of events so that a clue towards the problem can be obtained. Online debugging involves interacting with the network element when the problem is present and trying to extract information from the network element during the problem. Automated way of analyzing the data which is collected is described in this paper. The analysis provides an insight into the issue seen in the network and also helps in predicting whether there are any hidden issues in the device which can be pro-actively taken note of and subsequent preventive maintenance done to prevent the issue from happening in the future. The tool developed provides a web based interactive UI which is deployed in a network management server and work alongside the same.
KEYWORDS: Energy Automatic debugging; Online and Offline Debugging; Visualization; Element Management
System; Network Management System; MPLS-TP; TDM; PTN; Network Element; QoS; ERPS.
I. INTRODUCTION
Components of network at high level are software and hardware. Each category can be further broken into other smaller sub categories. It is required to understand these 2 categories before debugging network. Main aim of the debugging is to find out the root cause and find solution to it. In OSI model layers 1 to 3 have close association with hardware, operating systems and layers 4 to 7 have close association with application.
Companies which work on optical domain designs and manufactures telecom multiplexers/de-multiplexers which are used extensively in the mobile and enterprise networks which are deployed by service providers in world. Telecom service providers have deployed large networks, and these are susceptible to issues which need to be resolved on time to ensure that customer expectations are met.
There are two kinds of debugging which can be done, online and offline. Online debugging includes, collecting data from an affected network element and then analyzing the data to provide an insight into the conditions which caused the problem and probable root cause of the issue. Online debugging includes running active scripts on the affected node and collecting data. The intent is to try and debug an issue when it is live and collect as much live data as possible so that the root cause analysis can be faster.
Online debugging involves the application connecting to the node which is suspected to have a problem and running diagnostic tests or scripts which would possibly debug the issue live. A possible root cause analysis is done in live mode which also gives the user and the support personnel as idea about where the problem could possibly be reside.
The web UI is developed as a web application which is installed along with the network management system and which is available as an additional application apart from the network management system. The web UI is built over the Java servlets framework and employ the latest web technologies to provide a seamless interface to the user.
Network allows exchange of information over certain protocols. Network binds independent computing platforms together to form a distributed computing network. Each end point should have an network hardware such as Gigabit Ethernet Port, SDH port, PDH Port etc. Ports are connected to outside network using cables. Switch is connected to other end of the cable and it is connected to other hosts also which form star topology at the physical layer.
Understanding the hardware is also required since sometimes problems may occur in this area also. Hardware devices are mechanically sensitive and any kind of damage may interrupt the functionality. These may not be immediately visible to end user but shows error in application layer. Hardware problem may be caused because of Ethernet cable slipped out of its port receptacle due to broken latch, one of the wires came loose due to a bad crimp, or the cable was plugged into a wrong port. Possible causes for network problems in Physical layer are broken or improper cabling or terminations, high signal degradation, not sufficient cable bandwidth and interference from other medium. In Network Layer possible causes for network problem are networking devices which are damaged, incorrect or sub-optimal device configurations, authentication and association issues, and insufficient network bandwidth. Possible causes for network problems in switches and VLANs are excessive utilization of the devices or incorrectly assigned VLAN membership or Traffic priority (CoS/QoS) issues etc.
II. RELATED WORK
Diagnosis can be done in 2 different ways. One is diagnosis as sensemaking and another one is automatic diagnosis. Sensemaking diagnosis can be with the help of ones experience in network field. For example if there is a problem in sending a message to other computer this leads administrator to check the connecting or incoming and outgoing packets. In real time tracking backward for the problem becomes very tedious and cannot handle manually.
So there are much research work going on in the field of automatic debugging. This uses lower level to higher level diagnosis. Variable level diagnosis includes finding out memory usage, CPU usage, Node capacity etc. Component level diagnosis includes component status checking. Edge level diagnosis includes checking any interface problems between source and target machine. Network level diagnosis includes searching entire network to find out the culprits.
Pattern generation and validation-pattern matching are required for mining telecom system logs to facilitate debugging[1]. An automated and systematic approach called ATPG(Automated Test Packet Generation) is used for testing and debugging networks where minimum set of packets are generated by the model to test every link in the network or to test the rules in the network links[2]. NetClinic is another debugging tool designed using both concepts of sensemaking and automatic diagnosis [3]. Visualization features makes the user easy understand faults in lower as well as higher levels.
Live Action tool also gives the visualization of live traffic of network which also examines for historical views. .Diagnosis is done at individual component level using this tool. NetBrain enterprise edition developed tool for network debug which includes managing routers, firewalls etc. Main features of NetBrain tool are Network mapping, Network data-visual search, Deep Network discovery includes L2/L3 devices, Documentation which is automated, Visual troubleshooting.
III. SYSTEM MODEL
Node in optical communication domain is a communication point which has got many slot and slots are filled by the cards. Card is an interfacing media which is used to connect devices. Different cards will have different functionalities. Card is designed by ASIC designers. Mainly there are 3 typesof cards. They are:
Controller Cards: These cards are used for Configuration and Switching. It also controls the entire node.
Tributary Cards: These cards are used for sending Traffic.
Intelligent Cards: These cards are used for Switching traffic.
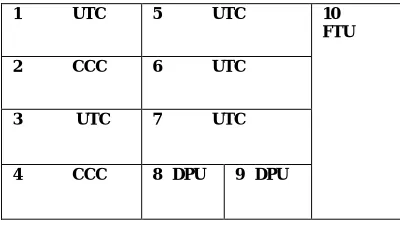
Controller and Intelligent cards have their own processor. Tributary cards do not have their own processor. Tributary cards support L1 traffic (SDH, PDH), L2 mix with L1 (EOS) and L2 traffic(Ethernet). Cross connect or Service are connections which connect either 2L1 or 2L2 ports and enable sending traffic between them. Each node power unit for the power supply and fan tray unit to maintain the temperature. Simple node view which has UTC (universal tributary card) and CCC (cross connect card) is as shown in the Fig 1.
Fig 1: Simple Node View
Hardware settings are difficult to setup so a node software simulator is developed which actually mirrors the behavior of the hardware in which computer is equivalent to the telecommunication system. Advantage od the node software simulator are :
The behavior of the actual hardware is mirrored in the software to a great extent.
Telecommunication network testing, monitoring can be done using the node software simulator.
It is connected to EMS server and planning for a network can be done.
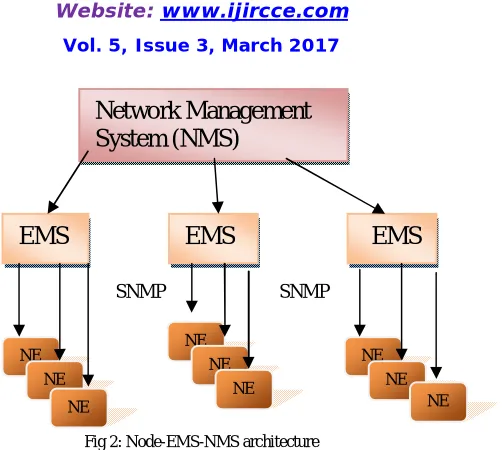
It is also used for testing the many customer scenarios. A network management system is a combination of both hardware and software which is used to monitor and administer a network. It refers to the maintenance and administration of large scale computer networks at the higher level. The set of functions required for controlling, planning, allocating, deploying, coordinating and monitoring the resources of a network including performing functions such as fault management, configuration management, accounting management, performance management, security management and bandwidth management are executed using NMS. Every network elements (NE) in the network communicates with their respective EMS. Each EMS has specific NEs which communicate with the higher level NMS that provide integrated multivendor network management. Architecture is as shown in the fig 2. NMS will not have complete information about the NEs but EMS is exposed to complete management information content of all the NEs in its domain. So EMS is the mediator between NMS and NEs and also takes the control of the NEs to the Network Management Layer.
1 UTC 5 UTC 10
FTU
2 CCC 6 UTC
3 UTC 7 UTC
Fig 2: Node-EMS-NMS architecture
Each NE is managed individually by the user using EMS, but does not manage communication between the NEs. Communication between NEs is managed by the network management system (NMS). Interfaces are used by the NEs to communicate and manage with EMS. Interfaces used to communicate between NMS and EMS. Common interfaces used are SNMP, TL1, CLI, XML, and CORBA. Presently we are using SNMP (Simple Network Management Protocol) in this architecture.
IV. DESIGNCONSIDERATIONSANDMETHODOLOGY
Offline debugging is done by getting debug file of a node from a node simulator. Node software simulator designed supports downloading debug file of a node.
A. Offline Debugging
Offline debugging involves following steps.
Search logs which includes searching master and slave card logs.
Check events: which includes all the operations like add or delete or modification in the configuration done in the node.
Looking for file system issues based on data collected from the debug data.
Collecting routing information and identifying the interfaces present on the system for routing.
Reading configuration files to find master/slave information, firmware version information, OSPF
configuration information, DCN byte information, NTP information, time zone, licensing information, card type for master XCC.
Reading information for current memory usage on the node, whether it is nearing threshold or not (on master
as well as slave).
Reading telecom bus information, possibly detect any duplication in the allocation.
Sanity, pragma check for node.db file.
Finding out the current software build and the previous build from where an upgrade has taken place.
CPLD/FPGA versions of cards present in the node.
node.db on slave card - Comparing and checking whether the configuration on master and slave is matching.
Slave card logs is also parsed to check for co-relation with issue time.
Crash analysis and presentation of the same.
Zarlink status from all dump.
Disk usage on master card, number of partitions and what is mounted and what is not.
Users created in the file system.
Routing table information - number of routes in the node.
Each node has node.db which is a sqlite file and information collected from a node.db file is listed below
Network Management
System (NMS)
EMS
EMS
EMS
NE NE
NE
NE NE
NE
NE NE
SNMP SNMP
- Number of SDH interfaces.
- Number of PDH interfaces.
- Number of Ethernet interfaces.
- Number of switching instances.
- Number of XCs - LO/HO.
- Number of VCGs - LO/HO.
- Radius enable/disable.
- Number of SNMP managers/Number of EMSes connected .
- Number of DCN channels/bytes used/OSPF parameters.
Other information(switching parameters) collected from a database file are Type of switching card (CE based or Vlan based), MiM address configured, Interfaces available (VCG/CEM), Interfaces used (UNI/NNI), SFP used (Opt/Electrical), Number of services configured on the node(.1q/.1ad/MPLS-TP), Number of ERPS Rings, Number of Tunnels(Protected/ Unprotected), Number of PWEs(Protected/ Unprotected), Number of IBWP.
B. Online Debugging
Online debugging is done by connecting to the live node and running script to dump data. In online debugging we considering following parameters.
Slave card presence if node is redundant and sanity check.
Disk usage and partitions on the node.
FPGA and CPLD versions for the cards present in the node.
NMS layer debugging and prediction.
Packet Transport Network level (L2) and TDM level debugging.
Bandwidth utilization on the current network based on NMS db. This is the provisioned bandwidth based on
the QoS on the trunks.
It also includes installing script in the node for running across every reboot, to either collect data or set registers as a workaround for an issue.
What if analysis: What if analysis is done for both node failure and link failure. Link failure analysis includes following steps:
Finding out services/tunnels passing through the link.
Segregating unprotected and protected services from the list.
Highlighting unprotected services which would go down due to the fault.
Node failure analysis includes following steps:
Identifying all the Transmission Links terminating on the node.
Identifying services/tunnels passing through the node.
Highlighting services which would be impacted due to the node failure.
Alarm and event analysis: Based on the historical alarm/event database on the NMS, the following co-relation is found. - Determining which entities are reporting the maximum number of alarms in a defined period of time, for
example last one month.
- Correlation is done to find out root cause of the alarms due equipment failures, link failure or due to external circumstances.
V. RESULTS AND CONCLUSION
UI is developed using PHP, TCL, JavaScript languages. Online debugging is done by directly connecting to a live node as shown in the screenshot below(Fig3).
Fig 3: Screenshot of UI developed for Online Debugging
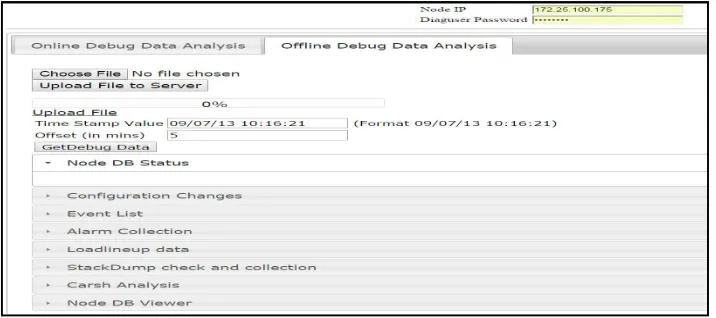
In online debugging current time gets updates in the UI. For the offline debugging the debug file is collected from a node simulator. The debug file collected will be in compressed format and contains all the information about a node. Debug file collected will be uploaded into UI and debugging is done for the specified time stamp. In offline mode tool developed gives Alarm information, Type of connection information, RAM usage, User information, logs of master and slave card, logs of changes made in a node, routing table information. For user given timestamp alarms present in the node , events occurred in the node, configuration changes are collected and displayed in the UI. Crash analysis and stack dump check information also displayed in the UI. Screenshot of offline debugging is as shown in the Fig 4.
VI. FUTURE SCOPE
Tool developed is limited certain user cases. It can be enhances to cover all global networking issues in future. Tool is not highly scalable. Automation done in terms of debugging reduces multiple level of debugging and multiple level of support. Collection data of live can be node done in faster way and reduces the time taken. Clean paths in the network is isolated and prompted to the customer so that can be tested for provisioning of new services if there are alternate paths in the network . In future based on the NMS and EMS databases for a network, information with regards to provisioning of a feature across the network can be collected in the form of reports. A few things which can be collected is given below.
J0 traces on different interfaces on each node.
TIM action on different interfaces.
Any other provisioning detail which is required to be queried across the network.
REFERENCES
1. Alf Larson, Abdelwahab Hamou-Lhadj, ‘Mining Telecom System Logs to Facilitate Debugging Tasks’, Software Maintenance (ICSM) 2013 29th IEEE International Conference, pp.536-539, Sept 2013.
2. Hongyi Zeng, Peyman Kazemian, George Varghese, Nick McKeown, ‘Automatic Test Packet Generation’, IEEE/ACM transactions on networking, ISSN 1063-6692, pp. 554-566,April 2014.
3. Zhicheng Liu, Bongshin Lee, Srikanth Kandula, Ratul Mahajan, ‘NetClinic: Interactive Visualization to Enhance Automated Fault Diagnosis in Enterprise Networks’, IEEE Symposium on Visual Analytics Science and Technology (VAST), pp.131-138, Oct. 2010.
4. Priyanka N, Achala G, Vikram Seshasai, G Shivarudrappa, ‘Bandwidth Planning tool for optical networks’, IEEE International Conference on Recent Trends in Electronics, Information & Communication Technology (RTEICT), pp.94-98, 2016.
5. G. Prasanna, B. Sai Kishore., G. K. Omprasad, K. Sathyanarayana Raju, R. Gowrishankar, K. Venkataramaniah, Ron Johnson, Pavan Voruganti, ‘Versatility of a colorless and directionless WSS based ROADM architecture’, Communication Systems and Networks and Workshops COMSNETS 2009. First International, pp. 1-8, 2009.
6. Alex Ferguson, Barry O'Sullivan, Daniel C. Kilper, ‘Transparent Path Length Optimized Optical Monitor Placement in Transparent Mesh Networks’, Optical Fiber communication/National Fiber Optic Engineers Conference OFC/NFOEC 2008, pp. 1-3, 2008.
7. S. Sajjan, A. Kulkarni, V. Seshasai and G. Sadashivappa, ‘Spice algorithm implementation for optical network analysis’, International Conference on Advances in Computing, Communications and Informatics (ICACCI),Kochi, pp. 582-587,2015.
8. S. I. Shahabade, V. Seshasai and G. Sadashivappa, ‘Optical multiplexer configuration management platform’, International Conference on Computation of Power, Energy, Information and Communication (ICCPEIC), pp. 0409-0413,2015.
BIOGRAPHY
Achala G received BE degree in Electronics and Communication from SJEC Mangaluru under Vishvesvaraya Technological University(VTU) Belgaum in 2012. Currently pursued Mtech degree in Digital Communication from RVCE Bengaluru under VTU Belgaum. She worked for ITC Infotech from 2012 to 2014 in the field of PLM. Also did her internship at Tejas Networks Bengaluru as part MTech degree. Her areas of interests are computer networks, optical communication.