adducts of the histidine-containing phosphocarrier protein (HPr) from Bacillus Subtilis
and two of its engineered mutants. (Under the direction of Charles R. Cornman)
Expression of recombinant HPr and its mutants HPrγ (S12Y, R17H, E84Y) and
HPrβ (S12Y, R17H) was performed in the Escherichia coli organism. The proteins were
purified via calmodulin affinity resin to yields of ~40 mg/L of culture. The native HPr
protein was shown to be active by mutant complementation assays, while the engineered
mutants HPrγ, and HPrβ were inactive to phosphotransfer reactivity. Mass spectroscopy
analyses verified the masses of the proteins relative to that predicted from the constructed
DNA sequences.
Iron-binding studies with HPrγ were designed to coordinate iron (III) ions in a
manner analogous to the metalloenzyme protocatechuate 3,4 dioxygenase. This mode of
coordination, however, was not observed with iron in our examination of HPRγ.
Alternate metal-binding studies with copper and manganese revealed that HPrγ, at
physiological pH values, does not form stable complexes with several transition metal
ions. The HPrβ mutant protein and, to a degree, native HPr , however, do show
transition metal-binding properties through UV-Vis and EPR spectroscopies.
A plausible cause for our inability to form an HPrγ-iron complex is the formation
of a hydrophobic pocket at pH = 8.0, between the engineered pairs of proximal histidine
and tyrosine residues of HPrγ. CD denaturation studies to examine this possibility
Phosphocarrier Protein from
Bacillus subtilis
by
Stephen Scott Ferguson
A dissertation submitted to the Graduate Faculty of
North Carolina State University
in partial fulfillment of the
requirements for the Degree of
Doctor of Philosophy
Chemistry
Raleigh
2000
APPROVED BY:
Charles R. Cornman______
Edmond F. Bowden
______
Biography
Stephen Scott Ferguson was born on August 27, 1970 in Chapel Hill, North
Carolina to Herbert and Lillie Ferguson. He was raised near Pittsboro, North Carolina.
In 1989, he graduated from Northwood High School in Chatham County, and that fall
enrolled at North Carolina State University. After struggling with tuition and classwork
for his first two years, he entered the Cooperative Education Program by taking a job at
the Chemical Testing Unit of the NC Department of Transportation. Through alternating
semesters of work and classwork, he excelled with a lightened workload (work no longer
necessary during academic semesters) and a fresh, practical outlook on chemistry. By his
senior year Stephen was showing an increasing desire to study the biological aspects of
chemistry, and in the Fall of 1994 began his graduate education at NCSU under professor
Charles R. Cornman. During his first two years, Stephen took coursework in
biotechnology, and excelled at teaching undergraduates as evidenced by winning three
teaching awards. Additionally, he was initiated into the Phi Lambda Upsilon Chemistry
Honor Society for outstanding academic performance. Upon successful completion of
his dissertation defense, Stephen will begin a postdoctoral position at the National
Institute of Environmental Sciences under Dr. Joyce Goldstein, where he will further his
Acknowledgments
Several people have been instrumental in the completion of this thesis-work. First of all, I want to acknowledge my advisor, Dr. Charles R. Cornman. His passion for the biological aspects of chemistry fueled my ambitions to learn and grow as a scientist. This research project was his baby, and he gave me the tools and insight to carry it out. He has been patient beyond reason, enthusiastic, and above all else a role model for me to better myself as a scientist and a person.
I would like to acknowledge Dr. Hosni Hassan. I first met him in a bioinorganic chemistry class, and the literature discussions we had opened my eyes to the fascinating world of oxygen, and left a lasting impression on me. The next fall, I came to him to ask for the temporary use of some laboratory space and equipment to conduct our biological experiments. Neither of us had any idea it would turn into a four-year stay. Dr. Hassan has always made time to answer my numerous questions and share his ideas. He has been a steadying in force in a sometimes-rocky world, and I truly thank him for his generosity.
I also want to thank several members of my research group and Dr.
Hassan’s group. Yvette Boyajian introduced me to Dr. Cornman, and has been an excellent example of how a graduate student should function. Her guidance both in classwork and research was more helpful than she will ever know. Thad Stauffer has been a good friend who always found time to listen and to offer
advice in the numerous obstacles in this research project. Jason Andrus has been a great friend who has helped me expand my knowledge and technical abilities in biological research, and has a contagious enthusiasm for science and philosophy. Donna Joyce-Gray has been a great friend who has always found time to listen to my research quandaries, and offer her opinions and ideas. Dr. Steven Bowen was very helpful by introducing me to the subcloning procedure that helped solve our biggest experimental obstacle. Yvette, Thad, Jason, Donna, and Steven have all been great coworkers and I thank all of them for their help with this research.
I definitely want to thank my parents Herbert and Lillie Ferguson, and my parents-in-law Richard and Lee Bradley. All four have been there for me through the good and bad times, and I love them dearly.
Table of Contents
LIST OF TABLES vii
LIST OF FIGURES viii
LIST OF ABBREVIATIONS x
1. INTRODUCTION 1
1.1 Metalloenzymes in biology 2
1.2 Metalloprotein design and synthesis 4
1.3 Hypothesis 6
1.4 Scope of this work 6
1.5 References 7
2. EXPERIMENTAL PROCEDURES
2.1 Supplies and materials 10
2.2 Equipment 13
2.3 PCR protocols 16
2.4 Enzymatic modification of DNA protocol 17
2.5 Agarose gel electrophoresis protocol 18
2.6 Transformation protocols 19
2.7 Plasmid Preparation protocols 20
2.8 Subcloning protocol 21
2.9 Colony screening protocol 21
2.10 DNA Sequencing 22
2.11 Reagents 22
2.12 Protein concentration assays 24
2.13 SDS-PAGE protocol 24
2.14 Protein expression protocol 26
2.15 Bacterial lysis protocols 26
2.16 Protein purification protocols 27
2.17 Metal-binding studies procedure 29
2.18 EPR protocol 29
2.19 Mutant Complementation assay procedure 29
2.20 MALDI-TOF MS preparation 30
2.21 CD preparations and protocols 30
2.22 References 30
3.1 Introduction 33
3.2 Phosphate-binding template 33
3.3 Selection of a target site 40
3.4 Re-design of HPr 46
3.5 Summary 58
3.6 References 59
4. GENE CONSTRUCTION & CLONING 60
4.1 Introduction 61
4.2 Native HPr gene preparation and cloning 61
4.3 HPrγ mutant gene preparation, subcloning, and cloning 74
4.4 HPrβ mutant gene construction and cloning 85
4.5 Summary 89
4.6 References 89
5. PROTEIN EXPRESSION, PURIFICATION, & CHARACTERISTICS 90
5.1 Introduction 91
5.2 Native HPr expression 92
5.3 HPr purification 94
5.4 HPr purification tag cleavage 101
5.5 HPrγ expression and purification 106
5.6 HPrβ expression and purification 110
5.7 CD studies at 280 nm 115
5.8 Activity studies 116
5.9 Summary 121
5.10 References 122
6. METAL BINDING STUDIES & ANALYSIS 123
6.1 Introduction 124
6.2 Qualitative iron additions 124
6.3 Iron binding studies monitored by UV-Vis and EPR spectroscopies 126 6.4 Alternative transition metal probes of HPr, HPrγ, and HPrβ 134
6.5 CD denaturation Studies 142
6.6 Summary 147
6.7 References 148
7. SUMMARY & CONCLUSIONS 149
7.1 Purpose of these studies 150
7.2 Target development and re-design 151
7.4 Protein Expression, Purification, and Characterization 153
7.5 Metal-Binding Studies of HPr and its mutants 155
List of Tables
Table 1-1 Naturally occurring metalloenzymes 2
Table 2-1 Chemicals used in these studies 10
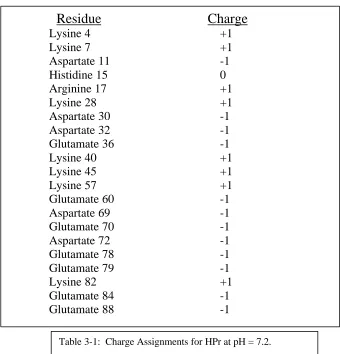
Table 3-1 Charge Assignments for HPr at pH = 7.2 for Molecular Modeling 49
List of Figures
Figure 3-1 Mechanism of the PEP-PTS 34
Figure 3-2 Ribbon diagram of HPr from B. Subtilis 37
Figure 3-3 Zoom of HPr binding pocket 38
Figure 3-4 PCD structure of the β subunit 41
Figure 3-5 PCD catalyzed chemical transformation 42
Figure 3-6 Active site zoom of PCD 43
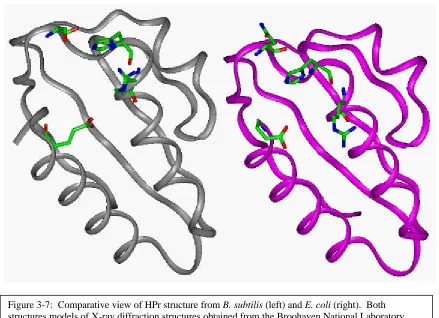
Figure 3-7 Comparison of E. coli and B. subtilis structures 47
Figure 3-8 Summary of the ESFF forcefield 50
Figure 3-9 Pre-post minimization of HPr in vacuo 52
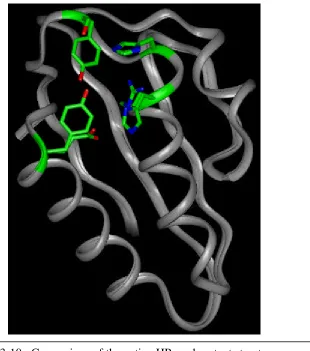
Figure 3-10 HPr vs. HPrγ pre-simulation 54
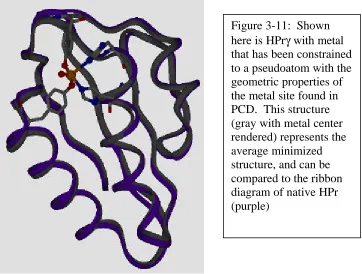
Figure 3-11 Post restrained minimization of HPrγ vs. native HPr 57
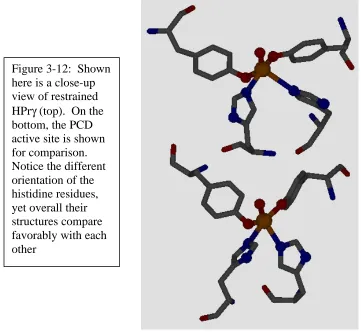
Figure 3-12 Zoomed in comparison of HPrγ-Fe vs. PCD active sites 58
Figure 4-1 pCal-n expression vector map 64
Figure 4-2 PCR primer design and binding scheme 65
Figure 4-3 Agarose gel of PCR reaction and pCal-n 65
Figure 4-4 Agarose gel of subcloning of early PCR products 67
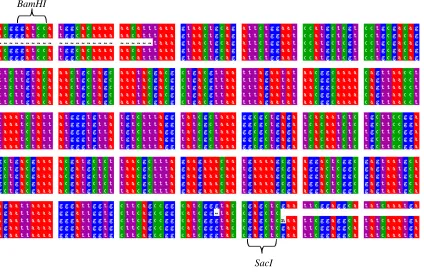
Figure 4-5 Sequence comparison showing bad primer binding 68 region
Figure 4-6 New PCR scheme design and primer binding 69
Figure 4-7 Agarose gel of new PCR product with Genosys primers 69
Figure 4-8 Agarose gel of pNoT subclones with new PCR product 70
Figure 4-9 Sequence comparison of pNoT subclones and PCR 71 product
Figure 4-10 Agarose gel of preparative insert and pCal-n digests 71
Figure 4-11 Agarose gel of prepared vector and insert for ligation 72
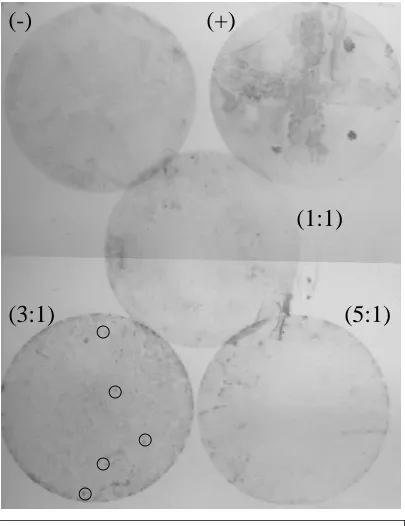
Figure 4-12 DIG colony hybridization screen chemiluminescent 74 film
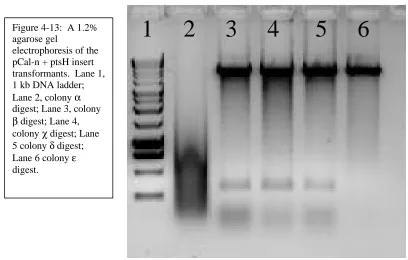
Figure 4-13 Agarose gel of pCal-n construct digests for insert 75
Figure 4-14 Sequence comparison of pCal-n clone and desired 76 sequence
Figure 4-15 Recombinant PCR generalized scheme 77
Figure 4-16 Recombinant PCR design for HPrγ preparation 78
Figure 4-17 Agarose gel of the α PCR reaction 79
Figure 4-18 Agarose gel of the β PCR reaction 79
Figure 4-19 Agarose gel of the α + β PCR reaction 80
Figure 4-20 Agarose gel of pNot subclones of the α + β PCR 81 product
Figure 4-21 Sequence analysis of the HPrγ gene in pNot 82
ligation
Figure 4-23 DIG probe of HPrγ in the pCal-n vector 84
Figure 4-24 Agarose gel of clones of pCal-n + HPrγ digestions 84
Figure 4-25 Sequence analysis of HPrγ in pCal-n 85
Figure 4-26 Design and primer binding of PCR of the HPrβ gene 86 construction
Figure 4-27 Agarose gel of the HPrβ PCR product 87
Figure 4-28 Agarose gel of digest of pNoT subclones of HPrβ 87
Figure 4-29 Sequence comparison of HPrβ gene in pNoT with 88 target sequence
Figure 4-30 Agarose gel of the pCal-n and HPrβ gene for ligation 89
Figure 4-31 Sequence comparison of HPrβ gene in pCal-n with 89 target sequence
Figure 5-1 Vector map of the pCal-n expression vector 92
Figure 5-2 SDS-PAGE analysis of an IPTG titration for HPr 94 expression
Figure 5-3 Schematic summary of the pCal-n protein purification 96 method
Figure 5-4 SDS-PAGE analysis of an HPr expression and 99 purification
Figure 5-5 UV-Vis spectrum of native HPr purified on large scale 100
Figure 5-6 SDS-PAGE analysis of an HPr purification and 103 thrombin digest
Figure 5-7 SDS-PAGE analysis of a time course thrombin digest 104 of HPr
Figure 5-8 MS spectrum of native HPr 105
Figure 5-9 MS spectrum of thrombin digested HPr 106
Figure 5-10 SDS-PAGE analysis of HPr vs. HPrγ purifications 108
Figure 5-11 MS spectrum of HPrγ 110
Figure 5-12 MS spectrum of a thrombin digest of HPrγ 110
Figure 5-13 SDS-PAGE analysis of HPr, HPrγ, and HPrβ 113 purifications
Figure 5-14 MS spectrum of HPrβ 114
Figure 5-15 MS spectrum of HPr combined with HPrβ 115
Figure 5-16 CD measurements of HPr vs. its mutants at 280 nm 117
Figure 5-17 Reactions involved in HPr’s mutant complementation 118 assay
Figure 5-18 Mutant complementation assays for native HPr 120
Figure 5-19 Mutant complementation assays for HPr vs. its mutants 121
Figure 6-1 UV-Vis spectra of iron (II) additions with vitamin C 128
Figure 6-3 EPR spectra of iron (III) additions at pH = 4.8 130
Figure 6-4 UV-Vis spectra of iron (II) additions at pH = 4.8 131
Figure 6-5 EPR spectra of iron (II) additions at pH =4.8 132
Figure 6-6 UV-Vis spectra of iron (II) additions at pH = 8.0 133
Figure 6-7 UV-Vis spectra of iron (II) additions at pH = 8.0 134
Figure 6-8 UV-Vis spectra of copper (II) additions at pH = 8.0 136
Figure 6-9 EPR spectra of copper (II) additions at pH = 8.0 137
Figure 6-10 UV-Vis spectra of copper (II) additions at pH = 4.8 138
Figure 6-11 Magnified UV-Vis spectra of copper (II) additions at 139 pH = 4.8
Figure 6-12 EPR spectra of copper (II) additions at pH = 4.8 141
Figure 6-13 CD spectra of HPr and its mutants 145
Table of Abbreviations
Chemical Abbreviations
Arg Arginine
Asp Asparagine
CABB Calcium binding buffer
CBP Calmodulin Binding Peptide
Cys Cysteine
Cu Copper
DIG Digoxigenin
DMG Dimethylglutaric acid
DNA Deoxyribonucleic acid
DTT Dithiothreitol
EB Elution buffer
E Escherichia
EDTA Ethylenediaminetetraacetic acid
EGTA Ethyleneglutaminetetracetic acid
Fe Iron
Glu Glutamate
His Histidine
HPr Histidine containing phosphocarrier
protein
HPrβ Mutant HPr S12Y, R17H
HPrγ Mutant HPr S12Y, R17H, E84Y
IPTG Isopropyl-1-thio-b-D-galactopyranoside
Mn Manganese
ONPG o-nitrophenyl-β-D-galactoside
PEP phosphoenolpyruvate
Ser Serine
SDS Sodium dodecyl sulfate
SDS-PAGE Sodium dodecyl sulfate poly acrylamide
Gel electrophoresis
Taq Thermus Aquaticus
g Gram
G Gauss
GHz Gigahertz
K Kelvin
M Molar
Mg Milligram
µg Microgram
min Minute
mL Milliliter
µL Microliter
mM Millimolar
µM Micromolar
mmol Millimoles
N Normal
nm nanometers
V Volts
W/w Weight by weight
V/v
Volume by volumeOther Abbreviations
A Absorbance
CD Circular Dichroism
EPR Electron Paramagnetic Resonance
NMR Nuclear Magnetic Resonance
T Temperature
ε Extinction coefficient
Chapter 1
1.1 Metalloenzymes in biology
From physical chemistry to microbiology, the study of proteins and their role in
life has been fundamental in discovering how nature has evolved its intricate systems of
checks and balances. Specialized proteins, enzymes are capable of catalytically
converting specific substrates to biologically useful products.
Metalloenzymes in particular carry out some of the most rapid and unique
transformations in biology. They differ from other enzymes in that covalently-bound
metal ions, or an incorporated metal-containing cofactor, play a key role in their structure
and reactivity. Table 1 shows a list of some naturally occurring metalloenzymes, the
identity of the covalently bound metal ion(s), and their function. This abbreviated list of
Metalloprotein Metal Reactivity
Catalase Fe-heme H2O2à 2H2O + O2
Cytochrome c Fe-heme e- transfer, cyt. C à cyt. C oxidase
Cytochrome c oxidase Fe-heme, Cu 2H+ + ½O2 + 2e- à H2O
Cu-Zn superoxide dismutase Cu, Zn 2O2- + 2H+à O2 + H2O2
Ferrodoxin Fe-S clusters Electron transfer reactions
Nitrogenase Fe-Mo, Fe-S clusters ½N2 + 3/2H2 à NH3
Oxygen evolving complex Mn cluster 2H2O à 4H+ + O2 +4e
-Protocatechuate 3,4 dioxygenase Fe Protocatechuate ring cleavage
Ribonucleotide reductase Binuclear Fe center RibonucletideàDeoxyribonucleotid
Tyrosinase Binuclear Cu Phenolic substrates à Catecholates
Xanthine oxidase Fe-S, Mo-pterin Xanthine à Uric Acid
some of the more widely studied metalloenzymes shows the structural and functional
diversity found in these catalysts. Nitrogenase, for example, fixes nitrogen from
atmospheric N2 at ambient temperature and pressure, while industrially this reaction
requires high temperature (300-500 oC) and pressure (> 300 atm) to overcome the sizeable activation energy. Nitrogenase utilizes both iron and molybdenum containing
metal clusters as incorporated cofactors to afford the enzyme its remarkable redox
properties, and catalytic ability.
Copper-Zinc Superoxide Dismutase is another example of the unique redox
properties that can be found in metalloenzymes. This enzyme is crucial to aerobic
organisms because it rapidly converts the highly reactive superoxide ion to hydrogen
peroxide and water, and in concert with catalase, protects life from the consequences of
living in an O2 atmosphere. Unlike Nitrogenase, Cu-Zn SOD binds two transition metal
ions directly to the protein amino acids, and not in a cofactor cluster. Both enzymes,
however, can rapidly and specifically carry out the chemistry they have evolved to
catalyze. The diversity observed in metalloenzymes is spectacular, and exploring their
structure and function will allow us to harness their potential.
An attractive idea that has great technological potential is the preparation of
“designer enzymes” capable of performing specific transformations. To this end,
researchers have studied the reactivity and physical properties of enzymes to elucidate
how they perform such highly specific and rapid transformations. Towards the ultimate goal of preparing “designer metalloenzymes,” research efforts have successfully utilized
organisms, to generate catalytic antibodies that facilitate specific transformations.1 In general, however, it is difficult to design proteins. At present we are not capable of
predicting protein structure based solely on sequence information.2 Furthermore, our ability to strategically incorporate metal ions within the protein scaffold is in its infancy,3 thus hindering our ability to create “designer metalloenzymes.” In the following sections,
I will describe examples of metalloproteins that have been produced and how our
research will further expand this field.
1.2 METALLOPROTEIN DESIGN AND SYNTHESIS
Research on metalloprotein design and synthesis is an emerging field of protein
chemistry. A simple “his tag” is now a standard method of protein purification in which
a poly-histidine peptide is incorporated adjacent to a protein terminus. Subsequently
passage over a Ni2+ affinity column is used to purify the target protein.4
Peptide synthesis has been utilized to create specific protein sequences and study
the incorporation of metal ions into these small protein molecules.5 Zinc finger-type peptides have been frequently reported due to their small size and predictable secondary
structure.6 These zinc finger domains, are naturally occurring proteins, with conserved amino acids that have been shown to specifically bind and modulate nucleic acid
structures in the presence of zinc ions. Synthetic peptides, derived from this sequence,
have also been made by incorporating non-natural metal binding ligands and studying
Larger peptides based on de novo design have also been synthesized in which
metal ions are bound by natural and/or modified amino acid residues within α-helix
bundles.8 As with the zinc finger sequence, conserved residues are found in peptide helical structures, and re-design of these sequences in locations that are not essential to
the helical structure allows substitution with non-natural amino acid derivatives. Protein
engineering, based on these protein structures, has lead to the self-assembly of these
protein helices into bundles, formed by strategic incorporation of hydrophilic residues
and hydrophobic residues on directed faces of the helical structure. Thus, strategic
incorporation of metal-binding derivatives on these known bundle structures can provide
a probe of the protein structure, and the potential to study metal-protein, and metal-metal
interactions on the structure of a designer protein.
Sollazzo and coworkers have created a zinc binding site within a “minibody”
structure analogous to a portion of an antibody VH domain.9 This type of engineering is
similar to the peptide synthesis approaches in that a conserved segment of antibody
structure is re-designed. However, the sequence modifications in this study are made in
vivo via gene transcription/translation of an antibody fragment, engineered to bind zinc
via a short peptide loop in two proximal domains of the minibody structure.
Metalloprotein design has often utilized pre-existing clefts within a protein of
known structure. Studies by Lu and coworkers have produced both Cu and Mn
containing metalloproteins, which display similar physical properties to naturally
by Lu and coworkers produced metal-binding proteins that have physical characteristics
analogous to metalloenzymes, however their function was not defined.
Hellinga and coworkers have developed the molecular modeling program
“Dezymer” that searches three-dimensional protein structures for geometric clefts
suitable for metal incorporation.11 This approach represents a more general approach to metal incorporation by searching an entire protein structure for suitable clefts for metal
coordination. Utilizing this program, Caradonna and coworkers have prepared a cuboidal
Fe4-S4 site, and a Fe-histidine site within thioredoxin mutants.12 In addition, Hellinga and
coworkers subsequently prepared a tetrahedral blue copper site and a tetrahedral Fe-S4
site within thioredoxin mutants.13 However, this approach of searching for the best three-dimensional space for metal-binding is limited, at the very least, by the number of
proteins that have been structurally characterized.
Our research efforts attempt to contribute to in this emerging field through the
development of a novel approach to metalloprotein design.
1.3 HYPOTHESIS
We hypothesize that phosphate-binding sites represent a structural motif that can
be readily converted to form a metal-binding site. If successful, this will provide a more
general method for incorporating metals into proteins due to the ubiquity of
phosphate-binding sites in nature. It also focuses design efforts on a more specific set of templates,
1.4 SCOPE OF THIS RESEARCH
We will test the “phosphate-to-metal binding site” hypothesis by attempting to
prepare a known metal binding site (the target) using a phosphate-binding site as the
scaffold. The experimental details of this work are presented in Chapter 2. Chapter 3
details the criteria we have used for choosing a target metalloenzyme site and the
phosphate-binding protein to be converted into the target. The genetic manipulations
used to convert the scaffold into the target are discussed in Chapter 4. We will discuss
the steps taken to create the constructs of both native and mutant proteins, and provide
results showing the success of these methods. The expression of these genetic constructs
to provide the proteins is presented in Chapter 5. Chapter 6 focuses on the inorganic
aspects of these research efforts. Here we will explore the ability of our mutant proteins
to coordinate metal ions in a manner analogous to the target metalloprotein. Chapter 7
summarizes the results and draws conclusions regarding the correctness of our hypothesis
and the potential for this approach in the preparation of designer metalloenzymes.
1.5 References
1
Schultz, P. G.; Lerner, R. A. Acc. Chem. Res, 1993, 26, 391-395.
2
Smith, C.K.; Regan, L. Acc. Chem. Res.1997, 30, 153-161.
3
Regan, L. Trends Biochem. Sci.1995, 20, 280-284.
4
Hengen, P. N. Trends Biochem. Sci.1995, 20, 285-286.
5
Cheng, R. P.; Fisher, S. L.,; Imperiali, B. J. Am. Chem. Soc.1996, 118, 11349-11356.
6
Struthers, M. D.; Cheng, R. P.; Imperiali, B. J. Am. Chem. Soc.1996, 118, 3073-3081.
7
Cheng, R. P.; Fisher, S. L.; Imperiali, B. J. Am. Chem. Soc.1996, 118, 11349-11356.
8
Mutz, M. W.; Case, M. A.; Wishart, J. F.; Ghadiri, M. R.; McLendon, G. L. J. Am. Chem. Soc.1999, 121, 858-859.
9
10
Hay, M.; Richards, J. H.; Lu, Y. Proc. Natl. Acad. Sci.1996, 93, 461-464. Yeung, B. K.; Wang, X.; Sigman, J. A.; Petillo, P. A.; Lu, Y. Chem. & Bio.1997, 4, 215-221.
11
Hellinga, H. W.; and Richards, F. M. J. Mol. Biol.1991, 222, 763-785.
12
Pinto, A. L.; Hellinga, H. W., and Caradonna, J. P. Proc Natl. Acad. Sci.1997, 94, 5562-5567. Coldren, C. D., Hellinga, H. W., and Caradonna, J. P. Proc Natl. Acad. Sci. 1997, 94, 6635-6640.
13
Chapter 2
2.1 SUPPLIES AND MATERIALS
The reagents and materials are listed in Table 2-1
Table 2-1: Reagents, materials, and suppliers
Name Suppliers
Acetone Fisher
Acetonitrile (HPLC Grade) Fisher
Acrylamide Fisher
Agar, McConkey Difco
Agarose Fisher
Ammonium Acetate Fisher
Ammonium Chloride Fisher
Ammonium Persulfate Fisher
ampicillin Fisher
Ascorbic Acid Sigma
BamHI Boehringer Mannheim
Bis-Acrylamide Fisher
Brilliant Blue Coomasie G-250 Fisher
Bromophenol Blue Fisher
Calcium Chloride Sigma
Catechol Sigma
Centriprep-10 Amicon
Centricon-10 Amicon
Chloramphenicol Sigma
Chloroform Fisher
CM Sephadex C-25 Sigma
Copper Sulfate Fisher
D2O Cambridge Laboratories
Dialysis Tubing (Snakeskin) 10,000 MWCO Acros
Dialysis Tubing (Cellulose) 10,000 MWCO Fisher
2,2-Dimethyl Glutaric Acid Acros
DIG® Starter Kit Boehringer Mannheim
DNA Ligase Boehringer Mannheim
DNA Molecular Weight Markers Promega
dNTP’s Promega
Dithiothreitol Sigma
Ethidium Bromide Fisher
E. coli (BL21-(DE3)) Novagen
Table 2-1 cont…
E. coli (XL1-Blue-tetR) Hassan Lab
EcoRI Boehringer Mannheim
Ethylene diamine tetraacetic acid Sigma
Ethylene glutamine tetraacetic acid Sigma
Ethyl Alcohol Fisher
Ferric Chloride Fisher
Ferrous Sulfate Fisher
Filters (sterilization) Millipore
Filters (Qualitative #3) Fisher
Glacial Acetic Acid Fisher
Glucose Fisher
Glycerol Sigma
HEPES Buffer Sigma
HindIII Boehringer Mannheim
Hydrochloric Acid Fisher
IPTG Fisher
Kanamycin Sulfate Sigma
Magnesium Acetate Sigma
Maleic Acid Sigma
Magnesium Chloride Promega
Manganese (II) Chloride Fisher
2-Mercaptoethanol Sigma
Methanol Sigma
Mineral Oil Sigma
Nde I Boehringer Mannheim
Oligonucleotides Genosys
o-nitrophenyl-β-D-galactopyranoside Sigma
Ovine serum albumin Sigma
pCal-n expression system Stratagene
pET-9a Novagen
pGem-3Z Promega
pGem-T Promega
p-nitrophenyl phosphate Eastman Kodak
pNotA/T7 PCR Cloning System 5-prime 3-prime
Phenol (biological grade) Fisher
phenylmethylsulfonylfluoride Sigma
Phosphoenolpyruvate Sigma
Polyethylene Glycol Sigma
Table 2-1 cont…
Potassium Permanganate Sigma
2-Proponal Fisher
Protein Molecular Weight markers Promega, BIO-RAD
Proteinase K Sigma
Protocatechuate Sigma
Qiaex II gel purification system Qiagen
Qiaprep plasmid purification system Qiagen
Qiaquick purification system Qiagen
RNAse One Promega
Sac I Boehringer Mannheim
Sca I Promega
Sma I Stratagene
SSP I Stratagene
Sephadex G-50, G-100 Sigma
Shrimp Alkaline Phosphatase Boehringer Mannheim
Sodium Acetate Fisher
Sodium azide Sigma
Sodium Carbonate Fisher
Sodium Chloride Fisher
Sodium Cyanide Fisher
Sodium Dithiothionite Matheson
Sodium dodecylsulfate Fisher
Sodium Ethylene Diamine Tetraacetic Acid Fisher
Sodium Hydroxide Fisher
Sulfuric Acid Fisher
Taq DNA polymerase Boehringer Mannheim
TEMED Fisher
Tetracycline (HCl) Fisher
Thiamine (HCl) Sigma
Tris Base Fisher
Tris (HCl) Fisher
Trypsin Sigma
Tryptone Fisher
Tween-20 Sigma
Urea Fisher
X-gal Fisher
2.2 Equipment
Molecular Modeling procedures were performed on a Silicon Graphics
Workstation in the Biochemistry Department at NCSU in the laboratory of Dr. Paul
Agris. Visualization and modeling procedures were carried out with Molecular
Simulations InsightII modeling software package utilizing its builder, biopolymer,
discover and discover3 modules.
Agarose gel electrophoresis analysis of DNA fragments was performed on a
Fisher Biotech FB-SB-710 mini-horizontal unit purchased from Fisher Scientific. The
power supply was an E-C 105 model purchased from E-C Apparatus Corporation.
Sodium Dodecyl-Sulfate Polyacrylamide Gel Electrophoresis (SDS-PAGE) was
performed on an E-C 120 mini-vertical gel box purchased from Fisher Scientific. All
gels were run under denaturing conditions (in SDS). The E-C 105 power supply
provided the voltage potential, and was typically maintained at a constant current of 30
mA for 45-90 minutes.
Gel documentation was performed with a camera and computer interface
purchased from UVP. The software for capturing and saving the gel images was the
Laboratory Imaging and Analysis System from UVP. This software also assisted in the
quantitation of image intensities for concentration comparisons and counted bacterial
colonies on solid media placed in petri-dishes.
Polymerase Chain Reactions (PCRs) and other reactions requiring temperature
tube sample holding block and a heated lid. For PCR reactions, no oil was applied, and
samples retained > 97% of their volume throughout a 30 cycle reaction.
Centrifugations were performed with an Eppendorf 5417R, 5417C, or 5415C unit
for samples of 2.0 mL or less. For larger samples, a Sorvall RC-5B centrifuge with the
SS-34, GSA, or GS3 rotors was utilized, typically run between 4 oC and 15oC.
Incubators utilized to grow bacterial cultures include: New Brunswick Scientific
Co. Byrotory Water Bath Shaker, Queue Radial Shaker model 4730, Thelco 5DG
Scientific Incubator. Typical shaking and growth experiments were performed at 125
rpm and 37 oC.
Shakers utilized for a variety of experiments included: Red Rotor PR70 shaker
from Hoeffer Scientific Instruments, and Lab-Line Orbit 3527 shaker. Rocking
procedures were performed on a Red Rocker PR50 rocker from Hoeffer Scientific
Instruments.
The optical density of cultures was measured at 600 nm using a Novaspec model
4049 spectrophotometer in 0.8 mL cuvettes.
DNA quantitation using absorbance measurements at 260nm of (50 µl samples)
was performed on a Caryspectrometer equipped with a micro cuvette holder. Estimates were made by either comparison with known concentration standards, or via estimation
with the value of (50 ng DNA/(mL)). Both methods gave concentration values within 40
Protein chromatography was performed using a Bio-RAD Fraction Collector
4500D utilizing its drop counting mode of sample collection. Two different collection
racks (5 cm and 10 cm) were used depending on the desired fraction size.
Ultraviolet-visible spectroscopy was performed on a Hewlett-Packard 8452A
Diode Array spectrophotometer in a UV transparent 1.0 mL cuvette with pathlength of 10
mm. Spectra were taken in the general scanning mode, utilizing water or buffer as blank
samples, and the region between 800 nm and 820 nm was set at the reference absorbance
of 0.0 for all metal addition experiments.
Electron spin resonance (ESR) spectroscopy was performed using an IBM
ER200D instrument operating at X-band (ν ~ 9.45 GHz). Microwave frequency was
measure with a Hewlett Packard 5350B frequency counter and the field at g = 2.0037 was
calibrated with DPPH. Spectra at 77K were acquired using a quartz finger Dewar and
cylindrical quartz sample tubes. Typical spectra were the average of five scans taken at
rate of 100 seconds per scan.
Circular Dichroism measurements were made on a JASCO J600
spectrophotometer with a 10 mm cuvette. The temperature profiles were generated with
an Isotemptemperature controller. Data were collected between 250 nm and 200 nm for
each temperature.
Vanadium NMR was performed on a General Electric Omega300 NMR
instrument equipped with a 10 mm broad band probe and sample tube. Typical scans
gain between 1000 and 3000, and obtaining ~10,000 scans per spectrum. Spectra were
referenced to external VOCl3 and the baseline was corrected by subtraction of a blank.
2.3 Polymerase chain reaction protocols are as follows:
A. To a 0.5 mL thin-walled microcentrifuge tube were added, 1 ng of template
DNA, 10 µl of 10 mM primers (upstream and downstream), 10 µl of 10X Taq
buffer, 2 µl of 5 µM dNTPs, and deionized water to a make a final reaction
volume of 99 µl.
B. The reaction was placed in the thermocycler and the “hot start” cycle was
initiated as follows: template and primer denaturation at 99oC for 10 minutes, annealing of primers to template at Tm (typically 55oC) for 1 minute, then
movement to the optimal temperature for Taq DNA polymerase activity at 72oC for 1 minute.
C. At the initiation of the 72oC step, the program is held until all samples have been
treated with 1 µl of Taq DNA polymerase. This minimizes the polymerase
degradation during the initial 10 minute denaturation step. This completes the
“hot start” cycle.
D. Twenty-five to thirty cycles are performed with 1 minute denaturations at 93 oC (the lower denaturation temperature minimizes the activity loss of the Taq
enzyme), followed by equilibration at Tm for 1minute, and finally extension at 72 o
E. After completion of the last cycle, the reaction was cooled to 4 oC for storage and subsequent analysis.
2.4 Enzymatic Modification of DNA Protocols
A. Restriction endonuclease digestion were typically performed by combination of
1-5 µg of DNA to be cleaved, 2 µL of 10X digest buffer, deionized water to a
final reaction volume of 18 or 19 mL (depending on single or double digest), and
finally 1 µL of restriction endonuclease (1µL of each if a double digest). The
reaction was placed in a 37oC water bath for 2 –16 hours, depending on the star activity (non-specific cleavage activity) of the enzyme. Reactions are then
cooled to 4oC for storage and subsequent characterization.
B. Vector DNA dephosphorylation was accomplished as follows: 1-5 µg of
digested, purified vector DNA (see below), 1 µL of 10X dephosphorylation
buffer, and water to a final volume of 9 µL were combined, and treated with 1 µL
of shrimp alkaline phosphatase. The reaction is run for 30 minutes at room
temperature, and cooled to 4oC for storage and subsequent analysis. Prior to dephosphorylation, cleaved vector was prepared by purification with the
Qiaquick system or the QiaexII system (described in section 2.7 C and D).
C. Ligations of vector and insert DNAs were performed using a variety of methods.
The following description illustrates a typical set of reactions. Vector-to-insert
molar ratios of 1:1, 1:3, and 1:5 were utilized to optimize our conditions for
cut, dephosphorylated vector, 1 equivalent of insert DNA (for a 300 bp insert, we
would apply 5.3 ng), 1 µL of 10X ligation buffer, water to a final volume of 9 µl,
and followed by addition after the 1st annealing step of 1 µL of T4 DNA ligase.
After incubation at 17 oC for ~16 hours, the sample was cooled to 4oC for storage and subsequent analysis and/or transformation.
2.5 Agarose Gel Electrophoresis
Agarose gel electrophoresis was performed on all of the above DNA
manipulations. Typical experiments employed a constant voltage of
approximately 75 V, with typical currents produced near 30 mA, for 30-45
minutes. Both Tris-Borate-EDTA and Tris-Acetate-EDTA buffers were utilized
as conductive electrolytes at pH = 7.0 (typical) under standard concentrations.
Agarose gels were stained with ethidium bromide and the intercalated
fluorophore was exposed to UV light from a UVP (Ultra-Violet Products®)
transilluminator. Typical gel setup and analysis was performed as follows. First,
a 1% solution of agarose in gel buffer (TAE) is made to a final volume of 50 mL.
This solution was placed in a microwave oven for 3 minutes to heat the water
and melt the agarose. This solution was cooled to approximately 40 oC, and 2 mL of 0.1 % ethidium bromide was added, mixed thoroughly, then placed in the
gel box along with a 10 well comb, and allowed to solidify and cool to room
temperature. Once solid, the gel was submerged in approximately 200 mL of
then placed on the gel box. The DNA begins to migrate toward the anode
through the gel matrix, which differentiates the DNA fragments by size.
Comparison with a molecular weight marker was used to estimate fragment
sizes.
2.6 DNA Transformation Protocols
A. Preparation of competent E. coli cells using CaCl2 was achieved in a manner
analogous to the method described in Current Protocols in Molecular Biology.1 Typical preparations were performed as follows. First, bacterial cultures of the
desired strain were grown overnight, then subcultured into 100 mL of fresh
media. This culture was shaken and incubated at 37oC for 3-4 hours until the cultures optical density at 600 nm is between 0.3 and 0.5 absorbance units. The
culture was then immediately chilled on ice for 30 minutes. After centrifugation
at 5,000xG for 10 minutes, the supernatant was removed and discarded, and the
wet paste was resuspended in 10 mL of sterile 0.1 M CaCl2 and equilibrated for
30 minutes. This process was repeated once more, and the final pellet was
resuspended in 1.0 mL of a solution of 0.1 M CaCl2 and 40 % glycerol. Aliquots
were placed in sterile 1.5 mL microcentrifuge tubes for transformation.
The transformation protocol is as follows: target DNA (100 ng) was
added to the prepared cells and chilled for 30 minutes on ice. The mixture was
fresh media, cooling on ice, and recovery at 37 oC for 45 minutes. The cells were then ready to be plated out on selective media.
B. Preparation of competent E. coli cells by electroporation followed the procedure
in Current Protocols in Molecular Biology with minor changes.2 A culture of the desired stain was grown overnight, and subcultured into 1 L of fresh media. At a
culture density of OD600 from 0.3-0.6, the bacteria were placed on ice and
cooled for 30 minutes. The cells were centrifuged at 3000xG for 10 minutes and
resuspended in 500 mL of fresh, sterile water. This process was repeated twice
to lower the ionic strength of the bacterial solution, and the final pellet was
resuspended in 10 mL of water. These cells were aliquoted into 1.5 mL tubes,
for electroporation or were frozen for future usage.
DNA was added to the prepared cell aliquots, and gently mixed. The
solution was placed in an electroporation cuvette, and a voltage of 2.5 Vwas
applied to open small pores in the bacterial cell walls, thereby allowing the target
DNA to migrate into the cells. One mL of sterile media was immediately added
to the cells, and they are allowed to recover at 37oC for 30 minutes before plating out on selective media.
2.7 Plasmid Purification Protocols
A. Qiagen mini-prep kits were used to isolate plasmid DNA from cultures derived
with the kit included, culture sizes, centrifugation times and speeds, and elution
conditions.3
B. Qiagen midi-prep kits were utilized to prepare large quantities of DNA using the
recommended protocol provided.4
C. Qiagen PCR-prep kits were utilized to purify PCR product DNA from the other
reaction components with modified elution conditions.5
D. QiaexII gel purification kits were used to purify DNA from agarose gel slices
with some modification to the drying and elution steps.6
2.8 PCR products were subcloned into pNoTA/T7 using the supplier’s instructions
without modification.7
2.9 DIG colony hybridization screening of putative clones used the following
procedure.8
A. The first step in the DIG technique is the generation of the DNA probe by
denaturing the template DNA and then adding 4 µL of the DIG High Prime
reagent and incubating the reaction at 37 oC overnight. This usually resulted in
> 1 µg of probe DNA.
B. Nylon membranes were placed on the test and control plates for 1-2 minutes, and
marked for orientation and plate identification. The membranes were treated for
10-15 minutes each in glass dishes containing wetted 3M Whatman paper soaked
C. DNA control spots were placed on the membranes, and the membrane was
crosslinked with UV light for 2 minutes. Proteinase K was added to the
membranes and incubated for 1 hour at 37oC. Then the cellular debris was removed from the membranes with wet Whatman paper by pressing down and
rolling a reagent bottle over a stack comprising of aluminum foil, Whatman
paper, membrane, Whatman paper, and aluminum foil (from bottom to top).
D. The clean membranes were sealed in a bag with 10 mL of hybridization solution
containing denatured probe DNA and shaken at 65oC overnight. E. Detection of the DNA-bound using the supplier’s instructions with one
modification. The DIG substrate was added to the membranes, sealed in a water
tight bag, and then incubated at 37 oC for 1 hour. Subsequently, the chemiluminescent film was placed above the bag, and exposed overnight.
2.10 DNA sequencing was performed at either the North Carolina State University DNA
Sequencing Facility, or at the Iowa State University DNA Sequencing Facility, “In
house” primers appropriate for the vector DNA sequence from each facility were
used unless otherwise indicated.
2.11 Reagent solutions
A. Media
All media utilized in these studies were Lauria-Broth (LB) solutions containing
These solutions were autoclaved for 30 minutes to 1 hour and cooled to 37 oC prior to addition of antibiotics.
B. Buffers
Several buffer solutions were utilized during these experiments.
CABB400: 2 mM CaCl2, 50 mM Tris-HCl, 400 mM NaCl brought to a pH = 8.0
EB400: 2 mM EGTA, 50 mM Tris-HCl, 400 mM NaCl brought to a pH = 8.0
Tris Dialysis Buffer: 20 mM Tris-HCl, 20 mM NaCl brought to a pH = 8.0
HEPES Dialysis Buffer: 20 mM HEPES, 20 mM NaCl brought to a pH = 8.0
DMG Dialysis Buffer: 20 mM DMG 20 mM NaCl brought to a pH = 8.0
Acetate Dialysis Buffer: 20 mM NaC2H3O2, 20 mM NaCl brought to pH = 4.8
Thrombin Digest Buffer: 2.5 mM CaCl2, 20 mM Tris-HCl, 50 mM NaCl brought
to a pH = 8.0
Phosphate Buffer: 20 mM Na2PO4, 20 mM NaCl brought to pH = 8.0
C. Metal solutions
Iron (III): 10 mM iron (III) chloride dissolved in 0.1 M HCl
Iron (II): 10 mM iron (II) sulfate in deionized water
Copper (II): 10 mM copper (II) sulfate in water
Manganese (II): 10 mM manganese (II) nitrate in water
Vanadium (IV): 10 mM vanadyl sulfate in water
Vanadium (V): 10 mM sodium orthovanadate in water for 1 week
PCA: 5 mM 3,4 dihidroxybenzoic acid in appropriate buffer
K3Fe(CN)6: 10 mM K3Fe(CN)6 in water
H2O2: 10 mM hydrogen peroxide in water
BME: β-mercaptoethanol added directly into from pure stock as needed
DTT: sodium dithiothreitol stock at 100 mM in water
2.12 Protein concentration determination
A. Biuret assays were performed as described in Protein Methods without further
modification.9
B. Hartree-Lowry assays were performed as described in Current Protocols in
Protein Science.10
C. A280 measurements were performed on an HP 8542 diode array spectrometer, and
were used to determine protein concentrations of pure protein samples for which
the E280 was known or determined. For HPr ε = 0.71 (mg/mL), HPrγε = 0.81
(mg/mL), and for HPrβε = 0.77 (mg/mL).
2.13 SDS-PAGE analyses were accomplished using a three gel method designed for
examining small proteins and performed as follows:
1. Solutions of acrylamide stock (48% acrylamide/1.5% bisacrylamide), gel
buffer (3 M Tris, 0.3% SDS pH=8.45), 80% glycerol, 10% APS and
2. The resolving gel and spacing gels were simultaneously prepared as follows:
The resolving gel was prepared with 5.0 m/mL of acrylamide stock, 5.0 mL
of gel buffer, 2.5 mL of deionized water, 2.5 mL of glycerol solution, 75 µL
of APS, and 7.5 µL of TEMED. The spacing gel contains 1.25 mL of
acrylamide stock, 2.0 mL of gel buffer, 2.75 mL of deionized water, 0 mL of
glycerol solution, 30 µL of APS, and 3.0 µL of TEMED.
3. Approximately 4 mL of resolving gel is poured between clean, dry glass
plates, followed by about 0.75 mL of spacing gel prepared solution. A thin
(50 µL) layer was applied to the top of the spacing gel to create a smooth
interface, and the gels are allowed to polymerize.
4. The stacking gel is then prepared with 1.0 mL of acrylamide stock, 3.1 mL
of gel buffer, 8.4 mL of deionized water, 0 mL of glycerol solution, 100 µL
of APS, and 10 µL of TEMED. This solution is poured onto the solidified
spacing gel, and a 10 well comb (typical) is inserted.
Once solidified, the gel was placed into the EC 120 apparatus and a voltage is
applied to deliver a constant current of approximately 30 mA. Upon completion of
the electrophoresis run, the gels were removed and stained with R-250 Coomassie
Blue Staining solution (50% MeOH, 10% HC2H3O2, and 0.25% R-250) for 1 hour.
Destaining in 10% MeOH and 5% HC2H3O2 was performed overnight to remove
unbound Coomasie stain, and the gel was photographed under a white light source
2.14 Protein expression of native and mutant proteins was typically initiated by
inoculation of 10 ml of LB/Amp (50 µg/ml) media with 10 µl of bacterial frozen
stock and growth overnight at 37oC. From this culture, a 50 µl aliquot was
removed, and added to 100 ml of fresh LB. At a growth level with an optical
density at 600 nm of 0.6, the culture was treated with IPTG to a final concentration
of 1.0 mM. This growth level typically took 3.5 - 4.0 hours to attain. The culture
was allowed to grow under inducing conditions for an additional 4 hours then
chilled to 4oC. The chilled bacterial cells were centrifuged at 10,000 g for 10 minutes, and the wet paste was resuspended in 2.5 ml (1/25 volume of the culture)
calcium binding buffer containing 50 mM NaCl (CABB-50). This expression was
scaled up by factors of 10 and 20 depending on the preparation.
2.15 Four methods Bacterial cell lysis were utilized including Lamelli solution lysis,
French Pressure lysis, Sonication lysis, and Bead Beating lysis.
A. Lamelli lysis was performed by addition of 3X Lamelli solution to resuspended
bacterial cells to a final concentration of 1X. Then the mixture was placed in
boiling water for 10 minutes, and the cellular debris was spun down at 10,000xG
for 10 minutes.
B. French Pressure lysis was performed in a 40 mL Aminco French Pressure Cell.
Concentrated cell resuspensions were loaded into the piston chamber, and the cell
was subjected to 5 minutes of constant internal pressure of 10,000 PSI. Then,
bacterial solution was aspirated out of the cell to rupture the bacterial walls. This
process was repeated 3 times for each 40 ml of concentrated, resuspended
bacteria.
C. Sonication procedures were modeled after the protocols outlined in Maniatis.11 In
our lyses, we utilized a probe-type sonicator with the following protocol. First,
we froze the concentrated, resuspended bacteria at –80 oC for 1 hour. Upon thawing, we placed the cells in a 15 mL Falcon tube, and started the sonicator at a
setting of 300 mA for 1 minute, then chilled the tube on ice for 2 minutes. This
process was repeated 4-6 times to achieve complete lysis.
D. Bead beating lysis was applied to the S. aureas strain donated by Dr. Wolfgang
Hengstenberg for the complementation assays. This is the most efficient method,
in our hands, for the lysis of this S797A strain. The method involves addition of
approximately 100 µl of glass beads to a microcentrifuge tube along with 1 mL of
concentrated, resuspended bacterial cells. The tube(s) are then vortexed briefly,
and placed in a sample holder positioned at the top of a mechanical piston. Once
secured, the sample is rapidly shaken by the action of the oscillating piston. After
2 minutes of beating, the samples are placed on ice for 2 minutes, then reinserted
in the sample holder for another 2-3 passages. Once complete, the cell free
extract was centrifuged away from the glass beads and cellular debris at 14,000
2.16 Protein purifications were accomplished on small and large scales with several
protocols. Chapter 5 contains a general analysis of these procedures that can be
summarized with the following general method.
A. Small Scale Purifications
Bacterial wet pastes were resuspended in CABB-50, then lysed with sonication,
followed by centrifugation at 10,000*g for 20 minutes. These cell free extracts
were then transferred to a microcentrifuge tube containing 50 µL of calmodulin
affinity resin (CAR). The slurry was allowed to rock for one hour at 60 rocks per
minute at 4 oC. The resin was spun down at 3000xG for 1 minute, then washed with 5 100 µL washings with CABB-50. Finally the resin was treated with 100
µL of elution buffer containing 50 mM NaCl (EB-50), spun down and the
supernatant was removed for SDS-PAGE analysis.
B. Large-Scale purifications
1. Cell free extracts are clarified by centrifugation a 15,000xG for 20 minutes, and
then shaken on ice with calmodulin affinity resin (amounts varied depending on
scale and method employed) at 50 revolutions per minute for approximately 1
hour.
2. Slurries were separated by centrifugation (small scale) or column frits (large
scale) to allow the unbound column “flow through” to be removed. Then the
resin was washed with 10-20 column volumes of calcium binding buffer (CABB,
3. The resin was eluted with 5-10 column volumes with elution buffer (EB, variable
components), and the protein containing fractions were grouped and dialyzed for
further analysis.
2.17 Metal binding studies were performed by careful additions of 10 mM metal
solutions into 0.8 mL solutions of proteins from 70 µM to 200 µM. Additions were
performed in a sequential manner with small changes in total solution volume from
0.5 to 5.0 metal equivalents corrected during analysis. After each metal addition,
each sample was mixed thoroughly and allowed to equilibrate for 1 minute prior to
recording the UV-Vis spectra.
2.18 EPR samples were taken directly from the UV-Vis titration samples with 5.0
equivalents of metal ion, and were recorded by averaging 5 scans over the window
of interest at a scan time of 100 s.
2.19 HPr mutant complementation assays were performed utilizing the procedure
developed by Dr. Wolfgang Hengstenberg and coworkers.12 The Staphyloccus aureus strain (S797A) deficient in a functional ptsH gene (HPr’s gene) was
graciously donated by Dr. Hengstenberg. Cell free extracts of the S797A strain
were generated by the bead beating lysis method as described in section 2.13.
Aliquots of HPr were added to the cell free extract in the presence of 2.0 mmoles of
Absorbance at 410 nm (ε = 6,000 M-1cm-1) was used to detect the formation of
o-nitrophenol, indicating HPr phosphotransfer activity.
2.20 MALDI-TOF mass spectrometric analysis of protein samples was performed on a
Bruker instrument (Proflex III) using stainless steel targets. The samples were
prepared by addition of addition of 2 µl of protein (0.25-0.75 mg/mL) to 3 µL of
solvent (2:1 H2O:CH3CN). This solution was then added to 5 µL of sinnapinic acid
matrix, and 1 µL of this resultant mixture was spotted on the target and allowed to
dry at room temperature.
2.21 CD data were obtained on native HPr, HPrγ, and HPrβ proteins dialyzed in 20 mM
phosphate buffer at pH = 8.0 to provide the cleanest CD window. For A222
measurements, the proteins were diluted 1/15 (~ 3 µM) to allow adequate
measurements down to 200 nm in a 10 mm cuvette. A280 measurements were
recorded on 700 µM protein solutions due to the much weaker CD signal at 280 nm
(tyrosine absorbance).
2.22 REFERENCES
1
Ausubel, F.M. et al., eds 1991 Current Protocols in Molecular Biology method, Wiley Interscience, New York ppXX-XX.
2
Ausubel, F.M. et al., eds 1991 Current Protocols in Molecular Biology method, Wiley Interscience, New York pp XX-XX.
3
4Qiagen midi-prep purification system manual, 1994, Qiagen Ltd.
5
QIAquick purification system manual, 1997, Qiagen Ltd.
6
QiaexII gel extraction purification system manual, 1996, Qiagen Ltd.
7
PCR Cloner system manual, 1997, 5-prime 3-prime Inc.
8
Miltenburg R. v. et al. eds. 1995 The DIG System User’s Guide for Filter Hybridization, Boehringer Mannheim GmbH, Biochemica, Germany
9
Bollag, D. M.; Rozycki, M. D.; Edelstein, S. J. Protein Methods, 2nd ed, 1996, Wiley-Liss, Inc. New York.pp 76-79.
10
Pain, R. Current protocols in Protein Science, 1996, Wiley & Sons, Inc. pp. 7.61-7.6.23
11
Sambrook, J. et. al. eds (1989) Molecular cloning: a laboratory manual, 2nd ed., Cold Spring Harbor Laboratory Press, Cold Spring Harbor.
12
Chapter 3
3.1 INTRODUCTION
To test our hypothesis that pre-existing phosphate-binding sites can serve as
generalized scaffolds for the construction of metal-binding sites, we needed to attempt
the conversion, and characterize its success. Phosphate sites in biology typically bind
one to three phosphates within their structures through hydrogen bonding interactions, or
covalent attachment to specific amino acid side chains.1 This variety affords us the opportunity to create mononuclear or polynuclear metal sites analogous to the parent
scaffold. For our initial studies we have focused on the creation of a mononuclear site.
This approach represents the simplest system we can generate. Experimental results from
this system can subsequently provide a foundation to expand to more complex design
strategies. Thus our first step in testing our hypothesis is to choose a mononuclear
phosphate-binding protein, and attempt to strategically convert its active site to a
metal-binding site.
3.2 PHOSPHATE-BINDING TEMPLATE
Our initial design strategy entailed defining a set of criteria for the scaffold
protein we believe are essential to effectively evaluate our hypothesis. Through these
criteria, we chose the Histidine-containing phosphocarrier protein (HPr) from the
Bacillus subtilis organism as our template protein. This section will delineate these
criteria, and demonstrate the rationale behind our choice of HPr from Bacillus Subtilis to
First criterion -- the template protein should contain an active site, that binds mononuclear phosphate ions instead of polynuclear phosphate ions. This will
minimize the potential number of variables (numbers of ligands, metals, potential
coordination geometries etc…) in the design strategy, and allow a more direct correlation
between the physical characteristics observed and the structural properties of the active
site. Our choice of HPr fits this criterion because its natural mode of action is to transfer
a single phosphate ion from Enzyme I to Enzyme II (Enzyme III in B. subtilis) in the
phosphoenolpyruvate phosphotransferase system (PEP-PTS). 2 Figure 3-1 illustrates the role of HPr in sugar translocation within the PEP-PTS. 3 HPr itself is not an enzyme, but a cytoplasmic protein that can be phosphorylated by Enzyme I, and dephosphorylated by
Enzyme II. Both Enzyme I and HPr are non-specific components in that they participate
in all phosphotransferase reactions regardless of specific sugar involved. HPr’s
interaction with phosphate has been demonstrated to be a covalent attachment of a single
phosphate ion to the N-1 nitrogen of a histidine residue within the phosphate-binding
Figure 3-1: Generalized mechanism of the phosphoenolpyruvate phosphotransferase system depicting the role of HPr in the transport of specific sugars across cellular membranes in E.
site.4 This histidine residue is universally conserved within all organisms utilizing the PEP-PTS, thus demonstrating its critical role in HPr function.5 In summary, HPr contains a mononuclear phosphate-binding site, which makes it a suitable choice of template to
test our hypothesis. Although polynuclear phosphate-binding proteins such as those in
the Ras family of NTP hydrolysis enzymes could provide useful scaffolds for
polymetallic proteins, we have chosen to test our hypothesis with the simplest case, and
HPr meets this requirement.
Second criterion -- the phosphate-binding protein should be structurally characterized. This is critical to allow us to design our experiments. By visualizing the three-dimensional structure of the template protein, we can evaluate the possibilities of
protein mutation and the potential metal coordination afforded within those mutants.
Structural knowledge is also important to evaluate the experimental results. Knowledge
of the local and global environment around the potential metal-binding sites can often
provide an explanation of experimental results. In addition, utilizing the structural
information of the template protein, one can often anticipate potential problems
associated with neighboring protein residues (metal coordinating side chains or hydrogen
bonding interactions) or more global hindrances such as disulfide bonds, hydrophobic
interactions, or ion channels. Clearly a structurally defined template is critical in testing
our hypothesis and our choice of HPr from B. Subtilis fulfills this requirement. Both a
three-dimensional X-ray crystal structure and a solution structure solved by
The structures obtained from both the NMR and X-ray crystallographic studies
are very similar, and informative. HPr is a monomeric protein of approximately 9,000
Daltons which is devoid of cysteine residues or disulfide bonds. Both of these
characteristics are favorable for our experiments. The small size of HPr is extremely
helpful because characterizations of the protein structure and spectroscopic analyses of its
metal-binding properties are more readily evaluated with a smaller set of potential
ligands. The strong solubility of HPr in conjunction with its small size enables the facile
generation of high concentration HPr solutions and use fewer milligrams of protein to
achieve them (high number of moles of HPr, relative to other, much larger proteins using
fewer g/mL). In addition, the accuracy of mass determinations with mass spectrometry
(MS) is enhanced since errors of 0.1% - 0.01% are typical for common MS techniques.
This results in a typical error of 1 to 10 Da for a protein the size of HPr, which is accurate
enough to identify the both mutation and metallation effects. The lack of disulfide bonds
and cysteines is also extremely helpful because it negates the necessity of utilizing
reducing agents such as β-mercaptoethanol or dithiothreitol in protein buffer solutions
(which can often form metal complexes, and complicate the spectroscopic
characterization of metal-binding). In addition, potential metal-cysteine interactions,
which are common in naturally occurring proteins, are avoided by the fortuitous absence
of cysteine residues in HPr. These structural observations taken together suggest that
HPr has the potential to be an ideal template protein to evaluate our hypothesis.
Details of the HPr structure give a clear picture of the phosphate binding site, and
function. Figure 3-2 contains a ribbon diagram of HPr depicting the folding of the
secondary and tertiary structure. The overall folding topology is an open-face β
-sandwich with four antiparallel β-strands packed against three α-helices. The
phosphate-binding site is located at the N-terminus of the first α-helix, and contains the universally
conserved Histidine 15 residue. This imidazole side chain is located on the protein
surface, thus the phosphate-binding site is solvent accessible. A second residue, arginine
17, which is also highly conserved, has been demonstrated to be essential for
phosphotransfer activity.8 It is located adjacent to His-15, and in the crystal structure by Herzberg and coworkers, forms a salt bridge via a sulfate ion with His-15. They suggest
that the sulfate ion’s association with these functionally essential residues implies that the
crystal structure resemble the phosphorylated state of HPr.6 Another key structural observation is the location of HPr’s C-terminus. As with all known HPr proteins, the
glutamate at residue 84 (B. subtilis) or 85 (E. coli) is spatially close to the
histidine-containing active site.9 Curiously, deletions or mutations of this residue do not result in greatly diminished activity, thus it is suggested that perhaps its role is to stabilize the
protein structure against denaturation.9 Figure 3-3 illustrates a close-up view of the HPr active site, with functionally important residues rendered. Proline 18 is another residue
which has been found to be a conserved of HPr proteins, and is critical to HPr function.
Substitution of Pro-18 with alanine greatly diminishes HPr’s activity. It is thought that
the proline helps stabilize the phosphate-binding region at the helix terminus, and
facilitates structural integrity of the active site.9 These and other structural observations give us a detailed insight into HPr’s structural properties afford it the ability to transfer a
single phosphate ion between two different enzymes. This information is essential for us
to strategically modify the phosphate-binding site of HPr into a metal-binding site, and
makes it an ideal candidate to test our hypothesis.
Third criterion – Our phosphate-binding template should have a quantifiable reactivity. This property is critical to determine the reactivity of our native protein, its mutants, and its metallo-adducts. First, by producing a native protein which is active, we
demonstrate that our preparation of HPr was successful, and that it is folded in the proper
form to allow natural reactivity with Enzyme I. In addition, by comparison of the native
reactivity with that of the generated mutants and their metal-adducts, we can show the
effects of our mutations and metallation on the native function. In our studies we plan to
utilize the mutant complementation assay developed by Dr. Wolfgang Hengstenberg and
coworkers. This assay produces colorimetric data to rapidly evaluate the functional
integrity of the tested protein. Thus the activity of HPr can be monitored, which meets
our third criterion for our scaffold phosphate-binding protein.
Fourth criterion -- The gene sequence for the phosphate-binding protein has been isolated and available. One of the most difficult steps in the genetic manipulation of a target gene is isolation of the native gene sequence from the target organism. This
can often take years to accomplish, thus we wanted to choose a phosphate-binding
protein in which the gene has been previously isolated. HPr has been extensively
been isolated, sequenced, and cloned. We contacted Dr. Jonathon Reizer at the
University of San Diego in La Jolla California, and he graciously agreed to donate the
isolated gene from the B. subtilis organism. This meets our fourth and final requirement
of genetic availability, and greatly reduces the difficulty of generating the recombinant
phosphate-binding protein and its mutants
From the above, it is clear that HPr satisfies the desired criteria for our scaffold
phosphate-binding protein, and thus appears ideal as a template to test our hypothesis.
3.3 SELECTION OF A TARGET SITE
Another step in the design process is to select a target metalloprotein site as an
idealized goal for the transformation of our phosphate-binding protein. Successful
conversion of a phosphate site into this target metal site would both establish the validity
of our hypothesis and serve as a building block for future research. We defined a set of
criteria for this target metal site we felt were important, and would give us the best
opportunity to synthesize and characterize the desired complex. In this section, we will
outline these criteria, and for each, demonstrate why we chose the iron complex found in
the active site of protocatechuate 3,4 dioxygenase (PCD) to test our hypothesis.
First criterion -- The target metal site contains a single metal that is covalently coordinated directly to the protein residues. This is the simplest case imaginable of direct metal coordination to the protein, thus it minimizes the potential
number of structural variables for both the design and synthesis processes. PCD satisfies
is directly coordinated to the amino acid residues of the enzyme. Figure 3-4 illustrates a
structural model of the PCD metalloenzyme solved by X-ray crystallography.10
Second criterion – The target should originate from a naturally occurring metalloenzyme that has functional importance. With our ultimate goal of
developing a systematic strategy for the preparation of designer metalloenzymes, it is
important that we choose a target metal site derived from a metalloenzyme. This will
afford us the opportunity to prepare a functional metal binding site within our formerly
non-reactive phosphate binding protein. If we can successfully prepare this metal site,
we can accomplish several goals.
• We validate our hypothesis.
• We evaluate the minimum requirements for reactivity and substrate
specificity of our target. It is important to test the critical factors involved in
substrate specificity so that we may engineer this ability within our designer
metalloenzymes. Our successful preparation of an active metalloenzyme
could be accompanied with a lack of substrate specificity, which, although a
negative result, could provide valuable insight into the fundamental factors
for its incorporation. Our choice of PCD certainly fits this criterion because
it is an active metalloenzyme that has been demonstrated to be substrate
specific for the protocatechuate molecule.
• We will have generated a synthetic metalloenzyme that has
functional/industrial applications. PCD is naturally occurring
metalloenzyme that catalyzes the specific breakdown of the aromatic
molecule protocatechuate (Figure 3-5). This reaction is one of the evolved
pathways for the breakdown of aromatic hydrocarbons.
HOOC OH
OH
PCD
COOH COOH HOOC