University of Windsor University of Windsor
Scholarship at UWindsor
Scholarship at UWindsor
Electronic Theses and Dissertations Theses, Dissertations, and Major Papers
2013
Micro Surface Texturing for Friction Control
Micro Surface Texturing for Friction Control
Ola Rashwan University of Windsor
Follow this and additional works at: https://scholar.uwindsor.ca/etd
Recommended Citation Recommended Citation
Rashwan, Ola, "Micro Surface Texturing for Friction Control" (2013). Electronic Theses and Dissertations. 4869.
https://scholar.uwindsor.ca/etd/4869
This online database contains the full-text of PhD dissertations and Masters’ theses of University of Windsor students from 1954 forward. These documents are made available for personal study and research purposes only, in accordance with the Canadian Copyright Act and the Creative Commons license—CC BY-NC-ND (Attribution, Non-Commercial, No Derivative Works). Under this license, works must always be attributed to the copyright holder (original author), cannot be used for any commercial purposes, and may not be altered. Any other use would require the permission of the copyright holder. Students may inquire about withdrawing their dissertation and/or thesis from this database. For additional inquiries, please contact the repository administrator via email
Micro Surface Texturing for Friction Control
By
Ola Rashwan
A Dissertation
Submitted to the Faculty of Graduate Studies
through Engineering Materials
in Partial Fulfillment of the Requirements for
the Degree of Doctor of Philosophy
at the University of Windsor
Windsor, Ontario, Canada
2013
Micro Surface Texturing for Friction Control
By
Ola Rashwan
APPROVED BY:
Dr. I.D. Marinescu (External Examiner), Mechanical, Industrial &
Manufacturing Engineering, University of Toledo
Dr. T. Bolisetti (Outside Program Reader), Civil & Environmental
Engineering
Dr. D.O. Northwood (Program Reader), Engineering Materials
Dr. D. Green (Program Reader), Engineering Materials
Dr. V. Stoilov (Co-Advisor), Engineering Materials
Dr. A.T. Alpas (Co-Advisor), Engineering Materials
Dr. F. Schlosser (Chair of Defense), Odette School of Business
iii
DECLARATION
OF
CO-AUTHORSHIP
AND
PREVIOUS
PUBLICATION
I hereby declare that this thesis incorporates material that is result of joint research, as follows:
This thesis incorporates one original paper that has been published in [Proceedings of ASME 2012 International Mechanical Engineering Congress & Exposition]and is included in Chapter 6 of the thesis:
Thesis Chapter
Publication title/full citation Publication status*
Chapter 6 Effect of Surface Patterning on the
Adhesive Friction, Ola Rashwan, Vesselin Stoilov, Ahmet Alpas, Ariel Guerrero, Proceedings ofASME 2012 International Mechanical Engineering
Congress & Exposition,Paper Number IMECE2012-89644
Published
In all cases, the key ideas, primary contributions, experimental designs, data analysis and interpretation, were performed by the author, Dr. V. Stoilov, and Dr. A.T. Alpas as advisors.
I certify that, with the above qualification, this thesis, and the research to which it refers, is the product of my own work.
iv
I declare that, to the best of my knowledge, my thesis does not infringe upon anyone’s copyright nor violate any proprietary rights and that any ideas, techniques, quotations, or any other material from the work of other people included in my thesis, published or otherwise, are fully acknowledged in accordance with the standard referencing practices. Furthermore, to the extent that I have included copyrighted material that surpasses the bounds of fair dealing within the meaning of the Canada Copyright Act, I certify that I have obtained a written permission from the copyright owner to include such material in my thesis.
v
ABSTRACT
Recently, surface texturing has gained momentum as a way to control the friction which is involved in various applications and systems, such as components of internal combustion engines, dies and punches of the metal forming processes and Micro-electrical-mechanical Systems (MEMS). This dissertation demonstrates that under dry sliding, there is a specific significant surface texturing parameter at which the coefficient of friction should be at a minimum. This dissertation met this objective through an extensive study of the relevant literature on surface texturing and friction, analysing the friction mechanisms involved in dry sliding, and highlighting the key factors that control friction as the real area of contact and material properties. An analytical proof is derived demonstrating that a minimum friction force exists if the two components of the friction force, adhesion and mechanical deformation, are differentiated with respect to the real contact area. In addition, numerical simulations and experimental work were performed to test this hypothesis. In the two and three dimensional finite element models, normal and sliding contact between a rigid indenter and elastic-plastic surfaces, which are textured by circular and hexagonal dimples of different sizes and densities, are simulated and analysed. Circular craters of different sizes and densities, are fabricated using laser ablation on hardened tool steel samples, while the hexagonal dimples are fabricated using photo-lithography. The dimples are arranged in adjacent equilateral triangles layout.
vi
decreasing with the increase of the spatial texture density. The dimensionless quantity, spatial texture density (D/L) was identified as the most significant texturing parameter. It is equal to the ratio of the size of the crater (D) to the distance between the centers of two consecutive craters (L). A minimum coefficient of friction exits at values of spatial texture densities that lie between 0.25 and 0.5.
vii
DEDICATION
viii
ACKNOWLEDGEMENTS
I would like to thank Allah for giving me the strength and endurance to accomplish this work.
I would like to thank my doctoral advisor, Dr. V.Stoilov, for his dedication and continuous support and help.
I would like to thank my co-advisor Dr. A. Alpas, for his support of the experimental work and his advice during the course of my study.
I would like to extend my thanks to my committee members, Dr. D. Northwood, Dr. D. Green, and Dr.T. Bolisetti for their time and effort during my PhD study with special thanks to Dr. D. Green and Dr. D. Northwood for reviewing this dissertation, and their continuous support and advice.
I would like to thank Ms. Kora, Dr. Edrisy, and Dr. S.Das, for their help with my experimental work.
Special thanks go to my mother, my sisters and my brother for their unconditional love and support.
ix
TABLE OF CONTENTS
DECLARATION OF CO-AUTHORSHIP AND PREVIOUS PUBLICATION ... iii
ABSTRACT ... v
DEDICATION ... vii
ACKNOWLEDGEMENTS ... viii
LIST OF TABLES ... xiv
LIST OF FIGURES ... xv
LIST OF ABBREVIATIONS ... xxii
NOMENCLATURE ... xxiii
Chapter 1 Introduction and Literature Review ... 1
1.1 Introduction ... 1
1.2 Surface Texturing Parameters ... 2
1.3 Benefits of Surface Texturing ... 3
1.4 Surface Texturing Fabrication Methods ... 4
1.4.1 Laser Surface Texturing (LST) ... 7
1.5 Optimization of the Surface Texturing Parameters ... 9
1.5.1 Analytical Studies of Optimization of the Surface Texturing Parameters. ... 9
1.5.2 Experimental Studies on the Effect of Surface Texturing on Friction 11 1.6 Applications of Surface Texturing ... 15
1.6.1 Surface Texturing in Automotive Components ... 16
1.6.2 Surface Texturing in MEMS Applications ... 18
x
1.7 Summary ... 20
1.8 Research Objectives and Approach ... 21
1.9 Dissertation Outline ... 22
Chapter 2 Theory and Analytical Approach ... 24
2.1 Dry Friction Mechanisms ... 24
2.2 Adhesion Component of the Friction Force ... 30
2.3 Mechanical Deformation Component of Friction Force ... 35
2.4 Micro Surface Patterning as an Effective Means for Controlling Friction ... 35
2.5 Analytical Proof that Friction Force Has a Minimum Value ... 36
2.6 Conclusion of Dry Friction Mechanisms ... 40
Chapter 3 Numerical Simulations for Textured Surfaces... 41
3.1 Background of the Analytical and Numerical Contact Models... 41
3.2 Two Dimensional Models for Prediction of the Significant Texture Parameters ... 47
3.2.1 Cantor Set ... 47
3.2.2 Geometry of 2D Plane Strain Models ... 48
3.2.3 Boundary and Loading Conditions of 2D Models ... 50
3.2.4 Mesh Properties of 2D Models ... 51
3.3 Results and Discussion of 2D Models ... 52
3.4 Three Dimensional Textured Surface Models ... 55
3.4.1 Geometry of 3D Models ... 55
3.4.2 Material Properties of 3D Textured Surface Models ... 57
3.4.3 Assembly and Contact Interaction of 3D Models ... 58
xi
3.4.5 Mesh and Mesh Sensitivity of 3D Models ... 60
3.5 Results and Discussion of 3D Models ... 62
3.5.1 The Numerical Models for Circular Patterns ... 63
3.5.2 The Numerical Models for Hexagonal Patterns ... 68
3.5.3 The Effect of the Texture Shape on COF in the 3D Numerical Models ...73
3.5.4 The Effect of the Pattern Anisotropy on COF of the 3D Numerical Models ... 75
3.6 Conclusions of the Numerical Simulations ... 78
Chapter 4 Circular Surface Texturing by Laser Ablation ... 81
4.1 Material Properties and Sample Preparation of the Circular Texture ...81
4.2 Design of the Circular Patterns ... 81
4.3 Fabrication of the Circular Patterns Using Laser Ablation ... 82
4.4 Tribological Tests for Circular Texture ... 86
4.5 Results and Discussion of Circular Patterns ... 88
4.6 The Effect of Circular Patterns on COF vs. Un-textured Surface ... 89
4.6.1 The Effect of Individual Texturing Parameters on COF ... 93
4.6.2 The Effect of the Spatial Texture Density on COF ... 93
4.7 Comparison between Numerical Models and Experimental Results ...96
4.8 Conclusions of the Circular Patterns ... 98
Chapter 5 Hexagonal Patterns Using Photolithography ... 99
5.1 Hexagonal Pattern Design ... 99
xii
5.2.1 Sample Preparation for Hexagonal Patterns ... 101
5.2.2 Photolithography Process ... 102
5.2.3 Challenges of Photolithography ... 102
5.3 Tribological Tests for Hexagonal Patterns ... 103
5.4 Results and Analysis of the Hexagonal Patterns ... 104
5.4.1 Micrographs of the Hexagonal Textured Samples ... 105
5.4.2 COF and PD vs. the Sliding Distance of Hexagonal Patterns ... 118
5.4.3 The Effect of Texturing Parameters on COF ... 122
5.4.4 The Patterns Anisotropy ... 126
5.4.5 Un-textured Sample vs. Textured Samples of Hexagonal Patterns 128 5.5 Conclusions of Hexagonal Texturing by Photolithography ... 135
Chapter 6 Effect of Surface Patterning on Adhesion Forces ... 137
6.1 Introduction on Adhesion Force ... 137
6.2 Analytical Model for Adhesion Force Measurement ... 139
6.3 Experimental Procedure for Adhesion Force Measurement ... 142
6.3.1 Measurement of the Adhesion Force Using AFM ... 142
6.4 Results and Discussion of Adhesion Force Measurement ... 145
6.4.1 The Effect of Individual Texture Parameters on the Measured Adhesion Force ... 146
6.4.2 The Effect of the Spatial Texture Density on the Measured Adhesion Force. ...147
6.4.3 Empirical Relation between the Spatial Texture Density and Adhesion Forces ... 148
6.5 Results of Hamaker Summation Model ... 149
xiii
Chapter 7 General Discussion and Conclusions ... 153
7.1 Summary of the Research ... 153
7.2 Research Contributions ... 159
7.3 Recommendations and Future Research ... 161
REFERENCES ... 162
Publications ... 169
xiv
LIST
OF
TABLES
Table 3-1: The Material Properties of Air Hardened Tool Steel (A2) ... 57
Table 3-2: The Combination of the Samples' Diameters and the Spatial Texture
Densities ... 63 Table 3-3: Combination of the Spatial Texture Densities and Hexagonal Dimples
Diameters ... 69 Table 4-1: Different Combinations for Hole Diameters (D) and Spatial Distance
(L) ... 82 Table 4-2: Summary of the Experimental Results ... 90
Table 5-1: Dimensions of the Patterned Samples ... 101
Table 5-2: Summary of the Coefficients of Friction for the Hexagonal Patterns
xv
LIST
OF
FIGURES
Figure 1-1: Fabrication Process for Reactive Ion Etching[15] ... 5
Figure 1-2: Standard Etching for Si Wafers [36] ... 5
Figure 1-3: Abrasive Jet Machining (AJM) and Laser Beam Machining (LBM) are used for Texture Fabrication [25] ... 6
Figure 1-4: Excimer Laser Beams[19] ... 8
Figure 1-5: Textured squares and grooves by Pettersson and Jacobson [27] .... 13
Figure 1-6: The Circular Dimples Arranged in a Square Pattern[47]. ... 14
Figure 1-7: Surface Texturing in Different Applications ... 16
Figure 1-8: Partial surface texturing of a stator (a) in contact with plain rotor (b) [4] ... 18
Figure 1-9: Textured Inserts of Wire Drawing Dies [3] ... 20
Figure 2-1: Real Area of Contact vs. the Apparent Area of Contact [66] ... 25
Figure 2-2: The Contact of Two Sliding Surfaces Relative to Each Other[68] .... 26
Figure 2-3: The Surface Forces of the Chang et al. Model[70] ... 27
Figure 2-4: The Friction Force Components vs. the Contact Area... 37
Figure 3-1: Generalized 2D Cantor set [114] ... 48
Figure 3-2: Dimensions of the 2D Fractal Model. ... 49
Figure 3-3: Different Surface Texturing Parameters. ... 50
Figure 3-4: Boundary Conditions for the 2D Plain Strain Model. ... 51
Figure 3-5: Mesh of the 2D Textured Part. ... 52
Figure 3-6: Yielding of the Smallest Asperities ... 53
Figure 3-7: The Spatial Texture Density (D/L) for 2D Textured Model ... 53
xvi
Figure 3-9: The Geometry of the Parts in Contact ... 56
Figure 3-10: Different Texture Designs with Different Dimensions and Densities
... 57 Figure 3-11: The Elastic -Fully-Plastic Deformation Model ... 58
Figure 3-12: Boundary Conditions Applied to the Sides and the Bottom of the
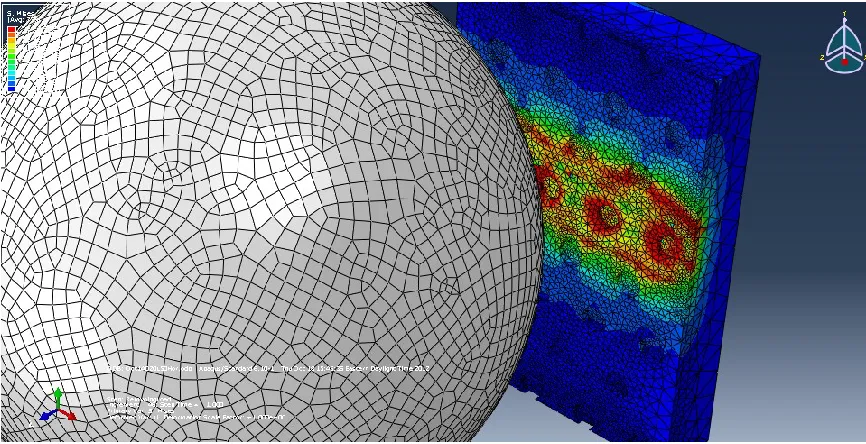
Deformable Textured Parts... 60 Figure 3-13: Mesh Elements for the Patterned Surface and Rigid Indenter ... 61
Figure 3-14: Different Mesh Densities ... 62
Figure 3-15: Coefficients of Friction due to Mechanical Deformation and
Adhesion for the Circular Diameter of 5 µm. ... 64 Figure 3-16: Coefficients of Friction due to Mechanical Deformation and
Adhesion for the Circular Diameter of 10 µm ... 64 Figure 3-17: Coefficients of Friction due to Mechanical Deformation and
Adhesion for the Circular Diameter of 20 µm ... 65 Figure 3-18: The Mechanical Deformation Component for 3 Different Dimples'
Diameters ... 66 Figure 3-19: Adhesion Component for the Three Different Dimples' Diameters . 66
Figure 3-20: The Overall Coefficient of Friction Curve Fitted for the Three
Different Diameters ... 67 Figure 3-21: Von Misses Stress Shows Plastic Deformation Mode along the
Sliding Path ... 68 Figure 3-22: Hexagonal Pattern Texture Parameters ... 69
Figure 3-23: Coefficient of Friction Due to Mechanical Deformation for Hexagonal
Diameter of 15 µm ... 70 Figure 3-24: Coefficient of Friction Due to Mechanical Deformation and Adhesion
xvii
Figure 3-25: Coefficient of Friction Due to Mechanical Deformation and Adhesion
for Hexagonal Diameter of 40 µm ... 71 Figure 3-26: Coefficient of Friction Due to Mechanical Deformation for the Three
Hexagonal Diameters ... 72 Figure 3-27: Coefficients of Friction Due to Adhesion for the Three Hexagonal
Diameters ... 72 Figure 3-28: Comparison between Circular and Hexagonal Shapes for the
Adhesion Component of Friction ... 74 Figure 3-29: Comparison between Circular and Hexagonal Shapes for the
Mechanical Deformation Component ... 74 Figure 3-30: The Vertical Direction has Different Spatial Texture Density ... 76
Figure 3-31: The Plastic Flow along the Vertical Sliding Path of the Indenter .... 76
Figure 3-32: Comparison between the Horizontal Sliding and Vertical Sliding for
Diameter 20 µm ... 77 Figure 4-1: The Orientation of the Holes in Equilateral Triangles Arrangement . 82
Figure 4-2: Laser Ablation System ... 83
Figure 4-3: SEM and WYKO Profilometer Pictures for Circular Textured Samples
... 86 Figure 4-4: Micro scratch Tester with Rockwell Diamond Tip ... 87
Figure 4-5: The Scratches of Samples # 6D10L30 (Top) and #
9(D20L40)(Bottom) ... 88 Figure 4-6: The Average Coefficients of Friction of the Textured Samples and the
Plain (un-textured) Reference Sample ... 90 Figure 4-7: The Coefficient of Friction vs. the Sliding Distances for the Dimple
Size of 5 µm ... 91 Figure 4-8: The Coefficient of Friction vs. the Sliding Distances for the Dimple
xviii
Figure 4-9: The Coefficient of Friction vs. the Sliding Distances for the Dimple
Size of 20 µm ... 92
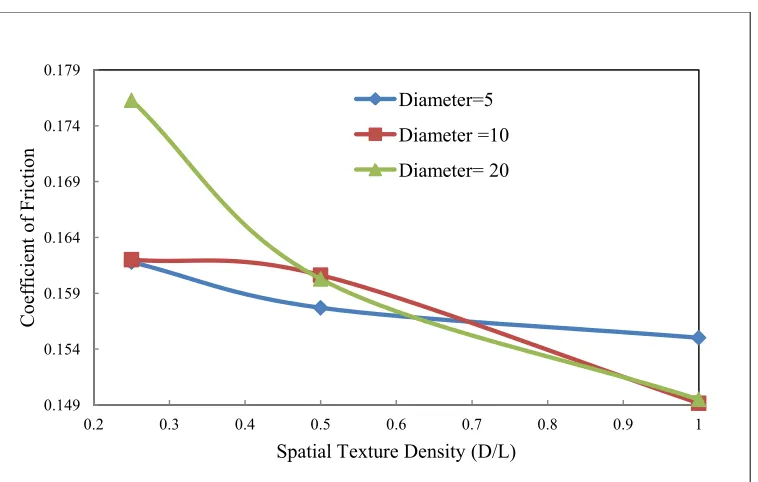
Figure 4-10: Effect of the Spacing L for Different Dimple Diameters ... 93
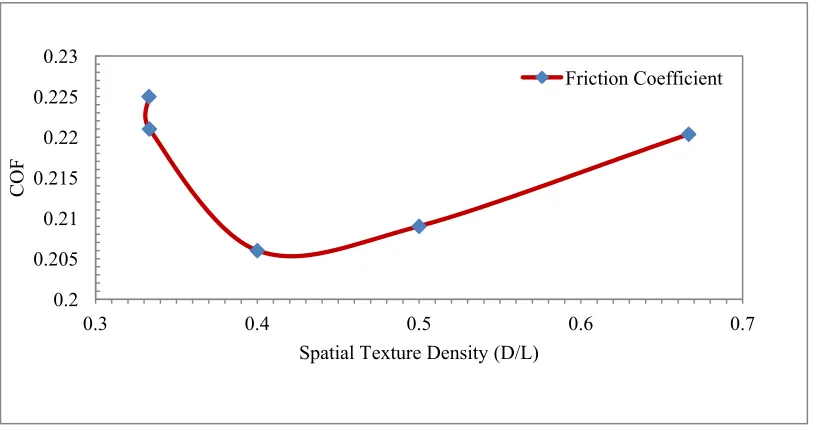
Figure 4-11: the Effect of the Spatial Dimple Densities for Different Diameters . 95 Figure 4-12: The Overall Fitted Friction Coefficients Vs. the Spatial Texture Densities (D/L) for Numerical Simulations and Experimental Results ... 97
Figure 5-1: 2D Hexagonal Pattern Layout ... 100
Figure 5-2: The Basic Steps for Photolithography Etching ... 102
Figure 5-3: Undercut Challenge with Small Diameters ... 103
Figure 5-4: Alignment of a Horizontal Scratch in (a) and Vertical Scratch in( b). ... 104
Figure 5-5: Sample# 1 D40L60 SEM Pictures for vertical scratch in (a1) and horizontal scratch in (a2). Scratch tester Integrated Microscopic pictures for vertical scratch in (b1) and horizontal scratch in (b2). 3D Profilometer Images for Scratched Path in(c1) and Unscratched sample in (c2). ... 106
Figure 5-6: Sample#2 D40L80 SEM Pictures for vertical scratch and horizontal scratch in (a). Scratch tester Integrated Microscopic pictures for vertical scratch in (b1) and horizontal scratch in (b2). 3D Profilometer images for Scratched path in(c1) and unscratched sample in (c2). ... 107
Figure 5-7: Sample#3 D40L100 SEM Pictures for vertical scratch in (a1) and horizontal scratch in (a2). Scratch tester Integrated Microscopic pictures for vertical scratch in (b1) and horizontal scratch in (b2). 3D Profilometer images for Scratched path in (c1) and unscratched sample in(c2). ... 108
xix
Figure 5-9: Sample#5 D20L80 SEM Pictures for vertical scratch and horizontal
scratch in (a). Scratch tester Integrated Microscopic pictures for vertical scratch in (b1) and horizontal scratch in (b2). 3D Profilometer images for Scratched path in ( c1) and unscratched sample in ( c2). ... 110 Figure 5-10: Sample#6 D20L50 SEM Pictures for vertical scratch in (a1) and
horizontal scratch in (a2). Scratch tester Integrated Microscopic pictures for vertical scratch in (b1) and horizontal scratch in (b2). 3D Profilometer images for Scratched path in ( c1) and unscratched sample in ( c2). ... 111 Figure 5-11: Sample #12 D20L40 SEM Pictures for vertical scratch in (a1) and
horizontal scratch in (a2). Scratch tester Integrated Microscopic pictures for vertical scratch in (b1) and horizontal scratch in (b2). 3D Profilometer images for Scratched path in (c1) and unscratched sample in (c2). ... 112 Figure 5-12: Sample #13 D20L35 SEM Pictures for vertical scratch in (a1) and
horizontal scratch in (a2). Scratch tester Integrated Microscopic pictures for vertical scratch in (b1) and horizontal scratch in (b2). 3D Profilometer images for Scratched path in (c1) and unscratched sample in(c2). ... 113 Figure 5-13: Sample #9 D15L22.5 SEM Pictures for vertical scratch in (a1) and
horizontal scratch in (a2). Scratch tester Integrated Microscopic pictures for vertical scratch in (b1) and horizontal scratch in (b2). 3D Profilometer images for Scratched path in (c1) and unscratched sample in(c2). ... 114 Figure 5-14: Sample #8 D15L30 SEM Pictures for vertical scratch in (a1) and
horizontal scratch in (a2). Scratch tester Integrated Microscopic pictures for vertical scratch in (b1) and horizontal scratch in (b2). 3DProfilometer images for Scratched path in (c1) and unscratched sample in (c2). ... 115 Figure 5-15: Sample #10 D15L37.5 SEM Pictures for vertical scratch in (a1) and
xx
Figure 5-16: Sample #11 D15L60 Pictures for vertical scratch in (a1) and
horizontal scratch in (a2). Scratch tester Integrated Microscopic pictures for vertical scratch in (b1) and horizontal scratch in (b2).3D Profilometer images for Scratched path in (c1) and unscratched sample in (c2). ... 117 Figure 5-17: Coefficients of Friction and Penetration Depth(PD) for Diameter 40
µm ... 119 Figure 5-18: Coefficients of Friction and Penetration Depth for Diameter 20 µm
... 120 Figure 5-19: Coefficients of Friction and Penetration Depth (PD) for Diameter 15
µm ... 121 Figure 5-20: Coefficients of Friction for the Three Hexagonal Diameters vs. the
Spatial Texture Densities ... 123 Figure 5-21: The Coefficients of Friction vs. the Spatial Texture Densities for
Horizontal Scratches of the Hexagonal Patterns ... 125 Figure 5-22: Coefficients of Friction vs. the Spatial Texture Densities for Circular
Patterns ... 125 Figure 5-23: Coefficients of Friction vs. Texture Densities for the Vertical
Scratches ... 127 Figure 5-24: The Coefficients of Friction for Horizontal and Vertical Scratches
and the Plain Etched Sample ... 127 Figure 5-25: First Spot – Textured and Non-Scratched Spot. (a) SEM Picture with
a Square of the Examined Spot. (b) The Material Compositions of the Squared Spot. (c) EDS Spectra of the Squared Spot. ... 130 Figure 5-26: Second Spot – Un-Textured and Un-scratched (a) SEM picture with
xxi
Figure 5-27: Third Spot – Scratched Textured Spot (a) SEM picture with a
Square of the Examined Spot. (b) The Material Compositions of the Squared Spot. (c) EDS Spectra of the Squared Spot. ... 132 Figure 5-28: Fourth Spot – Un textured and Scratched (a) SEM picture with a
Square of the Examined Spot. (b) The Material Compositions of the Squared Spot. (c) EDS Spectra of the Squared Spot. ... 133 Figure 5-29: The Effect of Chromium Content on the Coefficient of Friction,
reproduced [117] ... 134 Figure 6-1: Illustration of the spherical tip (R1) in contact with the textured
surface with the largest inscribed sphere, R2 fitted in between the laser craters. ... 142 Figure 6-2: Schematic diagram of AFM in Contact Mode ... 143
Figure 6-3: SEM Micrograph of the AFM tip with Spherical Probe (600X) ... 144
Figure 6-4: The Force-Displacement (Z) Curve for a Selected Sample ... 145
Figure 6-5: The AFM Measured Adhesion Forces for the Textured Samples . 146
Figure 6-6: The Effect of the Texture Size on Adhesion Force (dotted line shows
the increasing trend with the increase of the distance between the laser craters, L) ... 147 Figure 6-7: The Effect of the Texture Density on Adhesion Forces Measured by
AFM ... 148 Figure 6-8: The Least Squares Fitting Power Law of the Measured Adhesion
Forces ... 149 Figure 6-9: The analytically Calculated Adhesion Forces Using Hamaker
xxii
LIST OF ABBREVIATIONS
AJM Abrasive Jet Machining
AFM Atomic Force Microscope
COF Coefficient of Friction
LBM Laser Beam Machining
EDS Energy dispersive spectroscopy
LST Laser Surface Texturing
MEMS micro-electrical mechanical Systems
PD Penetration Depth
RIE Reactive Ion Etching
rms
SEM
Root mean squares
Scanning Electron Microscope
VMT
WYKO
vibro-mechanical texturing
Profilometer brand name
xxiii
NOMENCLATURE
ai separation distance
A contact area.
Ar Real Area of Contact
C the constant in least square fitted power law
D Diameter of the texture or Pattern
F Friction Total Friction Force
Fadh Friction force due to adhesion
Fdef Friction Force due to mechanical Deformation
Fs Intermolecular Forces
G Scaling Constant for fractal Surface
Hi Hamaker constant for material i
Hij Hamaker Constant for the two materials i and j
L Linear distance between the centers of any two adjacent dimples
M number of largest inscribed spheres in the projected area of AFM tip
N the Power constant in least square fitted power law.
P contact load
R radius of Rigid sphere in contact
RC Contact Radius
the maximum tangential force needed to shear the formed junctions
W Wa Work of adhesion
ri Radius of the sphere in contact in adhesion force contact mechanics models
µ Coefficient of friction
1
Chapter 1
I
NTRODUCTION ANDL
ITERATURER
EVIEW1.1 Introduction
Friction is involved in thousands of applications in our daily lives. In some applications high friction is desirable, as in vehicles' tires on the roadways, brakes, clutches, and frictional power transmission systems. In other applications, friction reduction is a constant demand which reflects on energy efficiency, component durability, and system reliability. For example, the energy loss due to friction in automobiles is estimated to be 40% of the total energy generated by the internal combustion engine [1]. In all cases, understanding the mechanisms involved in friction and the means to control it are necessary. Various approaches have been employed in order to control friction, some of which are lubrication, coating, and surface modification such as texturing, which is the focus of this study.
2
can control friction in all operating conditions. Three decades ago [2], attention was drawn to surface patterning, or surface texturing, as an effective means to improve the tribological performance.
The idea of surface texturing is inspired by nature. Shark skin, for instance, boosts swim speed by cutting the drag force; therefore, the skin suits of Olympic athletes have v-shaped grooves called riblets which mimic the texture of shark skin. The gecko foot is another example from nature that inspired many adhesive systems.
Many studies have investigated the effect of surface texturing on the performance of a variety of mechanical systems. It was found that surface texturing has great potential for improving the tribological performance in terms of reducing the wear, friction, and lubrication consumption. In the following sections, a review of the surface texturing effect on friction is presented. This includes a discussion of the surface texturing parameters, the different benefits of the textured surfaces based on lubrication regimes, the various methods which are used to fabricate the textured surface, and the applications that widely employ micro-surface texturing.
1.2 Surface Texturing Parameters
3
In general, surface texture may be positive, in that it protrudes out of the surface, or negative, such as dimples or holes. It can also be made up of continuous grooves, channels, or undulations. It can be discrete shapes, such as circular, square, triangular, or hexagonal, that are distributed evenly or randomly.
Positive surface textures are used extensively in micro-electrical mechanical systems (MEMS), and magnetic hard disks to decrease the friction by decreasing the area of contact. Negative texturing, which is the focus of the current study, is mostly employed in automotive components, and in machining tools and punches for metal forming processes.
1.3 Benefits of Surface Texturing
4
In boundary lubrication these craters act as lubricant reservoirs for the continuous retention of lubricant [5, 12, 23-28], and for dry sliding the surface texture acts as wear debris traps so that plowing decreases. Consequently, abrasive wear and friction are reduced [2, 5, 27, 29-33].
1.4 Surface Texturing Fabrication Methods
Various machining methods have been employed to create micro-texturing on the surface of different materials. Schneider [34] developed the vibro-rolling method to create shallow channels using a hard indenter that vibrates as it translates across the workpiece. Suh et al. [28] used chemical etching and abrasive machining to create modulated or undulated patterns that act as traps for oxide wear debris, and Willis [35] used honing to generate micro-grooves for the cylinder bores of internal combustion engines. The micro-grooves improve the lubrication between the cylinder walls and the piston ring.
5
Figure 1-1: Fabrication Process for Reactive Ion Etching[15]
Pattersson and Jacobson [27] used a standard photolithographic technique, with Potassium Hydroxide as anisotropic etchant, to create runners and square depressions of 5µm in depth on silicon wafers. The standard steps for the anisotropic etching of silicon wafers are illustrated in Figure 1-2.
Figure 1-2: Standard Etching for Si Wafers [36]
6
used by the same group. These two fabrication methods result in different profile shapes, circular and angular from AJM and LBM respectively, though the effect of the texture shape is found to be insignificant.
Figure 1-3: Abrasive Jet Machining (AJM) and Laser Beam Machining (LBM) are used for Texture Fabrication [25]
The vibro-mechanical texturing (VMT) technique was developed by Greco et al. [37], and this technique is based on the conventional turning operation with a fast tool servo that is used to oscillate the cutting tool. This oscillating motion creates holes when the cutting tool contacts the work piece.
7
1.4.1 Laser Surface Texturing (LST)
LST has many advantages over the previously mentioned texturing fabrication methods since it is very fast, environmentally clean, precise, and maskless. In addition, a variety of sizes can be created, and it can be used with most material types.
When a focused laser beam is localized on the surface of a material, the molten material evaporates immediately at a very high rate without causing severe damage to the surface or bulk material. Different types of laser beams are used to create the craters on the surface, and different media can generate the laser beam (photons). Examples of the gaseous media are He-Ne, Ar, Kr, Xe, N2,
and CO2. Excimer laser beams, shown in Figure 1-4 [19] , that include halides in
8
Figure 1-4: Excimer Laser Beams[19]
Many of the parameters of laser surface texturing must be optimized in order to get high quality, precise micro-craters. The resolution, for instance, depends on the wavelength of the laser source, whereas the ablation rate is based on energy density, and the depth of the craters is controlled by the number and duration of the pulses [38].
9
distribution were analyzed. The study [6] concluded that variations in the dimple depth and diameter have only a small effect on the load carrying capacity, but this variation in texture size affects the film thickness, which in turn affects the expansion of the hydrodynamic regime.
1.5 Optimization of the Surface Texturing Parameters
Most of the research done on surface texturing is experimental, except for a few analytical studies that try to optimize the surface texture parameters. In the following subsections, analytical studies are reviewed and followed by experimental investigations.
1.5.1 Analytical Studies of Optimization of the Surface Texturing Parameters.
10
Sirpuram and Stephens [11, 40] addressed the effects of different texture shapes of positive and negative texturing. Square, diamond, circular, triangular and hexagonal shapes were modeled, with different area densities under a hydrodynamic lubrication condition. Two objectives were sought in this study, the effects of the shape and the texture areal density on the coefficient of friction and leakage rate. They concluded that the shape of the texture has an insignificant effect on the friction coefficient; however it had a great impact on the leakage rate. The square pattern provided the worst leakage rate, and the triangular pattern gave the best leakage rate. In addition, the texture areal density affects the minimum friction coefficients, which were obtained at 20% and 80% of the areal texture coverage for the positive and negative texturing, respectively.
11
pattern [41]. The improved model showed agreement with the experimental results that involved a simple sliding textured rig.
Etsion et al. [7, 9] developed another analytical model to simulate the piston ring-cylinder liner system. The ring and liner were modeled as two parallel flat surfaces where only the ring surface was dimpled, and a reduction of 30% in friction was obtained. The optimal diameter to depth ratio was found to be between 0.1 and 0.18, and areal texture densities varied from 5% to 20% which contradicted with the values found by Stephen[40]. This analytical study showed a similar trend to the experimental test, however, the exact values differed due to the adjustment in the lubricant viscosity assumed in the analytical study.
Tnder [12, 44] proved analytically that a micro textured region can replace a macro feature, such as step or inclined plane, in creating hydrodynamic pressure in sliding seals. The role of either the macro feature or the proposed micro textured area is to decrease the friction which the entering flow to the seal encounters. In this analytical study, grooves oriented perpendicularly to the flow direction were modeled, as well as square and circular discrete dimples. All texturing designs showed improvement in the hydrodynamic pressure and the leakage rate.
1.5.2 Experimental Studies on the Effect of Surface Texturing on Friction
12
researchers have investigated the effects of surface texturing on the friction experimentally under different sliding conditions. However, most of these studies focus on wet conditions.
Kovalchenko et al. [8] looked into the effects of laser surface texture on the lubrication regime transition. Specifically, the effects of the sliding speed, normal pressure, and the lubricant viscosity on the friction were tested. A pin-on-disk apparatus was used in this case, and the laser surface texturing had more impact on friction in cases of higher normal loads, higher sliding speed, and higher viscosity.
13
causing the fluctuations in the friction behavior. On the other hand, the TiN textured samples showed low friction with both the square and groove patterns.
Figure 1-5: Textured squares and grooves by Pettersson and Jacobson [27]
Another study was carried out by Ryk et al. [45] that showed the negative effect of dimples under boundary lubrication conditions, if the depth of the groove is not appropriately chosen, or if the lubricant feed rate is not sufficiently high. This study showed that the deeper the dimples are, the higher the friction is. In addition, at a very low rate of lubricant supply, the friction resulting from the textured surface is higher than that of the flat surface.
14
addition, attention was drawn to the effect of the lubricant properties on the results.
Dumitru et al. [47] investigated the effects of micro dimples on steel disks under mixed lubrication conditions. The micro surface texturing dimples were arranged in arrays of micro-holes as shown in Figure 1-6. The diameters ranged between 50 to 100 µm and the depths were between 5 to 8 µm. The spacing distance of the holes ranged between 30 to 60 µm. The study showed eight times the improvement of the lifetime of the samples. The lifetime of the sample was defined as the sliding distance at which the coefficient of friction increased rapidly and reached the coefficient of friction of an un-textured surface.
Figure 1-6: Circular Dimples Arranged in a Square Pattern[47].
15
contained in the grooves. Friction also decreased with the groove depth to a point, after which increasing the depth had no effect. They deduced that wear debris fell into the surface depressions. The particles first gathered around the edge of a dimple and then built inward and downward, not necessarily ever reaching the bottom. Once the depth of the groove was below the lowest particle size that the wear particles could reach, there was no benefit to creating a deeper groove.
1.6 Applications of Surface Texturing
16
Figure 1-7: Surface Texturing in Different Applications[49]
1.6.1 Surface Texturing in Automotive Components
17
face seals. Anno et al. [51] verified that higher load carrying capacities were achieved when only one of the parallel surfaces of the rotary shaft face seals had micro-asperities in the form of cylinders.
Willis [35] used surface texturing in cylinder bores of a combustion engine. Wakuda et al. [25] investigated the influence of textured micro dimples on nitride silicon ceramic plates, which are used as a structural element in automotive engines, in contact with the hardened steel cylinder. Different texture densities, texture shapes, and texture sizes were investigated, but the texture depth was kept constant at 5 µm. Abrasive jet machining and excimer laser beam machining were used to fabricate the micro dimples with circular and angular profiles, respectively. Pin-on-disk tests were performed to measure the coefficient of friction under boundary and mixed lubrication conditions. A reduction of 20% in the coefficient of friction was obtained. The optimal texture parameters were identified as a texture size of 100 µm and a texture density of 5 to 20%. The texture shape was recognized as an insignificant factor.
18
Etsion et al. [4, 7, 42, 52-53] and Yu et al. [54] used laser surface texturing on mechanical face seal rings. The results showed a significant reduction in frictional losses. The effect of the surface texturing on the friction losses by the cylinder liner-piston ring system, which was estimated at 30% of the total engine friction[55], was addressed in [9-10, 43, 45]. Friction was reduced by 30% through laser surface texturing of the cylinder liner.
Figure 1-8: Partial surface texturing of a stator (a) in contact with plain rotor (b) [4]
1.6.2 Surface Texturing in MEMS Applications
Due to the high surface to volume ratios in MEMS, surface forces play a crucial role in adhesion and high friction between contacting surfaces. In such systems, lubrication is not an option; therefore, attention has been paid to surface texturing as an effective means to control both adhesion and friction [56].
19
Tayebi and Polycarpou [56, 58] examined the effects of surface roughness, asymmetry, and peakiness on the adhesion and friction coefficients under low external normal forces. It was found experimentally and analytically that as the surface roughness, asymmetry, and peakiness of the contacting surfaces increased, the coefficient of friction and pull of force were reduced by an order of magnitude.
1.6.3 Surface Texturing in Metal Forming
Rivin [59] proved that surface texturing also increased the static contact pressure, so this surface modification approach could effectively increase the stiffness of tool fixtures. In stainless steel sheet forming, the study of Wiklund et al. [60] showed a linear relationship between the surface roughness of the blank and the coefficient of friction.
20
Figure 1-9: Textured Inserts of Wire Drawing Dies [3]
1.7 Summary
21
It is obvious that the identification of significant texture parameters is inconsistent, and the minimum texture parameters widely vary for all wet and dry conditions. Etsion [2] stated that most studies done in the dry condition were based on trial and error, since there is no clear theoretical foundation that explains the mechanisms involved in dry sliding. Therefore, finding optimum texture parameters that reduce friction is very challenging.
In this study, the friction of the dry sliding contact is addressed, and the effect of surface texture on dry friction is explored. In addition, the most significant texture parameters of the dry sliding contact are sought.
1.8 Research Objectives and Approach
In this thesis, the control of the friction of dry sliding contact through micro surface texturing is the main objective. To accomplish this objective, a thorough analysis of the mechanisms involved in dry sliding conditions is made. Then, the most significant surface texture parameters that control the coefficients of friction are identified. Finally, the optimal range of the significant surface texture parameters that minimize friction is sought.
22
actual rough textured surfaces, and get the closest comparison to the real surface, so that accurate clues are obtained. Then, 3-D finite elements models of various textured surfaces in contact with a rigid spherical indenter are developed. The effects of different texture parameters, such as texture size, density, shape, and anisotropy on coefficient of friction are addressed, and the most significant surface texture parameters at which the coefficient of friction is minimum are determined. Actual textured samples of air hardened tool steel are then fabricated using two methods, laser ablation and photolithography. The coefficients of friction and pull off force are measured using a scratch tester and atomic force microscope, respectively. Finally, the outputs of the numerical analyses are benchmarked to the experimental outcomes, and the micro surface texturing parameters at which the coefficient of friction is minimum are verified.
1.9 Dissertation Outline
Chapter 1 first introduces the problem of friction and reviews the effect of surface texturing on friction. It then presents the motivation and significance of this research. Finally it describes the objectives and the approaches followed to accomplish the objectives.
Chapter 2 reviews the friction mechanisms involved in dry contact, and it presents an analytical proof that shows that a minimum friction force exists at a certain range of real contact area.
23
In addition, 3D numerical models that extensively examine the effects of all the texture parameters under dry normal sliding contact on the coefficient of friction components are developed.
Chapter 4 shows the effects of the circular texturing, which are fabricated by the laser ablation technique, on coefficients of friction.
Chapter 5 presents the effect of hexagonal patterns, which fabricated by photolithography, on the coefficients of friction.
Chapter 6 addresses in detail the effects of surface texturing on the adhesion force.
24
Chapter 2
T
HEORY ANDA
NALYTICALA
PPROACHIn this chapter, the friction mechanisms of the dry static and sliding contacts are reviewed, and an analytical proof also derived to show that a minimum friction force can be obtained through optimizing the real area of contact. Hence, the surface texturing parameters are designed accordingly.
2.1 Dry Friction Mechanisms
In 1942, Bowden et al. [63-65] made a micro-examination of the sliding surfaces under the dry condition, and they suggested that the friction forces between two clean contacting surfaces were made up of two components. The first force component is the force required to shear the junctions formed between the surfaces when they were brought into contact. The second was the plowing force that was responsible for displacing the softer material from the path of the harder material, or in other words, the force that was responsible for the plastic flow or the plastic deformation [63-66]. Persson [67] defined the coefficient of friction as a ratio between the shear strength of the softer material and the flow pressure, which was defined as a pressure that required initiating the plastic flow under compressive stress.
25
contact and the real area of contact, which is a very small fraction of the nominal area.
Figure 2-1: Real Area of Contact vs. the Apparent Area of Contact [67]
The friction force depends on the real area of contact, and it is equal to the shear strength of the formed junctions integrated over the real area of contact [67]. Bowden and Tabor [63-65] assumed that the two mechanisms that are involved in dry sliding are independent; therefore, the two resulting forces can be added together as in Equation 2.1 [68].
(2.1)
Where FFriction is the total frictional force resulting from sliding, Fadh is the
frictional force component resulting from shearing the adhesive junctions, and Fdef is the frictional force responsible for the mechanical deformation which
26
Figure 2-2: The Contact of Two Sliding Surfaces Relative to Each Other[69]
Bowden and Tabor as cited by Bhushan in [[68] related the frictional force to the interfacial shear strength and the real area of contact as shown in Equation 2.2.
(2.2)
The interfacial shear strength is assumed to be the bulk shear strength of the softer material, and if the interfacial shear strength exceeds this, it means that the contact asperities of the softer material fracture.
27
forces required for the micro scale deformation which occurs locally at the contacting spots. The former force is called the adhesion force, while the latter force is called the mechanical deformation force. An additional type of force might appear if one of the surfaces is harder than the other. This force is called the plowing force, which results from plowing the harder material through the softer material causing macro scale plastic deformation or grooving.
Tabor [70] highlighted three elements that are involved in the friction of the dry sliding contact. They are the true area of contact between the mating surfaces, the type and the strength of the bonds formed at the interface, and the way in which the materials in and around the contacting spots are sheared or ruptured during sliding.
Figure 2-3: The Surface Forces of the Chang et al. Model[71]
28
(2.3)
Where is the maximum tangential force needed to shear the formed junctions at the interface, and F is the normal external force that includes the balance of the actual contact load P, and the intermolecular forces, . The actual contact load, P is related to the real area of contact and the material properties, therefore it determines the deformation mode of the contact, whether it is elastic, elastic-plastic, or fully plastic. The adhesion force depends on the type of bonds formed and the real area of contact. Chang et al. [72] used a statistical representation of the rough surface and calculated the required static frictional force to shear all junctions between contacting asperities, taking into the account the asperities of normal preloading. The shortcoming of this model is considering the static friction force as a plastic yield failure mechanism. This means that the junctions fail at the onset of the first yield point, ignoring the ability of the elastic-plastic deformed asperities to withstand additional loading before failure. Kogut and Etsion [73-74] overcame this limitation by modeling the elastic-plastic deformation mode numerically, and demonstrated that the contacting asperities could carry additional loading after the first yielding before they fractured.
29
characterized by a single parameter, which is the friction coefficient. The coefficient of friction was classified based on the involved mechanism, whether it is due to adhesion, mechanical deformation, or plowing. It was also classified based on the deformation mode, either elastic or plastic [68] classified the deformation which occurred in the mating surfaces based on the scale of interaction. The microscopic interaction involved either elastic or plastic deformation that was characterized by the displacement of interlocking surface asperities, while macroscopic interaction included plow (plough) grooves in the softer material by the harder material or by wear debris through plastic deformation. Nevertheless, it was stressed that all frictional components in all length scales and deformation modes depended on the real area of contact and the shear strength during sliding contact.
Based on the previous review, a couple of conclusions can be drawn. First, there are two components of friction, one component is due to intermolecular forces and another component is due to mechanical deformation. Second, both components depend on the real area of contact.
30
2.2 Adhesion Component of the Friction Force
The adhesion component of friction results from overcoming the junctions which are formed due to the surface forces. Many researchers have investigated the factors that influence adhesion on friction force. Bhushan [68-69] highlighted that the adhesion force is affected by real area of contact which is a function of the normal load, surface roughness and mechanical properties. McFarlane and Tabor [78-79] defined the relationship between the surface topography, material properties, the real area of contact and adhesion as a result. Materials with higher roughness, high modulus of elasticity, higher hardness, and lower ductility exhibit lower real area of contact which results in lower adhesion. Besides, the normal and tangential loading increase the real area of contact due to the increase in the plastic flow. In addition, the real area of contact increases as a result of the interatomic attraction, such as van der Waals bonds [80-81].
There are two types of interactions between molecules that could contribute to the adhesion at the intimate contact surfaces: either physical or chemical in nature. Physical interaction involves van der Waals bonds while the chemical interactions involve covalent bonds, ionic bond or electrostatic bonds, metallic bond and hydrogen bonds [68].
31
load is applied. For ionic or electrostatic bonds, they are significantly based on the separation distance between the mating surfaces. If the separation distance between two ionic materials is less than or equal to atomic spacing, the bonds resemble that within the bulk materials. Whereas for separations larger than the atomic dimensions, the bond appears electrically neutral and the net Coulombs force is very small compared to van der Waals bonds. If two ionic surfaces slide over each other, this increases the fraction of the surface area charged, and consequently increases the electrostatic force. This is commonly called the "triboelectric" effect.
When two clean metals come together with a separation equals to the atomic distance, metallic bonds are formed along with short range repulsive forces which results in final equilibrium between the two metals. The metallic bonds are usually affected by the degree of cleanliness, surface roughness, the material ductility, crystallographic planes, and atomic structure.
The higher the surface cleanliness, the higher the adhesion force due to metallic bonds is. Nevertheless, the surface roughness has an opposite effect.
The ductility of the metal plays a crucial role on the adhesion force due to the increase of the plastic deformation which results in increase of the contact area.
32
in contact with themselves than single crystal metals in contact with themselves. This highlights the effect of the grain boundary energies [68].
The previously mentioned bonds are relatively strong primary bonds while van der Waals forces are weak secondary bonds. Van der Waals forces encompass three forces from different origins. The dominant type is called dispersion or London force, and it is due to instantaneous dipole moments of all atoms and molecules. In general, electrons around the nucleus oscillate, generating a fluctuating dipole field. This field interacts with the nearby atoms, inducing a substantial instantaneous dipole moments in them which are always attractive. This force exists between all materials since all atoms have oscillating electrons.
The second type is referred to as Keesom force, which results from attraction between rotating permanent dipoles. The third type is known as Debye force, and it originates from interaction between rotating permanent dipoles and polarizability of all atoms and molecules [82].
33
The first mathematical approximation of the adhesion force between two arbitrary undeformable spheres of radii , r1 and r2 , was provided in 1934 by
Derjaguin, and it is equal to :
(2.4)
Where Wa is the work of adhesion
The work of adhesion is a function of the distance (a) between the two surfaces which are brought in contact. This distance (a) is a function of surface curvature, mechanical properties, external load, and surface forces.
The JKR model was developed by Johnson, Kendall, and Robert [83], and it is based on Hertz contact problem. This model predicted larger contact area than Hertz model, and assumed that the adhesion forces existed inside the contact area only. The contact radius was estimated in the absence of the external load as follows:
(2.5)
Where E* is the equivalent elasticity modulus of the two surfaces.
And the adhesion force was defined as
34
From equations (2.5) and (2.6), it can be understood that the adhesion force increases non linearly with the increase of the contact radius.
Derjaguin, Muller, and Toporov [84] followed the same approach of the JKR but they assumed that the adhesion force acts outside the contact area, and can cause local deformation. They estimated the adhesion force as in equation (2.4), which increases non linearly with the increase of the contact area as with JRK model.
35
2.3 Mechanical Deformation Component of Friction Force
The mechanical deformation component of the friction that occurs during sliding is influenced by the surface roughness, real area of contact, surface contamination (including wear debris), and the mechanical properties of the materials in contact, such as yield strength, hardness, and modulus of elasticity. The deformation component is proportional to the surface roughness and the hardness of the materials, and it is inversely proportional to the contact area and the surface contamination. In sliding contact, adhesion and mechanical deformation are always present, yet the plowing component might or might not be present depending on surface roughness, relative hardness of the materials involved in the contact, the characteristics of the wear debris, or the contaminating particles in between the sliding surfaces.
2.4 Micro Surface Patterning as an Effective Means for
Controlling Friction
36
2.5 Analytical Proof that Friction Force Has a Minimum Value
37
Figure 2-4: The Friction Force Components vs. the Contact Area
In order to prove that a minimum overall coefficient of friction exists, the derivative of the overall frictional force in Equation 2.1 should exist, and should be zero.
Where is the friction force which results from adhesion, is the
friction force which results from the mechanical deformation, and both are a function of the real contact area A.
(2.7)
(2.8)
38
(2.9)
On the other hand, the mechanical deformation is inversely proportional to the contact area A,
(2.10)
Therefore, a minimum frictional force can be achieved at a specific contact area Ar, if
(2.11)
Or
(2.12)
Equation (2.12) is trivially satisfied if
(2.13)
39
and
(2.14)
But
(2.15)
(2.16)
40
2.6 Conclusion of Dry Friction Mechanisms
41
Chapter 3 N
UMERICALS
IMULATIONS FORT
EXTUREDS
URFACESNumerical simulations using the finite element method are considered to be one of the most powerful approaches for the prediction of the tribological behaviour, because they are both time and cost efficient. In addition, they can be used as predictive tools to explore new designs, understand the involved friction mechanisms, and identify and optimize the critical parameters. In this chapter, a review of the numerical simulations which tackled the contact of two sliding surfaces is presented, followed by initial 2D plane strain finite element models that simulate the contact between a rigid surface and engineered textured surfaces. Fractal geometry is used to properly simulate the topographies of the engineered surfaces in the 2D finite element models. Finally, 3D finite element models are developed to simulate the contact between a rigid spherical indenter and elastic, fully-plastic textured surfaces. These models investigate the effects of the pattern geometry, density, and shape on the friction coefficients.
3.1 Background of the Analytical and Numerical Contact
Models
42
Therefore, the Hertz model usually gives misleading results for the contact properties. Many studies have been undertaken to investigate the surface interactions during normal loading and sliding extended beyond the limitations of the Hertz model. Greenwood and Williamson [89] developed a model which calculated the contact properties, such as contact pressure and real area of contact between two nominally flat surfaces. This model has been known as GW model. Greenwood and Tripp [90] modified the basic GW model by exploring the properties of the contact between two flat rough surfaces instead of smooth surfaces. Many analytical models [72, 91-97] were based on the Greenwood and Tripp model [90], and incorporated more realistic surface properties. However, those analytical models are computationally complex and involve many approximations and assumptions.
With the advancement of computational capabilities, various numerical analyses have investigated the contact behaviour between a rigid surface and elastic, elastic-plastic, or fully plastic surfaces.
43
Faulkner and Arnell [99-100] incorporated the results of the 3D finite element model of two elastoplastic hemispherical asperities into a statistical model that was used to predict the effects of the surface roughness on the overall friction coefficient.
Jackson and Green [101] presented a normalized 2D axi- symmetric finite element model of an elastic fully-plastic hemisphere in contact with a rigid flat surface. A precise form for the critical interference at which the plastic deformation was initiated was determined based on the von Mises yield criterion.
44
depended on the type of contact, indentation or sliding, coefficient of friction and the dominant deformation mode in the surface layer.
Wang and Zhu [20] introduced the term of “virtual texturing” for a numerical tool that was able to determine the basic geometric features of the surface texture. Correlations were found between the lubricant film thickness, and the contact ratios with the dimples' size, density, shape, and depth.
Gong and Komvopoulous [107] developed plane strain finite element analyses for patterned layered media to investigate the effects of the pattern geometry, such as meandered and sinusoidal patterns, on-contact pressure distribution, tensile surface stresses, and subsurface equivalent plastic-strain. A rigid cylindrical asperity slid on the patterned layered media under normal loading, and a relationship for the contact pressure concentration factor was defined. The same group [108] developed a three dimensional finite element model of a rigid sphere indenter in normal and sliding contact with an elastic-plastic layered medium with equally spaced rectangular pads. The effects of patterning on the contact pressure distribution, sub-surface stress-strain fields, and thermal stresses were identified.
45
exhibited normal pressure spikes, while the discontinuous coating with the crowned profile reduced or eliminated the normal pressure singularities.
With the advancement of computational capabilities and measurement devices that inspect surface topography, various models have been developed to measure the roughness of the surfaces. Roughness measurements of many engineered surfaces show that the power spectra of engineered surfaces follow power laws [110]. Such engineered surfaces are processed by turning, drilling, electrical discharge machining, grinding, and rubbing [111]. This means that when the surface sufficiently is magnified, the magnified surface looks very similar to the original surface. This property can be modeled using the concepts of self-similarity and self-affinity of fractal geometry.
Different fractal models in the literature have been used to define engineered surfaces but the most common fractal model is Weierstras -Mandelbrot (WM) functions. The two dimensional WM functions are defined as follows:
(3.1)
46
Komvopoulos and Ye [113] used a 3D Weierstrass-Mandelbrot (W-M) fractal function to characterize the layered interface of the hard disk. This function is continuous at all points. Sahoo and Ghosh [114] used the 3D modified W-M function to develop a parametric study to relate the contact properties such as contact area, contact displacement, and contact load with the key material properties and surface parameters. Jiang et al. [111] incorporated experimentally measured topography by the Atomic Force Microscope, and used them as inputs to determine the spatial power spectra of the profile. From the spatial power spectra, the fractal dimension was determined and the surface topography was simulated. A ground surface was used in this study as an example.
Warren et al. [115] used the deterministic fractal cantor set to model the perfectly plastic rough surface in contact with a rigid smooth indenter. A brief description of the cantor set is explained in the next section as it is used in the prediction of the optimal surface texture parameters.
47
3.2 Two Dimensional Models for Prediction of the Significant
Texture Parameters
In this section, the effect of the surface texture geometry on the coefficient of friction is investigated. Two-dimensional plane strain finite element models are developed with different surface texturing parameters.
3.2.1 Cantor Set
The Cantor set has two scaling parameters such that the width Ln+1 and
the height hn+1 are given by
(3.2)
(3.3)
where and >1, and Lo and ho are the initial width and height of the surface
profile.
The Cantor set surface [115-116] which is shown in Figure 3-1 is constructed by joining the segments of the successive stages of the Cantor set. At each stage, the middle sections of the initial segments are removed so that
the lengths of the remaining segments are multiplied by the length the initial
segment. The same manner is followed in the vertical direction.

![Figure 1-4: Excimer Laser Beams[19] ](https://thumb-us.123doks.com/thumbv2/123dok_us/1423256.1174865/32.612.161.490.65.434/figure-excimer-laser-beams.webp)
![Figure 1-6: Circular Dimples Arranged in a Square Pattern[47]. ](https://thumb-us.123doks.com/thumbv2/123dok_us/1423256.1174865/38.612.189.464.367.573/figure-circular-dimples-arranged-square-pattern.webp)
![Figure 1-7: Surface Texturing in Different Applications[49] ](https://thumb-us.123doks.com/thumbv2/123dok_us/1423256.1174865/40.612.116.518.78.556/figure-surface-texturing-different-applications.webp)
![Figure 1-9: Textured Inserts of Wire Drawing Dies [3] ](https://thumb-us.123doks.com/thumbv2/123dok_us/1423256.1174865/44.612.118.541.75.283/figure-textured-inserts-wire-drawing-dies.webp)