ABSTRACT
FIELD, STACEY ALLYSON. Exploring the Relationship between Cognitive
Characteristics and Responsiveness to a Tier 3 Reading Fluency Intervention. (Under the direction of Dr. John Begeny.)
fail to support a “continuum of severity hypothesis” as it is described in prior research and
Exploring the Relationship between Cognitive Characteristics and Responsiveness to a Tier 3
Reading Fluency Intervention
by
Stacey Allyson Field
A dissertation submitted to the Graduate Faculty of North Carolina State University
in partial fulfillment of the requirements for the Degree of
Doctor of Philosophy
Psychology
Raleigh, North Carolina
2015
APPROVED BY:
_____________________________ _____________________________
Dr. John Begeny Dr. Patricia Collins
Chair of Advisory Committee
_____________________________ _____________________________
ii
DEDICATION
iii BIOGRAPHY
iv
ACKNOWLEDGEMENTS
Endless thanks to the many people who supported this project and encouraged me to keep going despite setbacks, and in particular, Dr. Patricia Collins, Dr. Sarah Vess, Dr. John Begeny, Dr. Scott Stage, Dr. Denis Gray, Dr. Dawn Henderson, Dr. Myriam Sollman, and Mrs. Cristina Carrillo. This study would not have been possible without the patience and motivation of our elementary school administrators and support staff who welcomed this study and multiple research assistants in to the buildings. Last, thank you to the research assistants, led by Ms. Sierra Patterson and Ms. Briana Pennington, who volunteered countless hours to attending trainings, providing intervention, and contributing to the literacy
v
TABLE OF CONTENTS
LIST OF TABLES ... vi
LIST OF FIGURES ... vii
Introduction ... 1
Cognitive Characteristics of Intervention Response ... 2
Responder Research for Oral Reading Fluency ... 4
Current Status of the Research Base and Limitations ... 6
Present Study ... 12
Methods ... 13
Participants ... 13
Assessment Materials ... 16
Intervention Materials ... 22
Procedure ... 23
Criteria for Responder Designations ... 24
Statistical Analysis ... 27
Results ... 27
Discussion ... 29
Which Cognitive Variables Differentiate Responder Groups? ... 30
Do Findings Support a Continuum of Severity Hypothesis? ... 33
Does Response Determined by Relative Growth in WCPM Alter Findings? 34 Limitations and Implications for Future Research ... 36
References ... 51
APPENDICES ... 63
Appendix A: HELPS One-on-One Program Implementation Flow Chart ... 64
vi
LIST OF TABLES
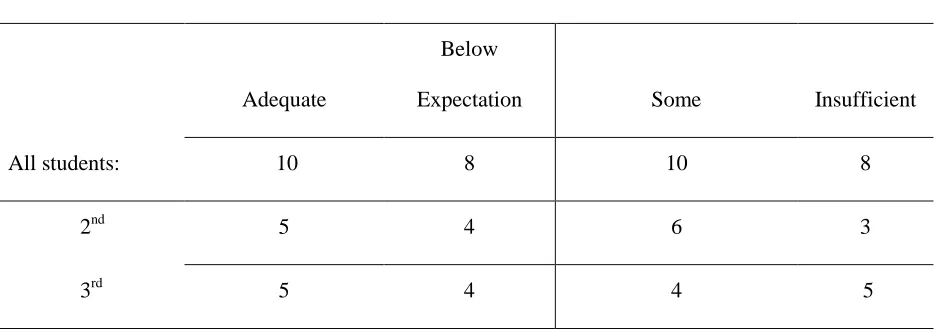
Table 1 Number of responders by grouping variable. ... 43
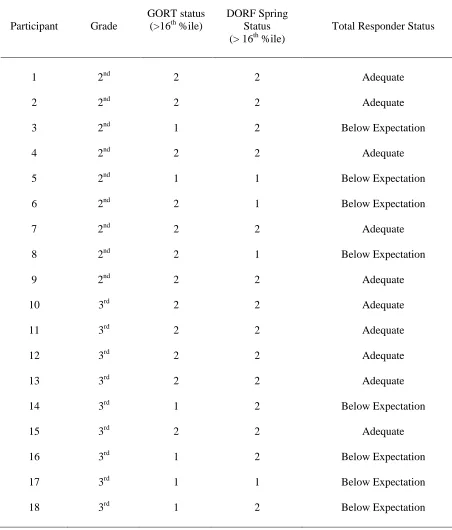
Table 2 Responder Status by GORT-5/DORF performance. ... 44
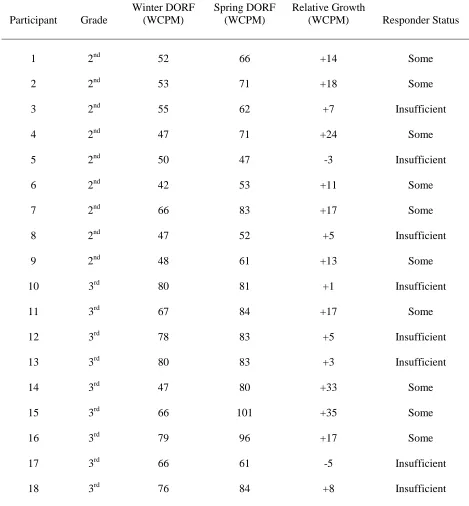
Table 3 Responder status by relative growth performance. ... 45
Table 4 Mean standard scores on cognitive variables based on responder status. ... 46
vii
LIST OF FIGURES
1 Introduction
For decades, researchers have studied the cognitive underpinnings of reading by considering a myriad of cognitive processes upon which discrete reading skills are built (e.g. LaBerge & Samuels, 1974; Orton, 1939; Stanovich, 1984; Wolf & Bowers, 1999). Assumed within this area of study is the notion that individual differences in cognitive functions are related to observed variation in reading outcomes, including reading disorders (Fuchs, Compton, Fuchs, Bryant, Hamlett, & Lambert, 2012; Johnson, Humphrey, Mellard, Wood & Swanson; 2010; Reiter, Tucha & Lange, 2005; Vellutino, Fletcher, Snowling, & Scanlon, 2004). To identify such differences, the National Association of School Psychologists (NASP) and the Learning Disabilities Association of America acknowledge the potential value of integrating cognitive assessment within a Response to Intervention (RTI)
framework. In particular, they note that cognitive data can help facilitate intervention selection and support making an accurate determination of a student’s educational needs (Hale et al., 2010; National Association of School Psychologists, 2007).
Research also suggests that performance on a narrow band of particular cognitive processes is consistently associated with reading outcomes. For example, phonemic awareness and phonological processing are two of the strongest predictors of reading achievement (Ehri, 1987; NICHD, 2000; Rack, Snowling & Olson, 1992), and Wolf and Bowers’ (1999) work highlighted the additional predictive validity of rapid automatized naming (RAN). Subsequent studies support the Wolf and Bowers model (e.g. Kirby, Georgious, Martinussen, & Parrila, 2010), while also recognizing the contribution of additional factors, including verbal knowledge/comprehension, (Berninger, Abbott,
2
Stage, Abbott, Jenkins, & Berninger, 2003); orthographic processing, (i.e. letters; O’Brien, Wolf, Miller, Lovett & Morris, 2011; Wood, 2009;), visual-verbal paired associate learning (PAL), (i.e. Warmington & Hulme, 2012), working memory and executive functioning, (Altemeier, Abbott and Berninger, 2010; Berninger et al., 2006; Mayes, Calhoun, Bixler & Zimmerman, 2009; Reiter, Tucha & Lange, 2005; Swanson & Siegel, 2001), and processing speed (Catts, Gillespie, Leonard, Kail, & Miller; 2002).
Cognitive Characteristics of Intervention Response
Prior to individual assessment of cognitive processes, many educators in the U.S. have turned to implementation of an RTI model, which aims to differentiate amongst students with mild to moderate academic weaknesses (largely due to missed learning
opportunities or ineffective instruction) and those with persisting learning difficulties that are likely to require sustained intervention. In joining the primary goals of both RTI and
individual assessment of cognitive processes, an area of research emerged. The “responder” research attempts to model the ways in which unique cognitive factors predict student success with selected interventions. This direction differs from prior research efforts, in that the focus is no longer to use cognitive data to predict student’s later reading achievement, but on using such data to predict a student’s likelihood of benefiting from particular instructional practices within a reasonable period of remediation. An advantage of the focus on responder patterns is twofold: first, students could potentially be best matched with intervention suited to meet their unique needs, given a particular cognitive profile, and second, cognitive data would serve a confirmatory role in making the diagnosis of a reading disorder.
3
with each study tend to employ different schedules of intervention and target a range of skills for remediation. However, a review of the literature converges on a combination of cognitive factors consistently associated with students’ intervention response. Plainly stated and
perhaps unsurprisingly, cognitive factors that are associated with reading outcomes also seem to predict responder status.
Vellutino, Scanlon, Sipay, Small, Pratt, Chen, et al. (1996) found significant
differences between good and poor responders to supplemental reading instruction (K-2), as measured by sight word reading tasks. The poorest readers, and those most difficult to remediate (i.e., those scoring below the 15th percentile on academic tasks and representing less than 2% of the student sample), demonstrated significantly lower abilities than a typically performing group on measures of phoneme segmentation, rapid articulation, rapid object naming, PAL, verbal working memory, and phonological memory. In contrast, these readers were not significantly different on semantic, syntactic, or visual processing tasks.
Berninger et al. (2002) provided intervention to struggling 1st grade readers. Intervention consisted of two 20-minute sessions a week, over a four month period, and incorporated instruction in key areas of reading skill, including phonics, spelling and
4
the contribution of verbal IQ. More importantly, results indicated that students with impairment in two or all three areas demonstrated the slowest intervention response.
Nelson, Benner, and Gonzalez’s (2003) meta-analysis of 30 studies built upon Al Otaiba and Fuchs (2002) existing review of individual cognitive characteristics that are tied to reading success. They evaluated intervention responsiveness for remediation programs targeting early literacy, and selected studies that included various dependent variables (i.e. reading outcomes) that “represent[ed] the range of characteristics and associated sub-characteristics addressed by researchers” p. 258). Based on 30 such studies, primary learner characteristics associated with intervention success included (listed in order of effect size): RAN (.51), behavior problems (.46) phonological awareness (PA) (.42), letter knowledge (.35), memory (.31), and IQ (.26).
Responder Research for Oral Reading Fluency
Studies have more recently begun directly employing oral reading fluency as an outcome measure and targeted area for intervention in the context of the responder research. Investigation of reading fluency is critical, given its strong relation to literacy outcomes, especially for reading comprehension (McCardle & Chabbra, 2004). Because reading trajectories of good and poor readers tend to diverge around third grade, and given that reading fluency becomes a primary focus of instruction around second grade, a small window of opportunity exists wherein early identification and intervention for this critical subskill is possible (i.e. before struggling students fall increasingly behind their peers; Chall, 1996; Good, Simmons & Smith, 1998; Speece & Ritchey, 2005).
5
response to intervention. Barth, Denton, Stuebing, Fletcher, Cirino, Francis, Vaughn (2010) provided intervention consisting of small group support for phonics, vocabulary, daily reading practice, and comprehension to 174 struggling 1st graders and compared their achievement with 62 controls on measures of oral reading fluency and decoding skill. They found evidence for several responder types (e.g., those with persisting decoding and fluency deficits and those with only fluency deficits). Measures of PA, RAN, and verbal knowledge (i.e. measure of verbal ability) differentiated the fluency deficit group from good responders and typical controls, although the profiles of decoding/fluency and fluency-only deficit groups were not significantly different.
Fletcher, Stuebing, Barth, Denton, Cirino, Francis and Vaughn (2011) provided small group intervention for 189 at-risk students for approximately 30-minutes per day, 2-4 times per week, for 8-16 weeks. Intervention consisted of work in phonemic awareness, decoding, fluency, and comprehension, from a manualized intervention program (i.e. Read Well; Sprick et al., 1998). Post intervention, students were re-classified into three groups based on their performance on several outcomes measures that highlighted either adequate response (n = 85), persisting deficits in fluency (n = 75), or deficits in fluency and decoding (n = 29). Their response was contrasted with typically achieving controls (n = 69). PA explained the most variance for all responder groups. Similarly to the Barth et al. study (2010), students in the resulting decoding/fluency dual-deficit group were significantly poorer on measures of PA, RAN, and syntactic working memory compared to all other groups.
6
the “rate of program coverage” was considered a significant covariate that was not sufficiently controlled. Specifically, the number of units within the intervention that were covered from group to group varied, such that intensity of intervention could no longer be considered consistent across groups. The authors note that further studies should more carefully address potential variation of intensity in the delivery of intervention.
Current Status of the Research Base and Limitations
Several gaps in the literature preclude practitioners’ ability to incorporate the findings of the responder research into validated and relevant school-based practices for intervention selection and (potentially) incorporation into a reading disability identification model. A primary limitation is that research has yet to sufficiently integrate what is known about cognitive predictors and responder status with current school practices involving multiple rounds of intervention. RTI incorporates not one supplementary intervention, but at least an additional round of support for students who do not respond to Tier 2 efforts. Tier 3
intervention is characterized by increased intensity and/or frequency of instruction, and optimally on an individual basis (Johnson et al., 2006). A logical progression of the
7
most compromised and/or atypical profiles of cognitive function associated with reading success. Since prior studies have not “screened” through these students by incorporating a third Tier of intervention, results may have reflected unaccounted for heterogeneity, even within groups of poor responders.Although some studies have attempted to alter the schedule of instruction for students, including modifications of intervention intensity, they did not provide intervention in successive rounds, along the expected continuum of services offered within an RTI model (Denton et al., 2011; Fletcher et al., 2011).
A recent study by Denton, Tolar, Fletcher, Barth, Vaughn and Francis (2013) addressed this by studying 47 children who had failed to respond to Tier 2 intervention in Grade 1. Then, in Grade 2, a small, randomized group of these children received intensive Tier 3 intervention that provided word level reading, oral reading fluency, vocabulary, and comprehension practice during daily, 45 minute intervention sessions that persisted for 24-26 weeks. Cognitive variables with the greatest perceived influence on responder status included PA and listening comprehension. Students with inadequate response were poorest on all language measures, both after Tier 2 and Tier 3 intervention.
The results of the Denton et al. (2013) address a critical component of evaluating the dynamic between cognitive assessment and intervention responsiveness by addressing Tier 3 performance. Furthermore, the authors argue for fine-tuned individualization of reading instruction for struggling readers that is at the core of a Tier 3 level of remediation efforts within an RTI framework. They note that:
evidence-8
based reading instruction; however, the effects of individualized reading interventions for primary grade students have seldom been studied (Denton et al., 2013, p.634). Students in the Denton et al. (2013) study received instruction in various domains of reading on an “as needed” basis. This flexible approach allowed interventionists to partition time accordingly to focus on a student’s greatest area of need (e.g. supplementing the Read Naturally program for students whose reading deficits were primarily fluency-based). Yet, this study did not specifically address intervention content and duration. The amount of time spent targeting oral reading fluency, and/or other skill deficits, is not described with
sufficient detail. Subsequently, it is not known if treatment conditions were sufficiently similar (or dissimilar) for all students. This is problematic for the purposes of the research because it is unclear if students with the same skill weaknesses received the same amount of instruction in a given area. A second and related limitation of this study is that it did not describe the exact criteria used to determine when intervention needed to be modified, and to what extent. Without explicit clarification of the decision rules used to differentiate
instruction for students, treatment validity (or, “the degree to which an independent variable is implemented as intended...” Gresham, Gansle, & Noell, 1993, p. 257) cannot be
established. More importantly, without use of consistent methods for allocating an amount and/or type of instruction provided to students, patterns of response and assessment of contributing cognitive characteristics may have been obscured.
9
addressing responder characteristics for students receiving Tier 3 reading interventions. Second, without specific and standardized intervention, a focused inspection of reading profile subtypes cannot be completed. One cannot truly purport to evaluate the cognitive characteristics and response patterns of inadequate responders at a Tier 3 level, even if assuming a primary fluency deficit, when the response itself is based upon a potentially inconsistent treatment.
A related limitation of earlier research is the focus of intervention efforts. In the aforementioned studies, interventions were described as targeting multiple reading skills (e.g. phonics, fluency, comprehension, etc.) This practice is consistent with treatments utilized in a “design experiment,” wherein, “instruction is aimed at all the components thought necessary to achieve an instructional goal” (Stage et al., 2003, p. 26). However, this approach may lay in direct conflict with the primary goals and conceptualization of RTI—namely, to identify one or more specific areas of need and to address the need with targeted intervention. Though a broader-based intervention may be considered useful for some students, targeted
intervention is recommended within the model. Johnson, Mellard, Fuchs and McKnight (2006) note that “When a student’s school-wide screening or progress-monitoring results indicate a deficit in a [specific area], an appropriate instructional intervention is
implemented…This is Tier 2 and beyond.” (p. 3.14). It is logical to assume then, that targeted intervention is critical during the RTI process. This potential threat to treatment integrity may actually represent a significant limitation for all studies in the current “responder” research base.
10
the severity of deficits in associated reading skills, and cognitive assessment provides no additional guidance in determining the likelihood of responder status (Denton et al., 2013; Fletcher et al., 2011; Vellutino, Scanlon, Small & Fanuele, 2006). This argument is
conceptually related to findings suggesting that measures of academic achievement (i.e. sight word reading) already are known to serve as strong predictors of reading outcomes
(Torgesen, Rashotte & Alexander, 2001). However, given the need for closer inspection of struggling students receiving fluency intervention within Tier 3, the “continuum of severity hypothesis” fails to account for differentiation in cognitive functions when a specific group of students are targeted with a consistent intervention. By limiting the potential sources of variability that may influence analyses, an evaluation of responders’ cognitive characteristics is statistically less susceptible to sources of error.
Several final questions must also be addressed if students receiving Tier 3 fluency intervention, and their unique cognitive attributes, are to be studied. Researchers need to not only account for specific skill deficits and targeted, intensive intervention, but also to address data-based decision making issues that occur regularly in schools. Questions about how much response a student should show in order to be considered successful (and to make subsequent educational decisions) naturally and frequently are posed within the schools. For example, educators must commonly assess if a student shows little or adequate response. Using only one, dichotomous coding system to describe student response fails to account for different levels of success that are likely to be observed. In a majority of the reviewed
11
directed to provide intervention for multiple skills deficits, nor to progress-monitor multiple skill deficits at either Tier 2 or Tier 3. Stated differently, it would be difficult to understand if a student showed little or adequate response to intervention based on a set of cognitive characteristics, when the nature of intervention is not related to his or her primary area of weakness.
12 Present Study
In an attempt to address several of the previously mentioned limitations, this study sought to answer three research questions. First, which cognitive characteristics are useful in differentiating student response when students with reading fluency deficits are provided with intensive, deficit-specific instruction? Given the large focus on the inclusion of PA and RAN as predictors of reading achievement and responder status in the literature, it is
expected that these scores on these two cognitive processes will be significantly different for the various responder groups. Similarly, because the additional cognitive factors may be implicated in the development of reading fluency (as described in the review of literature, above), it was hypothesized that mean scores on each factor would be significantly different by responder group, though the magnitude of these differences might not be as great as it would be for PA and RAN (i.e. working memory, verbal comprehension, processing speed, orthographic processing, and executive functioning).
Second, using norm-referenced goals, and by setting two responder types as
13
The third research question asked: are cognitive scores still associated with responder status when it is determined by relative growth in oral reading fluency scores (as measured by words read correctly per minute, or WCPM)? Data pertaining to this question provides a different picture of “responder” status because it does not rely solely on achievement of norm and/or criterion-based standards. Because students’ baseline fluency levels upon entering into individualized intervention might vary, using only norm/criterion-referenced standards could obscure significant growth that would fall slightly below a cut-score. For example,
responders who do not reach a specific percentile or obtain a particular benchmark score, but who do show some degree of improvement during the intervention, may not be accurately characterized using only-referenced data. Additionally, both norm/criterion-referenced and growth scores can be used within an RTI framework. No previously identified research has compared the two methods while also considering: (a) cognitive profiles of groups of student responders; (b) primary fluency deficits; and (c) targeted, fluency-based intervention. For these reasons, this final research question was exploratory.
Methods Participants
14
All three schools utilized a county-wide “common core” reading curriculum. As such, all students received similar (if not identical) early reading instruction based on the same instructional materials and for the same amount of time each day. None of the schools provided explicit reading fluency instruction, and no student received supplementary reading support outside of the intervention provided within this study.
Student participants. Eighteen struggling readers in 2nd and 3rd grade met selection criteria, of which 6 were female and 12 were male. Nine second graders with a mean age of 8.01 (SD = 0.45), and nine third graders with a mean age of 9.17 (SD = 0.30) received the Tier 3 intervention. Ten students identified as Black or African American, four as
Hispanic/Latino, and four as White or Caucasian. No students received special education and/or ESL services at the time of the study.
Preliminary participant selection criteria. Students who participated in 10 weeks of Tier 2 intervention 2-3 times per week with the HELPS Small-Group- program (HELPS-SG; Begeny, 2015) were potentially eligible for the current study (n = 78). HELPS-SG requires approximately 20 minutes per session and includes research-supported practice and motivational strategies designed to improve students reading fluency. Because students’ Tier 2 intervention is not the primary focus of this study, the interested reader can find additional details about the HELPS-SG program on the program website:
www.helpsprogram.org/programs_smallgroups.php).
15
performance for 2nd graders was 51.11 WCPM (SD = 6.79), 3rd graders achieved an average of 71 WCPM (SD = 10.85). As a confirmation of reading fluency deficit, students GORT-5 scores all fell at or below the 25th percentile (2nd grade standard score x̅ = 86.11 SD = 2.20, 3rd grade standard scorex̅ = 82.78, SD = 4.41).
Pre-tests for phonics. Pre-test measures confirmed that all participants began Tier 3 intervention with adequate phonics skills, (e.g. standard scores within one standard deviation of the mean; Woodcock-Johnson Word Attack subtest x̅ = 100.5, SD = 6.11; TOWRE-2 Pseudoword Deocoding Efficiency x̅ = 88.8, SD = 4.41).One exception was noted for a student who had difficulty sustaining attention to complete this timed task; her standard score of 80, while below expectation, was inconsistent with her Word Attack standard score of 100. Her classroom teacher corroborated that she had sufficient phonics skills based upon observation. As such, she was deemed appropriate for inclusion.
Interventionists. Twenty-two undergraduates and one psychology graduate student from 4 local universities and colleges were recruited and trained as research assistants
(hereafter referred to as RAs) to provide HELPS One-on-One intervention to Tier 3 students. Although the participating schools had teachers who used or requested to use HELPS for non-study participants, university RAs were used in the present study to best minimize threats to internal validity (e.g., students not receiving the intervention as intended due to high demands of teacher work-load) and to support each school’s intervention needs.
All RAs attended a 4 hour HELPS One-on-One workshop led by a HELPS Certified Trainer. RAs demonstrated 100% mastery criterion of core steps and procedures prior
16
core steps and procedures. Of note, all classroom teachers also completed a formal HELPS One-on-One training program so they would be familiar with the intervention their students would receive, and to help them understand the purpose and scope of the intervention itself. Primary researcher. The primary researcher, one supporting school psychologist, and one graduate student, all with professional training in standardized administration of test measures, conducted assessment of all cognitive and academic pre and post intervention measures. The sole exception to this were DORF data, which were obtained by school personnel as a component of regular school practices. For all measures, participants were assessed individually in small, quiet settings. The primary researcher sanitized and scored protocols, calculated standard scores, entered data and maintained files post-data collection. Assessment Materials
Dynamic Indicators of Basic Early Literacy (DIBELS). Three DIBELS Oral Reading Fluency (DORF) curriculum-based measures, written to reflect a particular grade level (2nd or 3rd grade), comprise the DORF benchmark assessment. Students read all 3 passages, from which a median number of words read correct and incorrect per minute (WCPM & WIPM, respectively) was calculated. This score provides an estimate of oral reading fluency skills for each student. Of note, DIBELS-Next passages are updated and have higher levels of reliability and validity than prior DIBELS passages. Equivalence of same grade-level passages is also improved (Good, Kaminski, Cummings, Dufour-Martel, Petersen, Smith, Stollar & Wallin, 2011). First and second grade passages yield test-re-test reliabilities of .91 over a two-week period. In comparing median fluency scores on DORF benchmarks with the Standard 4th Grade Reading Passage (Daane, Campbell, Grigg,
17
third grade passages, respectively. School personnel obtained DORF data during regularly scheduled benchmark assessment periods.
Gray Oral Reading Tests, Fifth Edition (GORT-5). The GORT-5 is a measure of oral reading ability. It consists of a series of increasingly lengthy and complex passages that students read aloud. Students are timed and scored for accuracy and their ability to answer comprehension questions. Scores are reported along several composites; for the purposes of the present study, only the Fluency composite score was calculated. This score represents both a student’s oral reading accuracy as well as rate. Test-retest reliabilities for the Fluency composite for second and third grade students range from .87 to .92. Estimates of criterion-related validity with the Test of Silent Contextual Reading Fluency is .79 for students ages 6-23 (Wiederholt & Bryant, 2012). Time required to complete this task varied by participant, as some completed more stories before reaching their ceiling; at most, this task required 15 minutes to complete.
Phonics. Students completed Form A of the Word Attack subtest from the
Woodcock-Johnson, Tests of Achievement (WJ-III ACH; Woodcock, McGrew, & Mather, 2001, 2007), to obtain an estimate of their ability to decode of phonetically regular words (phonics skill). One year test-retest correlations for the Word Attack subtest range from .79 to .81 for students ages 4-10, indicating acceptable reliability (McGrew, Schrank &
Woodcock, 2007). Word Attack requires 3-5 minutes to administer. Students also completed Form A of the Psuedoword Decoding Efficiency subtest of the Test of Word Reading
18
administration time for this task is approximately 2 minutes. Test-retest coefficients for the TOWRE range from .83 to .96 (Torgesen, Wagner, & Rashotte, 1999).
Verbal comprehension. The ability to use and understand language serves as both a predictor of reading achievement, and a necessary covariate in understanding reading development (e.g. Berninger & Richards, 2002; Stage et al., 2003; Storch & Whitehurst, 2002). The Verbal Comprehension subtest of the Woodcock-Johnson Test of Cognitive Abilities (WJ-III COG; Woodcock, McGrew & Mather, 2001) briefly assessed participants’ expressive vocabulary and use of verbal reasoning to provide antonyms and synonyms. Split-half reliability coefficients for 6 to 9 year olds range from .88 -.90 (McGrew, Schrank & Woodcock, 2007). In a Confirmatory Factor Analysis (CFA) broad model, the Verbal Comprehension subtest mapped to the Language Development/Lexical Knowledge factor with a loading of .94 (McGrew & Woodcock, 2001). This subtest required 5-10 minutes to administer.
19
cluster with a loading of .69 for students ages 6 – 8, and .70 for students ages 9-13 (McGrew & Woodcock, 2001). With directions and practice items, this subtest required 4-5 minutes to complete.
Working memory. Working memory represents the cognitive construct responsible for mentally retaining information in immediate awareness for active problem solving; this cognitive process has been implicated in reading within various contexts (Berninger et al., 2006; Reiter, et al., 2005; Rose & Rouhain, 2012; Swanson & Siegel, 2001). Working memory has also been described as a framework from which to view the integration of more specific reading-related processes, including phonological and orthographic processes (Baddeley, 2001). Participants completed the Digit Span subtest from the Wechsler Intelligence Scale for Children, Fourth Edition (WISC-IV; Wechsler, 2003). Split-half reliability for this task ranges from.86- .87 for children ages 6 – 9 years. Exploratory and confirmatory factor support the structure of the Working Memory factor for this instrument (correlations of .59 - .68 for 6 to 9 year olds). This working memory task was administered in approximately 5 minutes.
Executive functions. Executive functions represent supervisory processing abilities that “enable an individual to self-regulate and engage in goal-directed behavior,” (Altemeier, et al., 2010, p. 588). Though working memory may represent an aspect of executive
20
and asked to first name them, then indicate the opposite shape or direction, and then switch back and forth from naming to indicating an opposite. For the current study, the Total
Inhibition Completion Time score represented overall performance. Pearson product moment correlations for this score yielded test-re-test stability coefficients of .64 to .80 for 5 to 10 year olds over an average of 21 days; the Inhibition subtest demonstrated moderate correlation with the D-KEFS Inhibition/Switching- Completion Time score of the Color Word Interference subtest ( .50; Korkman, Kirk & Kemp, 2007). The Inhibition subtest required 5 minutes to complete.
Phonemic awareness (PA). The National Reading Panel identifies phonemic awareness as the ability to hear and manipulate discrete sounds in word (McCardle & Chhabra, 2004). The construct of PA represents the ability to hear and manipulate multiple sounds in words using cognitive resources (Stanovich, 1984). To assess PA, participants completed two subtests comprising the Phonological Awareness composite from the Comprehensive Test of Phonological Processing (CTOPP; Wagner, Torgesen, & Rashotte, 1999). The Elision subtest measures one’s ability to repeat a word, and then purposefully eliminate phonemic elements. The Blending Words subtest measures the alternate ability- to blend sounds together into whole words of increasing length and complexity. The internal-consistency for the PA composite ranges from .89 to .96 for 6 to 9 year olds. Criterion-predictive validity over 6 months for the PA composite and the WJ-III ACH Word Attack subtest is .72 for the Elision subtest, and .42 for the Blending Words subtest (Wagner et al., 1999). Collectively, both CTOPP subtests required 5-10 minutes to complete.
21
linguistic stimuli” (Wolf & Bowers, 1999; p. 415). Although conceptualized in various ways (i.e. subsumed within broader phonological processes, orthographic processes, or as a
measure of general processing speed, Kirby et al., 2010; Semrud-Clikeman & Fine, 2008) RAN represents multiple cognitive constructs that are responsible for speeded lexical retrieval—efficient mapping and retrieval of paired phonological and orthographic units. Participants completed both the Rapid Letter Naming and Rapid Digit Naming subtests from the CTOPP. These subtests possess adequate test-retest reliability, with coefficient alphas ranging from .91 to .97 for 5 to 7 year olds, and .72 to .83 for 8 to 17 year olds over a two-week period. Predictive partial correlations between the Rapid Naming composite and the Word Identification subtest of the Woodcock Reading Mastery Tests, Revised (McGrew, & Woodcock, 2001) yielded significant correlations ranging from .53 to .58 (Wagner et al., 1999). Administration time for these subtests was approximately 5 minutes, collectively.
Orthographic processing. The construct of orthographic processing involves, “the formation of visual long-term memory representations of letters, letter patterns, and
sequences of letters that serve to map spatially the temporal sequence of phonemes within words,” (O’Brien, et al., 2011, p. 112). Though the construct of orthography is often
associated with phonics and spelling, it should also be considered when studying oral reading fluency because fluent orthographic processes may be called upon when students encounter new words within text. Orthographic processing also facilitates activation of the proper word and spelling within text. The Receptive Coding subtest from the Process Assessment of the Learner, Second Edition (PAL-2;) was used to assess the individual’s ability to select the correct orthographic forms from memory. The PAL-2 possesses “high” treatment and
22
grades K-3 was .78. Inter-rater reliability for all subtests using objective scoring criteria ranged from .95 - .99.
Intervention Materials
The HELPS One-on-One Program (Begeny, 2009) was the sole intervention used during Tier 3 because the primary objective of this study was to understand students’
response to individualized, targeted intervention. The HELPS One-on-One Program provides systematic, research-based intervention in the area of oral reading fluency, and includes (a) modeled reading by skilled reader, (b) systematic error correction procedure, (c) goal setting (practicing until a criterion is met), (d) performance feedback and graphing, (e) use of systematic praise and a structured reward system, (f) verbal cues to read with fluency, (g) verbal cues to read with comprehension, and (h) repeated reading of ability-appropriate text out loud to an adult at least three times (Begeny, 2009). These eight practice and motivation strategies have been identified in multiple meta-analyses to be the instructional conditions that improve students’ fluency most (e.g., Chard, Vaughn, & Tyler, 2002; Meyer & Felton, 1999; Therrien, 2004). Research supports the effectiveness of the HELPS One-on-One program in multiple contexts with both typical and struggling readers (Begeny, 2011; Begeny, Laugle, Krouse, Lynn, Tayrose, & Stage, 2010; Begeny, Mitchell, Whitehouse, & Harris, 2011; Begeny, Ross, Greene, Mitchell, & Whitehouse, 2012).
Used in conjunction with the HELPS One-on-One instructional procedures, the HELPS curriculum (Begeny, Mann, Cunningham & Tsuen, 2009) consists of 100 passages, with sequenced levels that begin at an early first grade level and slowly increase to
23
from the manualized HELPS Program were used during intervention, track weekly growth, and evaluate treatment integrity (see Appendix A for an overview of core intervention steps). Procedure
Pre-intervention assessment. Students demonstrating persisting fluency deficits after Tier 2 intervention, as evidenced by Winter DORF benchmark performance, completed the GORT-5 as a second measure of reading fluency to provide convergent validity for their participation in this targeted, intensive intervention. Students also completed the two phonics tasks to confirm a rightness of fit within this fluency-only intervention (Word Attack from the WJ-III ACH and Phonemic Decoding Efficiency from the TOWRE). Just prior to intervention onset, students completed the seven cognitive processing measures described above (e.g. WJ-III COG Verbal Comprehension and Visual Matching, WISC-IV Digit Span subtest, NEPSY-2 Inhibition, CTOPP Phonological and RAN Composites, and PAL-2 Receptive Coding).
Individualized intervention. Students began the HELPS One-on-One Reading Fluency program with trained RAs in February of the school year. The HELPS Program was implemented in a quiet setting, outside students’ regular classrooms. Intervention frequency occurred 3-4 times per week for 10-15 minutes over 10 weeks (x̅= 30.17 total sessions, SD = 2.99). A summary of data collection procedures is summarized in Appendix B.
Criteria for Responder Designations
Norm-referenced responder status. A vast majority of prior research applies criteria for intervention response with a high degree of inconsistency, resulting in poor
24
students (a problem also identified in traditional IQ-achievement discrepancy analyses, Gresham & Witt, 1997). In the present study, the GORT-5 and students’ Spring DORF benchmark scores were used to collectively determine responder status, representing an improvement from prior studies that failed to use norm-referenced, nationally standardized instruments These measures further promote generalizability and interpretability into school settings because both have been used in earlier research (Barth, Stuebing, Anthony, Denton, Mathes, Fletcher & Francis, 2008; Denton et al., 2013) and both are commonly used in school settings to make RTI decisions. Students performing within one standard deviation (at or above the 16th percentile) were coded as showing “some” response to intervention.
Students who met this criteria on both measures were classified as showing “adequate” improvement; those who failed to achieve this criterion on both measures were labeled as performing “below expectation.” These percentile divisions are derived from standard interpretations for percentile ranking across common psychoeducational assessment
measures, and are consistent with others’ definitions of “response” in the existing literature (e.g., Fuchs & Fuchs, 2006, p. 94).
Responder status by relative growth. A secondary rubric to determine responder status was calculated using relative WCPM growth scores. In addition to serving as a source of convergent data for the primary responder classification in this study, using both systems to determine response to intervention mimicked typical school-based practices, where data are reviewed from multiple measures.
25
for risk, second grade students should read at least 72 WCPM in Winter and 83 WCPM by Spring (Cummings, Kennedy, Otterstedt, Baker, & Kame’enui, 2011). The resulting difference (83-72 = 11 WCPM) would represent the amount of expected growth typical students should show over this time period. Third grade students should improve 12 WCPM (Winter benchmark = 88 WCPM, Spring = 100).
Though other commercially available benchmarking products have provided
estimates of expected weekly growth rates, the DIBELS-Next program has not yet published such norms. Under these circumstances, and given the referenced benchmark criteria, the total difference in a student’s WCPM from Winter to Spring was divided by the number of weeks between of intervention, which also represented the time in between district-wide Winter and Spring screenings (12 weeks), even though, due to scheduled school vacations, students only received 10 weeks of intervention. Eleven (for second grade, as stated above) divided by 12 weeks yields a growth rate of 0.92 words per week. Third graders should show growth of 1 word per week (12 WCPM / 12 weeks). Adding a standard error of measurement to this growth criteria provides a conservative estimate of the range of relative growth that would be expected for students. This value (i.e. expected growth + SEM) was used to
determine whether a student performs to expectation during this period of study intervention. Estimates of SEM for curriculum-based measures such as DIBELS passages, considering high levels of measurement control and a typical population of students, are 6 WCPM for second grade passages, and 7 WCPM for third grade passages (Christ & Silberglitt,
26
27 Statistical Analysis
Tabachnick and Fidell (2001) suggest that multivariate profile analysis be employed when comparing multiple groups’ performance on a set of dependent measures, all measured on the same scale. Though a less commonly employed application of profile analysis, this approach allows for the consideration of multiple groups with multiple measures, wherein data are collected at one time.
Results
Covariates and attrition. Chi-square analysis indicated no relationship between any combinations of grade, gender, or responder status variables. Participant age, gender and grade were not correlated with performance on any cognitive variable. Because all students completed the intervention, no attrition analysis was completed.
Responder status results. Based on GORT-5 post-assessment/DORF Spring
benchmark results and the pre-determined responder designations, 10 students demonstrated “adequate” response to Tier 3 intervention (GORT-5 x̅standard score 88.5 , SD = 5.30 ), and 8 performed “below expectation” (GORT-5 x̅standard score 80, SD = 9.26). Responder status by relative growth in DORF WCPM also revealed 10 students who demonstrated “some” response (2nd
grade x̅= +16.17 WCPM, SD = 4.62; 3rd grade x̅= +25.5 WCPM, SD = 9.85), and 8 students who showed “insufficient” response (2nd grade x̅= +3 WCPM, SD = 5.29; 3rd grade x̅= +2.4 WCPM, SD = 4.88). (See Tables 1-3 for additional data on responder status).
28
GORT-5/DORF performance and by relative growth in WCPM on the DORF benchmark assessments).
Singly multivariate profile analysis using norm-referenced responder status revealed a main effect for the cognitive variables, or the test of flatness (F(6, 11) = 31.69, p < .00, = .95, observed power = 1.0) suggesting significant differences in mean scores across all cognitive tasks when considering the participant pool as a whole. In contrast, analysis revealed no significant effect for responder status (adequate or below expectation group effects) and no significant interaction (test of parallelism); cognitive performance across variables did not vary based on the GORT-5/DORF responder criteria (F(6, 11) = .43, p = .84, = .19, observed power = .13). See Table 4 for responder means across cognitive measures and Figure 1 and 2 for profile plots.
Using relative growth estimates to determine responder status, a second profile
analysis revealed a similar trend. This analysis detected significant mean differences amongst all cognitive variables (F(6, 11) = 32.04, p < .00, = .95, observed power = 1.0). However, no effect for responder group was observed, and no interaction was found to further
discriminate cognitive performance by responder standing (F(6, 11) = 1.07, p = .43, = .37, observed power = .27).
29
Assumptions. Profile analysis requires evaluation of sphericity when sample sizes are not equal (Tabachnick & Fidell, 2001). Because responder groups varied slightly in size, and given the small sample, Box’s M was analyzed for both MANOVAs and revealed non-significant values.
Linearity was also evaluated as an assumption of MANOVA. Visual inspection of scatter plots failed to suggest linear relationships amongst dependent variables. Square-root transformation were conducted with each dependent variable; however, results failed to significantly improve correlations and all results were computed using original,
untransformed variables. Caution is advised in interpreting results as a linear relation may not exist between variables. This factor may have resulted in diminished power in these analysis, and confounded the ability to detect between group differences (e.g. responder group
differences).
Discussion
Existing research is inconsistent in the value-added role that cognitive measures can have in predicting students’ response to reading fluency intervention at various stages in an RTI model. The “responder” studies have only assessed response to broad, generalized intervention, and have failed to consider the role that skill-specific, targeted instruction may play in differentiating cognitive profiles of students with exceptionally poor reading fluency. The aim of the current study was to determine if a highly structured intervention that is targeted to students with reading fluency deficits—and is provided at a Tier 3 level—would reveal unique patterns of cognitive function within this subset of struggling readers.
30
The first research question sought to determine which cognitive variables differentiated participants based on responder status. The between-subjects factor of
responder status was non-significant in all analyses, and these data did not detect meaningful cognitive differences based on either responder classification system, even after attempts to further stratify this sample of struggling readers by providing more intensive, Tier 3
intervention.
Although the cognitive variables did not differentiate participants’ responder status, the analyses of cognitive variables for these participants did reveal interesting results. Both MANOVAs suggested a significant within-subjects effect, and the test of flatness was rejected. Upon closer inspection, this total group of participants (i.e., poor readers with fluency-specific deficits) demonstrated relatively severe cognitive weakness in the area of phonological awareness. This finding supports the research implicating phonological awareness deficits as a primary and predominant cognitive deficit contributing to poor
reading outcomes (Ehri, 1987; NICHD, 2000; Rack, Snowling & Olson, 1992). In addition, it is interesting to consider that RAN, or naming-speed, which may also underlie fluency-specific deficits (Wolf, 2007; Wolf & Bowers, 1999), was neither different amongst
31
Tier 3 level may not provide useful information for the purposes of reading disability identification.
By visual inspection, Inhibition (NEPSY-2) performance was higher for adequate responders or those showing some response, compared to those falling below expectation or showing insufficient response to the intervention; however, this result was not statistically significant. But across all participants, regardless of responder status, Inhibition scores were significantly higher than verbal comprehension, visual matching (processing speed), and RAN scores. Moreover, mean scores across groups revealed average to above average performance in this domain. This finding was unexpected given that executive functions are hypothesized to play an integral role in the overall execution of fluid reading ability, as they to help the individual sustain attention, inhibit alternate responses, prioritize information to be processed, and self-monitor (Berninger et al., 2006; Reiter et al., 2005). The Inhibition task included in this study purported to measure students’ ability to inhibit and monitor responses given multiple rule sets. This particular task was selected for use in this study because students with fluency deficits are often observed to “select” the incorrect word (e.g. guess at an unknown word, skip over words, stop and repeat words or phrases). It was
32
Unexpectedly, no other mean scores on any cognitive variables were significantly discrepant from one another, and no hierarchical relationship based on level of performance could be identified. Simply stated, most participants’ scores across verbal ability, processing speed, working memory, rapid naming, executive functioning, and receptive coding tasks indicated average to below average range abilities; none of these scores would be interpreted as indicative of an area of significant processing weakness. In contrast, every student
demonstrated significant phonological awareness deficits; none of the 18 participants performed above the specified borderline range (i.e., a standard score ≤79).
Aside from the common phonological awareness deficit found across this student sample, only one student presented with more than one score that fell within a borderline range (Verbal ability SS = 78, Receptive Coding SS = 75). Three other students each had one score that fell within a borderline range (e.g. one student with Digit Span SS of 65, two students with processing speed scores of 72 and 79, respectively). On one hand, low phonological awareness scores support the diagnosis of an educational disability due to a reading disorder (e.g. dyslexia), as defined by federal and some state special education criteria (Individuals With Disabilities Education Act, 2004; Connecticut State Department of Education, 2015). On the other hand, these results are consistent with results obtained by Fletcher et al. (2006) and do not suggest that other cognitive processes (i.e., those measured in the present study) are uniquely characteristic of adequate or inadequate responders. Do Findings Support a Continuum of Severity Hypothesis?
33
rationale for this model suggests that “differences in cognitive skills between adequate and inadequate responders will reflect differences in the severity of reading impairment”
(Fletcher et al., 2006). The findings in this study fail to support the broad notion that reading-related cognitive processes, as measured by standardized instruments, are weaker for non-responders relative to those with better responses and better reading outcomes overall. In all cases in this study, no significant difference was found to adequately differentiate the level of cognitive skills in any of the 7 measured domains. In fact, Table 4 shows that in several cases, mean group differences were higher (albeit non-significantly) for poorer responders than for in those who met “adequate” or “some” improvement criteria (e.g. Receptive Coding in both responder groups and Visual Matching for the relative growth groups). Participants in both responder groups performed similarly on the various reading-related cognitive tasks, regardless of whether or not they responded sufficiently to intensive, fluency-specific, Tier 3 intervention. That this pattern held across both systems of responder classification (norm-referenced and relative growth in WCPM) provides convergent evidence that the continuum of severity hypothesis may not conform to all types of students with reading difficulties, especially when the most difficult to remediate students are identified at the Tier 3 level. More explicitly stated, the findings in this study suggest that for students with persistent and significant fluency deficits, weaker response to intervention was not associated with weaker verbal, processing speed, working memory, phonological awareness, rapid naming, or
receptive coding abilities. Future research may seek to assess the validity of the continuum of severity hypothesis by studying response to targeted intervention in other reading domains for students with other, resistant skill-specific deficits (e.g. phonics, vocabulary,
34
Does Response Determined by Relative Growth in WCPM Alter Findings?
The addition of a secondary responder classification method using relative growth calculations in lieu of norm-referenced criteria did not result in different outcomes for this study. Students were classified into responder categories based the improvement in WCPM they were able to make on DORF benchmarks, regardless of whether or not this placed them within a new category of performance (e.g. at-risk, within expectation, etc.). The reasoning behind this decision lay in the knowledge that these students would need to make even more progress than their typically achieving peers in order to obtain the next benchmark cut-score. It allowed the poorest readers an opportunity to demonstrate growth that would be otherwise obfuscated by criterion and/or norm-referenced scores. However, as with the GORT-5/DORF classification rubric, there were no significant detectible differences in cognitive performance on any measure. Collectively, these results suggest that both responder classification systems were relatively equal in the overall evaluation of possible cognitive differences according to responder status (i.e., neither suggested significant differences in any cognitive variable according to responder status). Interestingly, the two different systems did not identify the same students as sufficiently responding or failing to respond to intervention. In fact, the systems resulted in just 67% agreement in responder classification (12/18 students both identified within the same range of response by the GORT-5/DORF and relative growth classification systems, i.e. classified as “insufficient” and “below expectation,” or as “adequate” and “some.”) Consistency in determining responder status remains a difficult factor to control across studies (Fletcher et al., 2011; Fuchs & Deschler, 2007) and must be studied with greater scrutiny in the context of skill-specific deficits and a matched
35
in this sample of fluency impaired, Tier-2 intervention-resistant readers suggest that growth in WCPM differentially identifies students when compared to use of norm-referenced criteria. Future studies might focus on comparing the agreement in responder classification systems while also considering what, if any, cognitive attributes predict patterns of growth in reading performance over time for students receiving reading fluency intervention. Findings would build upon the existing research base for studying responsiveness to intervention for struggling readers, and aid in identifying cognitive profiles and unique subtypes of reading impairment.
Other considerations. Of further interest, no participant in this study met the DORF recommended “benchmark,” a cut-score representing adequate reading skill and likelihood of obtaining future benchmarks, (Dynamic Measurement Group, 2010) even after Tier 3
36
specifically evaluate students who: (a) display severe phonological awareness deficits (i.e., mean standard score of 63.5 [SD = 6.77] on the CTOPP Phonological Awareness subtest), and (b) present with persisting difficulties even after Tier 2 intervention. It is possible that for these most deficient fluency-impaired readers, much more support is required at a Tier 3 level (e.g., 30+ minutes per day of one-on-one intervention).
Limitations and Implications for Future Research
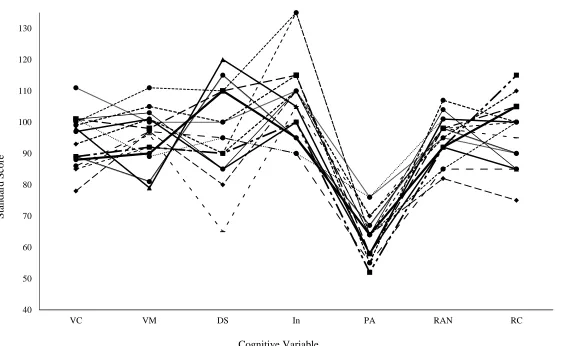
37
participant. Though visually overwhelming, Figure 3 powerfully reflects that students did not present with the same pattern or level of cognitive performance, something many
experienced school-based clinicians may encounter regularly. No doubt, the neurological underpinnings that govern cognitive functions and reading outcomes will be further clarified with increasing sophistication in technology and brain imaging. Additionally, well-powered intervention efficacy studies that take into consideration students’ cognitive strengths and weaknesses may further expand our knowledge of the role cognitive functions play in
developing adequate reading fluency skills. Until then, best practice for evaluation of reading disorders in any setting continues to require a more thorough consideration of student history and development, behavior and socio-emotional functioning, and other complex factors in order to consider the potential comorbidity of additional conditions (e.g. learning differences, and/or neurological deficits) that influence a student’s response to intervention.
Similarly, data in Figure 3 can be interpreted in the context of Fiorello et al.’s, (2006) Cognitive Hypothesis Testing (CHT) model, which suggests that students who do not
respond to typical RTI efforts receive comprehensive evaluation to guide assessment of unique cognitive strengths and weaknesses. Subsequent information can then be used to evaluate the ways in which skill-specific, targeted and empirically-validated intervention efforts can be tailored to support students with unique processing difficulties (e.g. processing speed, working memory, limited verbal comprehension). In this way, research on “learning aptitudes” and matched intervention that has been controversial in the literature, (Gresham & Witt, 1997; Pashler, McDaniel, Rohrer & Bjork, 2009), can be re-explored.
38
areas of reading (e.g. phonemic awareness, phonics, vocabulary and comprehension). Despite the plethora of studies that have begun to do so (outlined in the earlier review of research), none have targeted specific skills in the context of intensive Tier 3 intervention. As a higher-level reading skill, it may be expected that fluency (and comprehension) may be less
susceptible to intervention efforts and “cognitive profiling” simply because they recruit more diverse cognitive resources and complex cognitive systems.
39
can be applied to readers with exceptionally resistant deficits, such as the participants in this study.
As with any intervention-based study, lack of significance and failure to reject a null hypothesis may be a function of the frequency, intensity and integrity of intervention
provided. Participants in this study received high-quality intervention through use of a validated, evidence-based intervention program, and implementation integrity estimates that are reported above. Still, Tier 3 intervention should be regular, on-going, targeted and intensive. Though the aim of the present study was to provide intensive daily HELPS intervention, participants received on average 3-4 sessions per week over a period of 12 weeks, resulting in a total of approximately 45-60 minutes of weekly individualized
intervention. This amount of Tier 3 support may have lacked the intensity required to address student needs, and greater amounts of time and longer durations of intervention are
40
either a single (i.e. 30 minutes) or double dose (i.e. 60 minutes) of intervention per day. The authors further noted that reading fluency skills were most resistant to intervention efforts and showed little improvement regardless of intervention intensity. In their explanation of the study, Waznek & Vaughn suggested that students who are resistant to intervention at a Tier 2 level may require different, not longer, amounts of intervention than students who respond to generally effective interventions. The differential effectiveness of alternate fluency
interventions for poor responders, relative to typically-effective intervention programs such as HELPS, is an area for future study. To this end, researchers may consider increasing the content of fluency-intervention beyond what is provided in the HELPS program. Despite a student’s singular presenting deficit, this might be accomplished through use of generalized intervention, which purposefully incorporates work on a broader array of skills. In this way, specific fluency deficits are still targeted and progress-monitored, but the scope and intensity of deficits may be better addressed. In fact, the Teacher’s Manual for the HELPS Program (Begeny, 2009) specifically recommends this approach to intervention and level of intensity for students who are classified as Tier 3 and would seem to benefit from fluency-based intervention.
41
42 Table 1
Number of responders by grouping variable.
GORT-5/DORF Responders Relative Growth Responders
Adequate
Below
Expectation Some Insufficient
All students: 10 8 10 8
2nd 5 4 6 3
3rd 5 4 4 5
43 Table 2
Responder Status by GORT-5/DORF performance.
Participant Grade
GORT status (>16th %ile)
DORF Spring Status (> 16th %ile)
Total Responder Status
1 2nd 2 2 Adequate
2 2nd 2 2 Adequate
3 2nd 1 2 Below Expectation
4 2nd 2 2 Adequate
5 2nd 1 1 Below Expectation
6 2nd 2 1 Below Expectation
7 2nd 2 2 Adequate
8 2nd 2 1 Below Expectation
9 2nd 2 2 Adequate
10 3rd 2 2 Adequate
11 3rd 2 2 Adequate
12 3rd 2 2 Adequate
13 3rd 2 2 Adequate
14 3rd 1 2 Below Expectation
15 3rd 2 2 Adequate
16 3rd 1 2 Below Expectation
17 3rd 1 1 Below Expectation
18 3rd 1 2 Below Expectation
44 Table 3
Responder status by relative growth performance.
Participant Grade
Winter DORF (WCPM)
Spring DORF (WCPM)
Relative Growth
(WCPM) Responder Status
1 2nd 52 66 +14 Some
2 2nd 53 71 +18 Some
3 2nd 55 62 +7 Insufficient
4 2nd 47 71 +24 Some
5 2nd 50 47 -3 Insufficient
6 2nd 42 53 +11 Some
7 2nd 66 83 +17 Some
8 2nd 47 52 +5 Insufficient
9 2nd 48 61 +13 Some
10 3rd 80 81 +1 Insufficient
11 3rd 67 84 +17 Some
12 3rd 78 83 +5 Insufficient
13 3rd 80 83 +3 Insufficient
14 3rd 47 80 +33 Some
15 3rd 66 101 +35 Some
16 3rd 79 96 +17 Some
17 3rd 66 61 -5 Insufficient
45 Table 4
Mean standard scores on cognitive variables based on responder status
Responder Groups
Cognitive Variables
WJ-III VC WJ-III VM WISC-IV DS NEPSY-2 Inhib CTOPP-2 PA CTOPP-2 RAN PAL-2 RC GORT-5/DORF Adequate 96.10 (7.62) 96.70 (10.36) 98.00 (16.87) 108.00 (11.60) 64.60 (6.45) 96.70 (6.40) 96.00 (8.43) Below Expectation 88.125 (8.66) 95.00 (14.06) 97.50 (11.65) 103.13 (17.31) 62.125 (7.34) 92.38 (6.82) 101.25 (16.85)
Relative Growth Some
94.40 (8.60) 93.10 (12.10) 98.33 (17.5) 109.00 (16.80) 64.90 (6.01) 95.50 (4.45) 97.50 (7.55) Insufficient 90.25 (9.16) 99.50 (11.11) 95.00 (10.00) 101.88 (9.61) 61.75 (7.65) 93.88 (9.16) 99.38 (17.81)
Note. CTOPP-2 PA = Phonological Awareness Composite; WJ-III VC = Johnson Verbal Comprehension subtest; WJ-III VM =
Woodcock-Johnson Visual Matching subtest; WISC-IV DS = Digit Span subtest; NEPSY-2 Inhib = Inhibition subtest; CTOPP-2 RAN = Rapid Naming Composite;
46 Table 5
Significant pair-wise comparisons of cognitive variables.
Pair-Wise Comparisons CTOPP SS –
Cog Variable SS
SS Difference
t df p
CTOPP-2 PA < WJ-III VC 63.5 92.56 -29.06 12.317 17 .000 < WJ-III VM 63.5 95.94 -32.44 10.020 17 .000 < WISC-IV DS 63.5 97.78 -34.28 8.701 17 .000 < NEPSY-2 Inhib 63.5 105.83 -42.33 11.338 17 .000 < CTOPP-2 RAN 63.5 94.78 -31.28 -14.635 17 .000
< PAL-2 RC 63.5 98.33 -34.83 -9.926 17 .000
Pair-Wise Comparisons Inhib SS –
Cog Variable SS
SS Difference
t df p
NEPSY-2 Inhib > WJ-III VM 105.83 95.94 9.89 -3.194 17 .005 > WJ-III VC 105.83 92.56 13.27 -3.743 17 .002 > CTOPP-2 RAN 105.83 94.78 11.05 2.965 17 .009
Note. CTOPP-2 PA = Phonological Awareness Composite; WJ-III VC = Woodcock-Johnson Verbal
Comprehension subtest; WJ-III VM = Woodcock-Johnson Visual Matching subtest; WISC-IV DS = Digit Span
subtest; NEPSY-2 Inhib = Inhibition subtest; CTOPP-2 RAN = Rapid Naming Composite; PAL-2 RC =
47 Figure 1
Group profiles: mean cognitive scores by GORT-5/DORF responder criteria.
Note. VC = Woodcock-Johnson Verbal Comprehension subtest; VM = Woodcock-Johnson Visual Matching
subtest; DS = WISC-IV Digit Span subtest; In = NEPSY-2 Inhibition subtest; PA = CTOPP=2 Phonological
Awareness Composite; RAN = CTOPP-2 Rapid Naming Composite; RC = PAL-2 Receptive Coding subtest.
50 55 60 65 70 75 80 85 90 95 100 105 110 115
VC VM DS In PA RAN RC
S
ta
n
d
a
rd
S
co
res
Cognitive Variables
Below Expectation
48 Figure 2
Cognitive profiles by relative growth responder criteria.
Note. VC = Woodcock-Johnson Verbal Comprehension subtest; VM = Woodcock-Johnson Visual Matching
subtest; DS = WISC-IV Digit Span subtest; In = NEPSY-2 Inhibition subtest; PA = CTOPP=2 Phonological
Awareness Composite; RAN = CTOPP-2 Rapid Naming Composite; RC = PAL-2 Receptive Coding subtest. 50
55 60 65 70 75 80 85 90 95 100 105 110 115
VC VM DS In PA RAN RC
St
adar
d
Scor
es
Cognitive Variables
49 Figure 3
Cognitive profiles of individual participants.
Note. Standard scores have a mean of 100 and a standard deviation of 15. 40
50 60 70 80 90 100 110 120 130
VC VM DS In PA RAN RC
St
andar
d
Scor
e
50 References
Al Otaiba, S. & Fuchs, D. (2002). Characteristics of children who are unresponsive to early literacy intervention. Remedial and Special Education, 23, 300-316.
Altemeier, L. E., Abbott, R. D., & Berninger, V. W. (2010). Executive functions for reading and writing in typical literacy development and dyslexia. Journal of Clinical and Experimental Neuropsychology, 30, 588-606.
Baddeley, A. (2001). Is working memory still working? European Psychologist, 7, 85–97. Barth, A. E., Denton, C. A., Stubeing, K. K., Fletcher, J. M., Cirino, P. T., Francis, D. F., &
Vaughn, S. (2010). A test of the cerebellar hypothesis of dyslexia in adequate and inadequate responders to reading intervention. Journal of the International Neuropsychological Society, 16, 526-536.
Begeny, J. C. (2009). Helping Early Literacy with Practice Strategies (HELPS): A one-to- one program designed to improve students’ reading fluency. Raleigh, NC: The HELPS Education Fund. Retrieved from http://www.helpsprogram.org.
Begeny, J. C. (2011). Effects of the Helping Early Literacy with Practice Strategies (HELPS) reading fluency program when implemented at different frequencies. School
Psychology Review. 40, 149-157.
Begeny, J. C. (2015). Helping Early Literacy with Practice Strategies for small groups (HELPS-SG): A small group program designed to improve students’ reading fluency. Manual in preparation.