ABSTRACT
OJHA, SATYAJEET SOORYAKANT. Fabrication and Characterization of Novel Single and Bicomponent Electrospun Nanofibrous Mats. (Under the direction of Dr. Russell E. Gorga).
FABRICATION AND CHARACTERIZATION OF NOVEL SINGLE
AND BICOMPONENT ELECTROSPUN NANOFIBROUS MATS
By
SATYAJEET S. OJHA
A thesis submitted to the Graduate Faculty of North Carolina State University
in partial fulfillment of the requirements for the Degree of
Master of Science
TEXTILE ENGINEERING Raleigh, NC
2007 APPROVED BY
--- Dr. Russell E. Gorga (Chair of Advisory Committee)
DEDICATION
Dedicated to
Late Shri Arun Lal Ojha
BIOGRAPHY
ACKNOWLEDGEMENTS
Almighty has been my alter ego in providing me the strength, which enabled me to complete my thesis and research. The completion of this has been made possible through the direct and indirect cooperation of various persons for whom I wish to express my gratitude.
Heartfelt gratitude to the staff of TECS, Angie Brantley, Judi Elson, Shane Jarvis, Vicki Stocksdale and Birgit Anderson for all their support during my stay here as graduate student.
TABLE OF CONTENTS
List of Tables………...viii
List of Figures………....ix
Chapter 1 Background ... 1
Chapter 2 Literature Review ... 7
2.1. Electrospinning ... 7
2.2. Carbon Nanotubes ... 11
2.2.1 Structure and properties of CNTs... 12
2.3. Chitin and Chitosan... 16
2.4. Nylon-6... 18
2.5. Polyethylene oxide (PEO)... 20
2.6 References:... 21
Chapter 3 Research Objectives... 27
Chapter 4 Morphology and mechanical properties of electrospun nylon-6 nanofibers as a function of molecular weight and processing parameters... 30
4.1. Abstract... 30
4.2. Introduction... 31
4.3. Experimental ... 38
4.3.1. Materials ... 38
4.3.2. Electrospinning ... 40
4.3.3. Morphology ... 41
4.3.4. Interfacial and Viscosity Measurements... 42
4.3.5. Mechanical properties measurements... 43
4.4. Results and Discussion... 44
4.4.1. Effect of molecular weight and concentration on surface tension... 44
4.4.2. Effect of Concentration and Molecular Weight on morphology of nanofibers ... 46
4.4.3. Effect of Voltage on morphology of nanofibers ... 50
4.4.4. Effect of Distance on morphology of nanofibers... 53
4.4.5. Effect of Feed Rate on morphology of nanofibers ... 56
4.4.6. Mechanical Testing of Nanofibrous mats ... 58
4.5. Conclusion ... 60
4.6. Acknowledgements: ... 61
4.7. References... 62
5.1. Abstract: ... 65
5.2. Introduction: ... 66
5.3. Experimental ... 71
5.3.1. Materials………...71
5.3.2. Electrospinning ... 72
5.3.3. Characterization ... 73
5.3.3.1. Rheology and conductivity... 73
5.3.3.2. FTIR... 73
5.3.3.3. Scanning and Transmission electron microscopy... 74
5.3.3.4 Mechanical properties ... 74
5.3.3.5 Electrical properties of chitosan-PEO core-sheath and chitosan nanofibers ... 75
3. Results and Discussion... 76
5.5. Conclusions... 85
5.6. Acknowledgements: ... 86
Chapter 6: Dependence of percolation threshold and mechanical properties on morphology of nanofibers ... 93
6.1. Abstract: ... 93
6.2. Introduction... 94
6.3. Experimental ... 97
6.3.1. Materials ... 97
6.3.2. Electrospinning ... 98
6.3.3. Characterization ... 99
6.4. Results and Discussion... 101
6.5. Conclusion ... 106
6.6. Acknowledgements ... 106
6.7. References... 107
LIST OF TABLES
Chapter 1
Table 1. Outline of the number of procedures per number
of patients occurring per year for the United States………1
Chapter 4
Table-1. A brief review of studies conducted on
different types of nylon………...37 Table-2. Sample Codes and processing parameters
used in the experimental study……….…..39 Table-3. Surface tension (mN/m) of nylon-6 solutions in
formic acid at different molecular weight and concentration………45 Table-4. Variation in viscosity as a function of
molecular weight and concentration………..45 Table-5. Estimation of solution entanglement number
for different nylon-6 solutions………...46 Table-6. Tensile properties of electrospun nylon 6 web………60
Chapter 5
Table 1. Solution Properties of Chitosan dissolved in
90 % (w/w) AcOH samples………...77 Table 2. Mechanical Properties of Core-sheath nanofibers
before washing off PEO………....….82
Chapter 6
Table 1. Comparison of mechanical properties of single
LIST OF FIGURES
Chapter 2
Figure 1. Number of publications in the last decade on electrospinning……….8
Figure 2. Typical electrospinning set-up……….………....9
Figure 3. Nanofibers obtained from different collectors (a) parallel bars (b) circular plate……….9
Figure 4. Photograph of aligned nanofibers……….….10
Figure 5. Electrospinning set-up for core-sheath nanofibers……….11
Figure 6. Perpendicular syringe system for core-sheath nanofibers………..11
Figure 7. Publications pertaining to CNTs in recent past………..12
Figure 8. Different morphologies of carbon nanotubes……….13
Figure 9. Chemical structure of Cellulose, Chitin and Chitosan………...17
Figure 10. Polymerization reaction of Nylon-6………18
Chapter 4 Figure 1. Typical electrospinning Set-up………...41
Figure 2. DROP instrument for the measurement of interfacial tension ………..43
Figure 3. Effect of molecular weight and concentration on morphology of nanospun fibers. Low Mw nylon-6 10 wt % (a) & 15 wt % (b); Medium Mw nylon-6 10 wt % (c) & 15 wt % (d); High Mw nylon-6 10 wt % (e) & 15 wt % (f) (All samples at 15kV, 15 l/min, 15 cm)………..48
Figure 4. Effect of molecular weight on diameter distribution……….49
Figure 5. Effect of Voltage
(g, h, i) High Mw nylon-6 at 10, 15, 20 kV
(All samples at 15 wt%, 15 l/min, 15 cm) ………..51 Figure 6 (a, b). Diameter distribution as a function of voltage.
Increase in voltage augmented diameter size in
medium Mw (Fig 6a) and high Mw (Fig 6b) nylon-6………...52 Figure 7. Effect of distance on nanofiber morphology.
(a, b, c) Low Mw 15 wt % nylon-6 at distance 10, 15 and 20 cm. (d) high Mw 15 wt % nylon-6 at distance 20 cm
(All samples at 15 KV, 15 l/min)………55
Figure 8. Diameter distribution as a function of distance
and molecular weight………55 Figure 9. Effect of Feed Rate
(a, b, c) Medium Mw 15 wt % nylon-6 at 15, 50, 100 µl/min; (d, e, f) High Mw 15 wt % nylon-6 at 15, 50, 100 µl/min; (g, h) High Mw 10 wt % nylon-6 at 15 and 50 µl/min
(All samples at15 wt%, 15 KV, 15 cm) ………...…57 Figure 10 (a, b). Effect of Feed rate on diameter distribution
on high Mw (Fig 10 a) and medium Mw (Fig 10 b)
shows a drop off in overall diameter size………...…..58
Chapter 5
Figure 1. Typical set-up used for core-sheath electrospinning………..…72 Figure. 2. The concentration dependence of the zero shear rate
viscosity (η0) for chitosan and PEO. The black circles indicate η0
for varying concentrations of chitosan (1 – 4 wt %) and
the gray triangle indicates η0 for 4 wt % PEO………..……….…..78
Figure 3. TEM images of coaxially electrospun Chitosan (3 wt %)-PEO (4 wt %) core-sheath fibers
before washing out PEO………..79 Figure 4. FTIR of electrospun PEO-Chitosan nanofibers
(after washing off PEO), PEO and Chitosan………...80 Figure 5. (a-g) SEM images of electrospun chitosan-PEO
core-sheath nanofibers. (a-c) samples before H2O treatment.
Chapter 6
Figure 1. Electrospinning set-up used in core sheath electrospinning………...98 Figure 2. Solution conductivity of polymer solution (PEO)
doped with MWCNTs………..…100 Figure 3. Scanning electron images of single layer
nanofibers (a, b) and core-sheath nanofibers (c, d)………..101 Figure 4. Transmission electron micrographs of
PEO (core)/ PEO with MWCNTs (sheath) coaxial nanofibers. (b) 0.05 wt % MWCNTs; (c) 0.25 wt % MWCNTs;
(d) 0.50 wt % MWCNTs. Aggregation is observed as the
concentration of MWCNTs is increased………..102 Figure 5. Conductance values for single and bi-component fibers.
Wt% values for the bi-component fiber were adjusted to reflect
Chapter 1
Background
Electrospinning is a simple and powerful technique to produce fibers at sub-micron level from a number of materials. This simplicity combined with a broad range of materials can be utilized to produce fibers for a variety of applications. Potential applications include nanofibers reinforced composites1-2, membranes for filteration3, support for enzymes and catalysts4 and biomedical applications such as scaffolds for tissue engineering, wound dressings and drug delivery.5-6
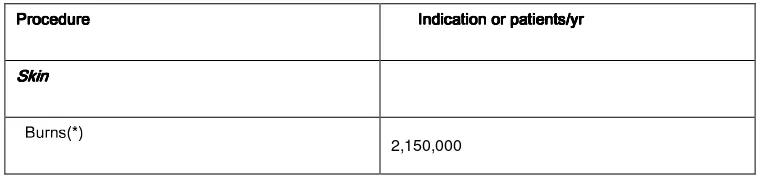
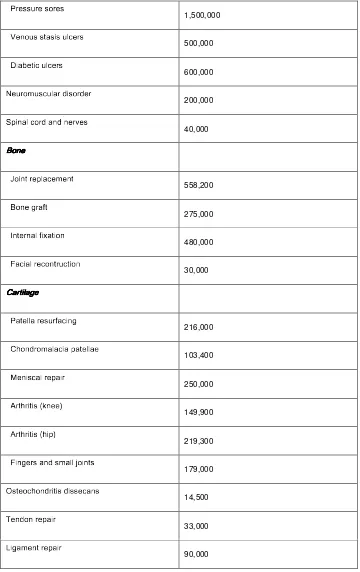
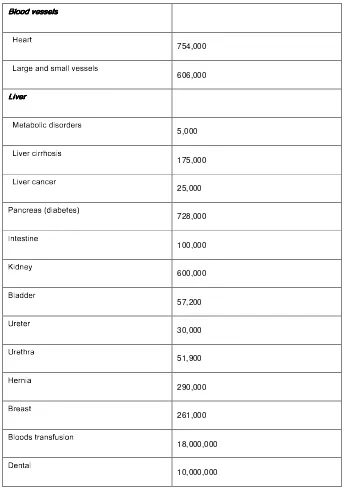
A large part of American population is approaching old age, as a result of which there is a surge in demand for replacement of organs. Such an increase in demand has encouraged researchers from all realms of science to get together and resolve this issue. So far there is been no or limited success in development of organs generated in-vitro. This issue has initiated an intense research in the field of replacement and development of organs. Table 1 gives information about different procedures performed per patient in USA per year.1
Table 1: Outline of the number of procedures per number of patients occurring per year for the United States.
!"$# %&('
Table 1 Contd.
)!*#$# !*+#,!*#
1,500,000
-.*", #/#$01# 2#+ 34*!#
500,000
56217 *0248 34*!#
600,000
9:* !,;< #4 31!=2#,!=*!
200,000
>6? 2"134$,!=@1"=A"*!B *#
40,000
CED F CEDCED FF CED F
G,2"$0H!* ? 314*;+*"0
558,200
I,H"*J!1K0
275,000
L"0*!"13MK2N102,H"
480,000
O1 4213$!*4$,H"$0! 402,H"
30,000
PQRTSUQ$VF PQRTSUQ$VF PQRTSUQ$VF PQRTSUQ$VF
)10*331<!* # !K1 42"J
216,000
WYX ,H"=!,;+131421 ? 10*331*
103,400
Z*" 2#413!* ? 12!
250,000
[Y!0X !202#+%\"** '
149,900
[Y!0X !202#+%X 2? '
219,300
OH2"J*!#1"=+# ;+133(],2"$0#
179,000
^ #$0* ,4 X ,H"=!202#8=2#$#*41"$#
14,500
_*"=,H"+!* ? 12!
33,000
` 2J1;+*"$0!* ? 12!
Table 1 Contd.
C UDDacbFd$d FUd C UDDacbFd$d FUd C UDDacbFd$d FUd C UDDacbFd$d FUd
e:*1!0
754,000
`1!J*<1"=+# ;+133MB * #$#*3#
606,000
f bFR f bFR f bFR f bFR
Z*017,324/=2#,!=*!#
5,000
` 2B *!42!!X ,# 2#
175,000
` 2B *!41"4*!
25,000
)1"4!*1 #%=217 *0*#'
728,000
L"$0* #02"*
100,000
g2=H"*h
600,000
31 ==*!
57,200
i6!*0*!
30,000
i6!*0X !1
51,900
e:*!" 21
290,000
!*1 #$0
261,000
3,,=#j0!1"#K #2,H"
18,000,000
5:*"$013
10,000,000
of the most studied areas is tissue engineering scaffolds. It involves replacing diseased or malfunctioning tissues or organs by scaffolds engineered outside the human body and then transplanted into the body at the diseased location. Accomplishment of such a daunting goal necessitates mutual coordination scientists from varied background.
Polymers have been looked upon as the materials of new era. The use of biodegradable and biocompatible polymers for tissue engineering is very highly attractive. Many synthetic polymers have been utilized for fabricating scaffolds such as polyethylene oxide, polyethylene glycol, polyvinyl alcohol to name a few. These scaffolds can have an enormous effect on growth of cells. Fabrication of scaffolds is the first step towards realization of tissue engineering which is followed by cell seeding. Different steps involved in the process are as follows2:
I: Fabrication of the bioresorbable scaffold
II: Seeding of cell populations into the polymeric scaffold in a static culture dish III: Growth of premature tissue in a dynamic environment
IV: Growth of mature tissue in a physiologic environment V: Surgical transplantation
VI: Tissue-engineered transplant assimilation/remodeling
polymers after degradation are absolutely harmless. Following factors are very important while structuring a scaffold1:
• Biocompatibility: acceptance within the body without causing biofouling where
the body attacks the implant, or the cells do not grow on the material
• Biodegradability: ability to degrade in the body into compatible by-products
without causing inflammatory responses
• Mechanical integrity: ability to maintain the original structure and mechanical
properties upon exposure to the body’s environment, i.e. 37˚C, pH 7.4, saline solution
• High porosity: ability to allow the transfer of nutrients/oxygen and removal of
wastes via diffusion
• Bioactivity: ability to transform or conform depending upon the influence from
the internal milieu that surrounds the scaffold seeded with cells
References
1. Kim, J.S., Reneker, D.H., Polymer Compo. 1999, 20, 124 2. Bergshoef, M.M., Vansco, G.J., Adv. Mater. 1999, 11, 1362
3. Gibson, P., Gibson, H.S., Rivin, D., Colloids Surf. A, 2001, 187-188, 469 4. Xie, J., Hsieh, Y-L., J. Mater Sci., 2003, 38, 2125
5. Kadler, K.E., Holmes, D.F., Trotter, J.A., Chapman, J.A., Biochem. J. 1996, 316, 1
6. Mo, X.M., Xu, C.Y., Kotaki, M., Ramakrishna, S., Biomaterials, 2004, 25, 1883 7. R. Lanza, R. Langerand J. Vacanti, Principles of Tissue Engineering, Academic
Press, Boston, 2000.
Chapter 2
Literature Review
This chapter provides a comprehensive literature review spanning over many aspects of nanofiber fabrication which forms the backbone of our research. Section 1 gives an overview of “Electrospinning” technique used to fabricate nanocomposite fibers using carbon nanotubes. Section 2 discusses carbon nanotubes, their properties and applications as fillers in nanocomposites. In section 3, an overview of chitosan, a biopolymer having potential applications in tissue engineering when used as scaffolds produced through electrospinning, is discussed. Section 4 focuses on nylon-6 with various spinning parameters and section 5 deals with polyethylene oxide (PEO) and its application in nanofiber fabrication.
2.1. Electrospinning
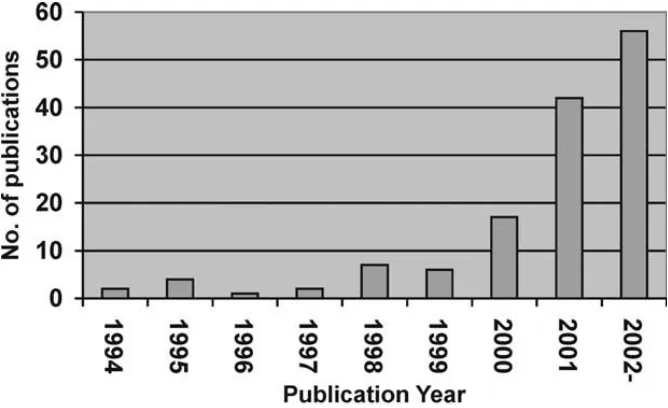
Figure 1. Number of publications in the last decade on electrospinning6
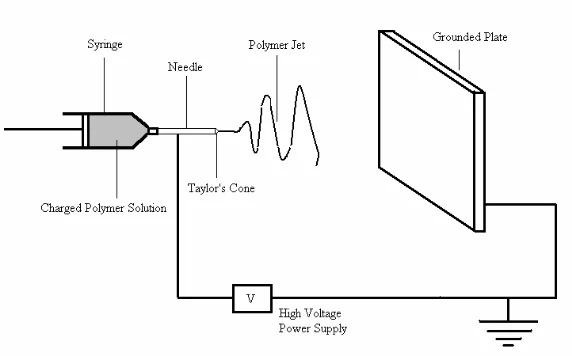
The electrospinning process has three primary components, a high voltage supply to charge polymer solution, a grounded electrode where nanofibers are deposited and a syringe with pumps from which the polymer solution is fed through a capillary connected to a syringe filled with the polymer solution. Figure 2 shows a typical electrospinning set-up. In practice, when the polymer solution droplet at the end of capillary is charged to high potential, at a critical value of voltage the droplet overcomes its surface tension and forms a Taylor cone and ejects a tiny jet toward the grounded plate. The axisymmetric instability which causes fibers to break and form undesired beads is known as Rayleigh instability, hence to have continuous nanofibers it needs to be suppressed. Another instability which occurs during electrospinning process is whipping or bending instability, nonaxisymmetric in nature which aids in formation of nanofibers. Rutledge and coworkers has reported a theoretical model explaining these various instabilities.7-10
Different assemblies of collector electrodes can give oriented or random nanofibers as shown in Figure 3.41-43 Nanofibers thus obtained in the form of mats have diameter of the order of tens to hundreds of nanometers. Nanofiber mats so formed have a very high porosity (> 60 %) together with very small pore size. Many parameters govern the final morphology of nanofibers such as viscosity and surface tension of the polymer solution, tip to collector distance, voltage and feed rate.12
Figure 2. Typical electrospinning set-up
a. Oriented nanofibers b. Random nanofibers
Figure 4. Photograph of aligned nanofibers44
Figure 5. Electrospinning set-up for core-sheath nanofibers
Figure 6. Perpendicular syringe system for core-sheath nanofibers
2.2. Carbon Nanotubes
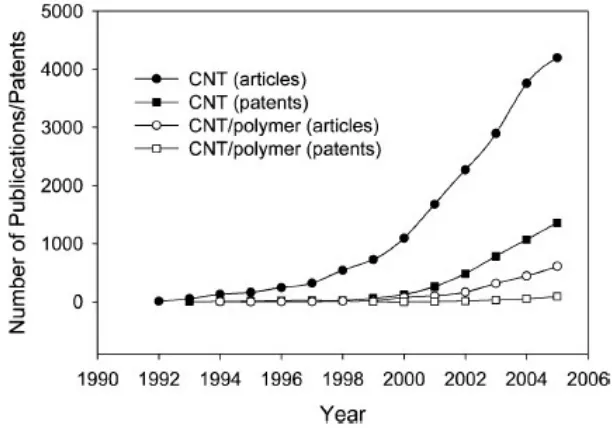
community. The reason carbon nanotubes have attracted high attention is due to their unprecedented mechanical, electrical and thermal properties. These combined properties make carbon nanotubes an ideal candidate for a variety of applications such as energy storage, energy conversion and semiconductor devices, composites with high strength and conductivity and artificial muscles.12-17 With so many potential applications of these moieties, there has been a surge in publications and patents issued in the last decade, as shown in Figure 7.20
Figure 7. Publications pertaining to CNTs in recent past20
2.2.1 Structure and properties of CNTs
each other with an interlayer separation of 0.34 nm.21 van der Waals interaction between layers of MWNTs causes a reduction in mechanical strength subject to uiaxial tensile load.22
Another classification of carbon nanotubes is made based on surface morphology of these nanotubes. Properties of carbon nanotubes are largely governed by morphological features. The morphology is described by tube chirality or helicity by a circumferential vector Ch (m,n), where m and n are steps along the zig-zag carbon bonds and the chiral
angle . The chiral angle determines the extent of twist in nanotubes. The resulting structure is arm chair if m=n; zig-zag if m=0 or n=0; and chiral for all other combinations of m and n. Fig. 8 shows different morphologies possible in a carbon nanotube.23 All arm chair and one third of zig-zag nanotubes are metallic in nature having a continuous conduction band, rest two-third zig-zag nanotubes are semiconductor having energy gap in conduction band.24
Carbon nanotubes possess exceptional high flexibility,25 low mass density,26 and a very high aspect ratio (>1000). Young’s modulus of these nanotubes lies in the range of 1 TPa27 comparable to diamond whose Young’s modulus is 1.2 TPa with a high tensile
strength in the range of 150-180 GPa.28 Treacy et al. used Transmission electron microscopy technique to measure the amplitude to intrinsic thermal vibrations to calculate the moduli (0.41-4.15 TPa) of various MWNTs.29
Molecular Dynamics (MD) is an efficient tool to estimate thermal and electrical properties of these nanotubes. Berber et al.30 found theoretically the thermal conductivity of CNTs (> 6600 W/mK) at room temperature using molecular dynamics whereas Hone and coworkers have experimentally shown a slightly lower thermal conductivity varying between 1750-5800W/mK.31 Electrical conductivity of these nanotubes lies in the range of 106 S/m.32 All the above properties combined together make carbon nanotubes as
exceptional candidate for producing composites with high strength and conductivity properties.
MWNTs produced from CVD technique having diameter and length 15 ± 5 nm and 5-20 m respectively with 95 % purity.
To translate above mentioned superior properties of carbon nanotubes into reality, a lot of difficulties need to be overcome. Dispersion of CNTs is an issue of fundamental importance. Since these nanotubes have very high surface to volume ratio, they tend to decrease their surface potential by “bundling together” or agglomeration due to van der Waals attractive forces.33Salvetat et al. has found that poor dispersion of CNTs in
composites gives rise to poor mechanical properties.34 Researchers have made several approaches to enhance dispersion such as in-situ polymerization35-37, covalent functionalization of nanotubes38 and surfactant aided dispersion using sodium dedecyl benzenesulfonate (NaDDBS), sodium dodecyl sulfate (SDS) to name a few.39-40 We have utilized surfactant assisted dispersion using ultra sonication with a naturally occurring polysaccharide, Gum Arabic. Stable suspension of MWNTs upto 30 days was achieved when gum arabic was used. When gum arabic was not used MWNTs fell out of suspension right after sonication.41
Nanocomposites with appropriate dispersion and alignment of nanotubes would result in efficient transfer of stress from matrix to nanotubes. At low strains, shear stress in the polymer at the interface experiences the same stress as in nanotubes. If the stress increases continuously then at a critical stress the interface will fail. The stress present in the polymer at interface at this point is called as interfacial shear stress.52 Ajayan et al. first reported nanotubes as fillers in mid 90’s.54 Hwang and coworkers have estimated interfacial shear stress to be 500 MPa for poly (methyl methacrylate) (PMMA)-MWNT system.53 Toughness increase has been reported by Gorga et al. by inclusion of oriented
MWNTs in PMMA55
2.3. Chitin and Chitosan
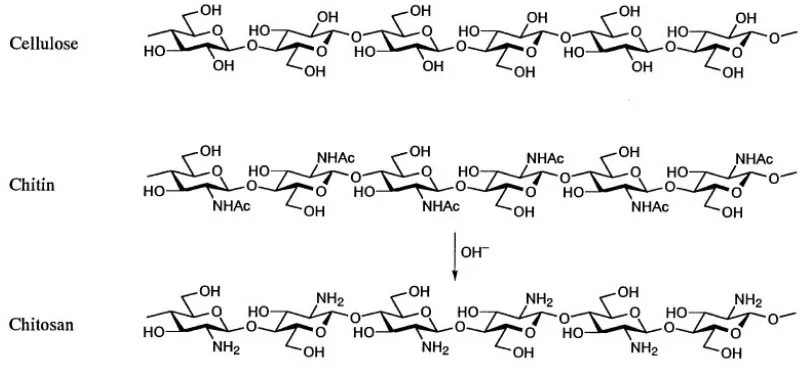
Figure 9. Chemical structure of Cellulose, Chitin and Chitosan56
Chitosan (Fig. 9) is a deacetylated form of chitin which is obtained by treatment of chitin with an aqueous alkali (sodium or potassium hydroxide) for few hours at temperatures ranging from 100-160 °C having 70-90 % deacetylation.59 Presence of reactive amino (-NH2) group in chitosan is very advantageous as its properties can be tuned by carrying
out further chemical modification. Strong inter-chain hydrogen bonding limits solubility of chitin in many solvents and thus rendering chitin difficult to process, however chitosan (deacetylated form of chitin) is soluble in dilute acids such as acetic acid, hydrochloric acid and formic acid.60 Chitosan has attracted a lot of research in recent past due to its biocompatibility, non-toxicity, anti-microbial nature and accelerated wound healing properties.61 Chitosan ability to enhance migration of cells such as macrophages, which
Electrospinning has been greatly envisioned as a tool to transform these properties of chitosan into reality. Our main goal is to produce coaxial nanofibers having chitosan, (a biopolymer obtained from crustaceans) as core material in core sheath nanofibers having a prospective application in tissue engineering and wound care.
2.4. Nylon-6
Nylon was first discovered by Wallace Hume Carothers at EI du Pont de Numors. Nylon-6 polymer is produced when a di-acid such as adipic acid is reacts with aminocaproic acid at ~ 260 C as shown in Figure 10.
COOH(CH2)5NH2 H[-NH(CH2)5CO-]nOH
Aminocaproic acid Nylon-6
Figure 10. Polymerization reaction of Nylon-6
through small apertures called as “dies”. Fine fibers are obtained by subsequent cooling. At higher molecular weights (> 20,000), processing of polymer into fibers is challenging due to difficulty in melting the polymer compounded by high viscosity arising from entanglement of polymer chains.64-65
In dry spinning polymer is dissolved in a certain solvent or a mixture of solvent and during spinning due to low boiling point, solvent evaporates leaving behind polymer in the form of fibers. This process is costlier than melt spinning process as extra equipments are required for making polymer-solvent mixture and solvent recovery. Higher molecular weight polymer can be spun with this method.65 Tensile strength of 1 GPa with a draw ratio of 10 for nylon-6 has been reported in literature.66 Wet spinning also works on same principle but instead of evaporation of solvent as in dry spinning, here solvent is leached in a coagulation bath. With respect to dry spinning, wet spinning is more complicated as proper choice of coagulant is needed which can precipitate the solvent in coagulating bath.
In our work, we have spun nylon nanofibers using electrospinning with different molecular weights (30,000, 50,000 & 63,000 gm/mol). Chapter 2 elaborates our work in more detail.
2.5. Polyethylene oxide (PEO)
Electrospinning of Polyethylene oxide (PEO) has been investigated in great detail by many researchers. It is soluble in a variety of solvents such as water, dimethyl formamide (DMF), ethanol and chloroform.68 Biocompatibility and non-toxicity are two key properties which render PEO as a suitable biomaterial for application in areas such as tissue engineering and wound scaffolds. PEO has served as an ideal candidate to gain a fundamental understanding of effect of various parameters during electrospinning such as applied voltage, solution flow rate, distance between tip and grounded electrode and solution properties such as viscosity, conductivity and surface tension. Dieztel et al. have shown that solution properties play an important role on structure and morphology of resulting nanofibers.69-70 Versatility of PEO in electrospinning has been crucial in processing of polymers which cannot be electrospun on its own such as chitosan, proteins, alginate and hyaluronan.71-76 McDiarmid et al have electrospun PEO with polyaniline
doped with camphorsulphonic acid to produce conducting nanofibers.77
2.6 References:
1. Kenawy, E.R., Bowlin, G.L., Mansfield, K., Layman, J., Simpson, D.G., Sanders, E.H., Wnek, G.E., J. Controlled Release 2002, 81, 57
2. Chen, J., Karageorgiou, V., Altman, G.H., Kaplan, D.L., Biomaterials 2004, 25 1039
3. Khil, M.S., Cha, D.I., Kim H.Y., Kim, I.S., Bhattrai, N., J. Biomed. Mater. Res. Part B: Appl. Biomater. 2003, 67B, 675
4. Tsai, P.P., Schreuder-Gibson, H., Gibson, P., J. Electrostat. 2002, 54, 333
5. Shao, C., Kim, H.Y., Gong, J., Ding, B., Lee, D.R., Park, S.J., Mater. Lett. 2003, 57, 1579
6. Huang, Z.M., Zhang, Y.Z., Kotaki, M., Comp. Sci. and Tech. 2003, 63 (15): 2223 7. Shin, Y.M., Hohman, M.M., Brenner, M.P., Rutledge, G.C., Polymer 2001, 4,
9955
8. Hohman, M.M., Shin, M., Rutledge, G.C., Brenner, M.P., Phys. Fluids, 2001, 13:2201
9. Hohman, M.M, Shin, M., Rutledge, G.C., Brenner, M.P., Phys. Fluids
2001,13:2221
10.Shin, Y.M., Hohman, M.M., Brenner, M.P., Rutledge, G.C., Appl. Phys. Lett.
2001, 78:1149–
11.Taylor G.I., Proc. R. Soc. Lond. Ser. A 1969, 313, 453 12.Fong, H., Chun, I., Renker, D.H. Polymer, 1999, 40, 4585 13.Iijima, S., Nature, 1991, 354, 56
15.An, K.H., Kim, W.S., Park, Y.S., Moon, J.M., Bae, D.J., Lim, S.C., Lee, Y.S.,
Lee, Y.H., Adv. Funct. Mater. 2001, 11, 387
16.Niu, C., Sichel, E.K., Hoch, R., Moy, D., Tennent, H., Appl. Phys. Lett. 1997, 70, 1480
17.Baughman, R.H. Cui, C., Zakhidov, A.A., Zafar, I., Barisci, J.N., Spinks, G.M., Wallace, G.G., Mazzoldi, A., Rossi, D.D., Rinzler, A.G., Jaschinski, O., Roth, S., Kertesz, M., Science, 1999,284, 1340
18.Biercuk, M.J., Llaguno, M.C., Radosavljevic, M., Hyun, J.K., Johnson, A.T., Appl. Phys. Lett. 2002, 80, 2767
19.Lau, K.T. and Hui, D. Composites Part B 2002, 33, 263.
20.Moniruzzaman, M., and Winey K.I., Macromolecules 2006, 39, 5194
21.Awasthi, K., Srivastava, A., Srivastava, O. N., J. Nanosci. Nanotechnol. 2005, 5, 1616
22.Lau K.-T., Gu, C., Hui, D., Composites: Part B 37, 2006, 425
23.Thostenson, E.T.; Zhifeng, R.; Chou, T.-W., Compos. Sci. Technol. 2001, 61, 1899
24.Harris, P.J.F. Carbon Nanotubes and Related Structures, 1999, Cambridge University Press, Cambridge, UK.
25.Cooper, C. A.; Young, R. J.; Halsall, M. Composites, Part A 2001, 32A, 401 26.Gao, G.; Cagin, T.; Goddard, W. A., III. Nanotechnology 1998, 9, 184
27.Treacy, M.M.J., Ebbesen, T.W. and Gibson, J.M. Nature, 1996, 381, 6584, 678 28.De Heer Walt, A. MRS Bull. 2004, 29, 281-285.
30.Berber, S.; Kwon, Y.-K.; Tomanek, D. Phys. Rev. Lett. 2000, 84, 4613
31.Hone, J., Whitney, M., Piskoti, C. and Zettl, A. Physical Review B, 1999, 59(4): R2514
32.Phys. Rev. Lett., 82 (1999)
33.Qian, D., Dickey, E.C., Andrews, R., Rantell, T., Appl. Phys. Lett. 2000, 76, 2868. 34.Salvetat, J.P., Briggs, A.D., Bonard, J.M., Bacsa, R.R., Kulik, A.J., Stockli, T.,
Burnham, N.A., Forro´, L., Phys. Rev. Lett. 1999, 82 944 35.Tang, B.Z., Xu, H.Y., Macromolecules 1999, 32 2569
36.Star, A., Stoddart, J.F., Steuerman, D., Diehl, M., Boukai, A., Wong, E.W., Yang, X., Chung, S.W., Choi, H., Heath, J.R., Angew. Chem. Int. Ed. 2001, 40 1721 37.Jang, J., Bae, J., Yoon, S.H., J. Mater. Chem. 2003, 13, 676
38.Mitchell, C.A., Bahr, J.L., Arepalli, S., Tour, J.M., Krishnamoorti, R.
Macromolecules 2002, 35, 8825
39.Islam, M.F.; Rojas, E.; Bergey, D.M.; Johnson, A.T.; Yodh, A.G., Nano Lett.
2002, 3, 269
40.Vigolo, B., Penicaud, A., Coulon, C., Sauder, C., Pailler, R., Journet, C., Bernier, P., Poulin, P., Science 2000, 290, 1331
41.McCullen, S.D., Stevens, D.R., Roberts, W.A., Ojha, S.S., Clarke, L.I., Gorga, R.E., Macromolecules, 2007, 40 (4), 997
42.Boland, E.D., Wnek, G.E., Simpson, D.G., Palowski, K.J., Bowlin, G.L., J.
Macromol. Sci. Pur. Appl. Chem., 2001, A38 (12), 1231
45.Li, J., Papadopoulos, C., Xu, J.M., Moskovits, M., Appl. Phys. Lett. 1999, 75, 367 .
46.Wang, X.B., Liu, Y.Q., Hu, P.A., Yu, G., Xiao, K., Zhu, D.B., Adv. Mater., 2002, 14, 1557
47.Ren, Z.F., Huang, Z.P., Xu, J.W., Wang, J.H., Bush, P., Siegal, M.P., Provencio, P.N., Science, 1998, 282, 1105
48.W.A. de Heer,W.S. Bacsa, A. Chatelain, T. Gerfin, R. Humphrey-Baker, L. Forro, D. Ugarte, Science1995, 268, 845
49.Choi, E.S., Brooks, J.S., Eaton, D.L., Al-Haik, M.S., Hussaini, M.Y., Garmestani, H., Li, D., Dahmen, K., J. Appl. Phys. 2003, 94, 6034
50.Dror, Y., Salalha, W., Khalfin, R.L., Cohen, Y., Yarin, A.L., Zussman, E.,
Langmuir 19 (2003) 7012
51.Reneker, D.H. Chun, I., Nanotechnology 1996, 7, 216
52.Kelly, A., Macmillan, N. H., Strong Solids, 3rd ed., Oxford University Press, 1986, Oxford, UK
53.Hwang, G. L., Shieh, Y.-T., Hwang, K. C., Adv. Funct. Mater. 2004, 14, 487 54.Ajayan, P. M.; Stephan, O.; Colliex, C.; Trauth, D. Science 1994, 265, 1212 55.Gorga, R.E., Cohen, R.E., Journal Of Polymer Science Part B-Polymer Physics,
2004, 42, 2690
59.Hudson, S.M., Jenkins, D.W., “Chitin and Chitosan." Encyclopedia of Polymer Science and Technology, 3rd Ed., 2001, Herman F. Mark. Hoboken, NJ: Wiley Interscience
60.Senel, S., McClure, S. J., Advanced Drug Delivery Reviews 2004, 56.10 1467 61.Lim, S.-H., Hudson, S. M. Journal of Macromolecular Science-Polymer Reviews,
2003, C 43(2), 223
62.Ueno, H., T. Mori, and T. Fujinaga. Advanced Drug Delivery Reviews 52.2 2001, 105-115.
63.Di Martino, Alberto, Sittinger M., and Makarand V. Risbud. Biomaterials 2005, 26 5983
64.Moncrieff, R.W., Man Made Fibers, 1970, 5th ed., John Wiley & Sons Inc. New York
65.Hufnagel, D., Hyaluronic acid-based nanofibers via electrospinning, MS Thesis, 2006, North Carolina State University
66.Gogolewski, S., Pennings, A. J., Polymer, 1985, 26, 1394
67.Cho J. W., Lee G. W., Chun B. C., J. Appl. Polym. Sci., 1996, 62, 771
68.Brandrup, J., Immergut, E.H., Polymer handbook, 1975, 2nd ed., John Wiley & Sons Inc. New York
71.Bhattarai, N., Edmondson, D., Omid V., Matsen, F.A., Zhang, M., Biomaterials, 2005, 26, 6176
72.Duan, B., Dong C., Yuan, X., Yao, K., J. Biomater. Sci. Polymer Ed., 2004, 15 (6), 797
73.Bhattarai, N., Li, Z., Edmondson, D., Zhang, M., Adv. Mater. 2006, 18, 1463 74.Ji, Y., Ghosh, K., Shu, X.Z., Li, B., Sokolov, J.C., Prestwich, G.D., Clark, R.A.F.,
Rafailovich, M.H., Biomaterials, 2006, 27, 3782 75.Xie, J., Hsieh, Y.L., J Mater Sci 2003, 38, 2125
76.Jian, H.J., Fridrikh, S.V., Rutledge, G.C., Kaplan, D.L., Biomacromolecules, 2002, 3, 1233
Chapter 3
Research Objectives
3.1 Research Objectives
Electrospinning has evolved as a facile technique to produce materials finding applications in a number of fields. A better understanding of the procedure in terms of solution and process parameters is vital for further development of this technique which would help to transform it from laboratory to commercial scale. How do we get fine and uniform nanofibers from polymer solutions? Could this technique be used to produce nanofibers with coaxial morphology? Once nanofibrous mats are produced, how their properties can be utilized rendering them useful for applications such as tissue engineering? What role is played by carbon nanotubes in altering the conducting properties of nanofibrous mats? These would be few questions we would attempt to answer through our work.
1. Fabricate nanofibers via electrospinning as a measure to understand effects of various parameters involved in the process. This will be accomplished by:
a. Analyzing of effect of molecular weight, concentration, viscosity and surface tension.
b. Determining the consequences of variation in applied electric field, voltage and feed rate of polymer solution.
c. Analyzing the electrospun nanocomposites via scanning electron microscopy to confirm proper fiber formation.
d. Determining any improvements in mechanical properties via tensile testing.
2. Fabricate novel nanofibers with core-sheath geometry for potential application in tissue engineering. This will be accomplished by:
a. Engineering a model to produce core-sheath nanofibers.
b. Using Chitosan, a biopolymer with Poly ethylene oxide (PEO).
c. Analyzing the rheological properties of two polymer solution (Chitosan and PEO) using rheometer.
d. Analyzing the electrospun nanocomposites via scanning and transmission electron microscopy to confirm proper fiber formation.
e. Determining change in conductance as a result of wetting the coaxial nanofibers.
f. Ascertaining any change in mechanical properties as a result of insertion of chitosan as core in nanofibers.
pure polymer and sheath as polymer doped with multi-walled carbon nanotubes for enhanced electrical conductivity. This will be accomplished by:
a. Determining the rheological properties of the polymer solutions and the effect of multi-walled carbon nanotube addition
b. Analyzing the electrospun nanocomposites via scanning and transmission electron microscopy to confirm proper fiber formation and multi-walled carbon nanotube integration into the as-spun fiber.
c. Determining any improvements in mechanical properties and electrical conductivity via tensile testing and sensitive conductivity measurements, respectively.
Chapter 4
Morphology and mechanical properties of electrospun nylon-6 nanofibers as
a function of molecular weight and processing parameters
Satyajeet S. Ojha, Mehdi Afshari, Richard Kotek, & Russell E. Gorga1
Fiber and Polymer Science, College of Textiles, North Carolina State University, Raleigh, NC 27695-8301-USA
4.1. Abstract
In the present study, the morphology and mechanical properties of nylon-6 nanofibers were investigated as a function of molecular weight (30,000, 50,000 and 63000 gm/mol) and the electrospinning process conditions such as the effect of solution concentration, applied electric field strength and distance between tip of needle and collector were also studied. Non-woven mats were successfully electrospun from 15 wt % solutions of each molecular weight polymer. Scanning electron micrographs (SEM) of nylon-6 nanofibers showed the diameter of the electrospun fiber increased with increasing molecular weight and solution concentration. An increase in molecular weight increases the density of chain entanglements at the same concentration hence, the minimum concentration to produce nanofibers was lower for the highest molecular weight nylon-6. The morphology of electrospun fibers also depended on tip-to-collector distance and applied voltage concentration of polymer solution as observed from the SEM images. Mechanical properties of electrospun nonwoven mats showed an increase of 50 % in Young’s modulus with increasing Mw of nylon-6.
1 Corresponding Author: Tel:+1-919-515-6553
Keywords: electrospinning, molecular weight, nanofibers, morphology, mechanical
properties
4.2. Introduction
Conventional fiber spinning techniques such as wet spinning, dry spinning, melt spinning, and gel spinning can produce polymer fiber with diameters down to the micrometer range. If the fiber diameter is reduced from micrometers to nanometers, very large surface area to volume ratios can be obtained. These unique qualities make polymer nanofibers an optimal candidate for many important applications [1]. Polymer fibers can be generated from an electrostatically driven jet of polymer solution or polymer melt. This process, known as electrospinning, has received a great deal of attention in the last decade because of its ability to consistently generate polymer fibers that range from 50 to 500 nm in diameter [2-5]. Because of the small pore size and high surface area inherent in electrospun textiles, these fabrics show promise for exploitation in soldier protective
could also be used as supports for enzymes or catalysts and scaffold for tissue engineering and templates for the formation of hollow fibers with inner diameters in the nanometer range [6-14].
fiber morphology as a function of solution properties (concentration, polymer molecular weight) and processing conditions is not well quantified.
Many parameters can influence the transformation of polymer solutions into nanofibers through electrospinning. These parameters include: a)The solution properties such as viscosity, elasticity, conductivity, and surface tension, b)governing variables such as hydrostatic pressure in the capillary tube, electric potential at the capillary tip, and the gap (distance between the tip and the collecting screen), and c) ambient parameters such as solution temperature, humidity, and air velocity in the electrospinning chamber [9].
Among the many eletrospun polymers reported in the scientific literature are poly(p-phenylene terephthalamide) [37], tri-block polymers [39], Nylon [22-29], polyethylene oxide and DNA from solution [38]; polyethylene and polypropylene from the melt [40]. Nylon has been widely used as an important engineering plastic because of its good mechanical properties. Nylon fibers have been produced by traditional methods such as melt, wet and dry spinning. These fibers are available in staple, tow, monofilament and multifilament form [20]. Fiber diameters produced by these methods range from 10 to 500 micrometer [21].
Ryu and coworkers [22] examined morphology, pore size, surface area and gas transport properties of nylon 6 nonwoven electrospun mats. The crystallinity of nanocomposites of nylon-6 and montmorillonite clay was studied by Fong et.al [23]. The ultra large draw ratio and rapid solvent removal of electrospinning favors the formation of -phase nylon crystallites in pure nylon-6 and montmorillonite-nylon-6 fibers [23]. Bregshoef and Vancso [8] prepared nanocomposites with ultrathin, electrospun nylon-4,6 fibers and compared mechanical properties of nylon 4,6/epoxy composite films and epoxy films.
Gibson and coworkers [25] used Nylon-66, Polybenzimidazole and Polytetrafluoroethylene membranes from electrospun fibers as protective layers. They measured properties of electrospun membranes including structural effects upon moisture transport, air convection, aerosol filtration, porosity, tensile strength.
Using Raman spectroscopy Stephen and coworkers [26] showed that in the case of
nylon-6 polymer crystalline structure was altered from to form when electrospun. This
however is not a permanent conformational change and can be converted back to form
by solvent casting a film from the electrospun membrane. The ability of the
electrospinning process to produce the form implies that the fibers are under high stress
when they are being formed. For nylon-12 that only has one preferred conformation, the chain conformation is conserved after processing.
obtained under the negative electrode polarity were larger than those obtained under the positive electrode polarity.
Dersch [30] showed that intrinsic structure of nylon-6 and polylactic acid (PLA) fibers do not differ to an appreciable extent from those found for much thicker fibers obtained by melt extrusion. The annealing of polyamide fibers at elevated temperatures resulted in a
transformation from the disordered from to the more highly ordered form. The
Table 1. A brief review of studies conducted on different types of nylon.
Author Polymer Solvent Mw
(g/mol) Focus Reference Supaphol N6 Formic acid,
m-chresol, sulphuric acid 17000, 20,000, and 32000 Effects of solvent, polarity of electrode, concentration, and addition of salt (NaCl)
27-29
Gibson N66 Formic acid Not
reported Properties of electrospun membranes (moisture transport, air convection, aerosol filtration, tensile strength) 25
Larrondo N12 - 35000 Modeling of drop formation
in terms of a theory Troza
24
Stephen N6, N12 HFIP N6: 43,300
N12: 32000 Investigation about chain conformation during electrospinning by Raman spectroscopy 26
Dersch N6 Formic acid Not
reported Comparison structure of electrospun and melt spun fibers
by x-ray
30
Fong N6 HFIP,
HFIP/dimethyl formamide
20,000 Effects of
solvent 23
Bregshoef N46 Formic acid Not
In the present study we investigated effect of voltage, distance between collector and tip of syringe and solution concentration of 3 different molecular weight of PA-6 (30,000, 50,000 and 63000 g/mol) in formic acid on diameter of electrospun fibers of PA-6. In the literature published the highest molecular weight that has been utilized to produce nanofibers is 32000 g/mol [27]. We have made the first attempt to produce high molecular weight PA-6 up to 63000 g/mol in order to comprehend the effect of molecular weight on morphology of nanofibers and mechanical properties of electrospun nonwoven mats.
4.3. Experimental 4.3.1. Materials
Three molecular weights of nylon-6 were investigated (high (63000 g/mol), medium (50000 g/mol) and low (30000g/mol) molecular weight (ULTRAMID BS700, BS3301 and B4001) from BASF). The viscosity averaged molecular weight was calculated from the Mark-Houwink equation (1).
[ ] = KMwa
(1)
The constants K and a values used for the nylon-6/formic acid system at 25 °C were 22.6 × 10 -5 dL/g and 0.82, respectively [36]. The viscometric measurements were conducted at 25°C by using an Ubbelohde viscometer. The limiting viscosity number was determined from the following equation (2):
[ ]
12
2
( rel 1)
C
η = η − (2)
Two polymer solution concentrations 10 wt % and 15 wt % prepared by dissolving nylon-6 in Formic acid (Merck). Samples of different molecular weight and concentrations with varying processing parameters were used. Table 2 shows sample code and processing parameters of samples. The samples code can be identified as: 1. Molecular weight LMW, MMW, and HMW refers to low, medium and high molecular weight nylon-6, respectively.
2. Concentration C1 and C2 refers to 10 and 15 wt%, respectively.
3. Voltage V1, V2, and V3 refers to 10, 15, and 20 kV, respectively.
4. Distance from tip to collector D1, D2, and D3 refers to 10, 15, and 20 cm, respectively.
5. Feed rate F1, F2, and F3 refers to 15, 50, and 100 l/min, respectively.
For example LMWC1V2F1D2 refers to nanofibers produced from low molecular weight
nylon-6 having 10 wt% concentration, at 15 kV voltage, 15 l/min feed rate, and 15 cm distance.
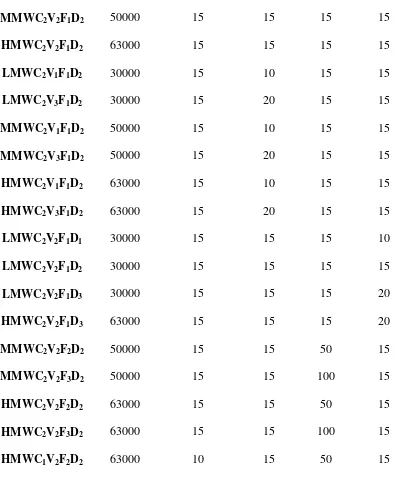
Table 2: Sample Codes and processing parameters used in the experimental study
Sample Code Mol. Wt. (g/mol)
Concentration (wt %)
Voltage KV
Feed Rate µl/min
Distance cm
LMWC1V2F1D2 30000 10 15 15 15
MMWC1V2F1D2 50000 10 15 15 15
HMWC1V2F1D2 63000 10 15 15 15
Table 2 Contd.
MMWC2V2F1D2 50000 15 15 15 15
HMWC2V2F1D2 63000 15 15 15 15
LMWC2V1F1D2 30000 15 10 15 15
LMWC2V3F1D2 30000 15 20 15 15
MMWC2V1F1D2 50000 15 10 15 15
MMWC2V3F1D2 50000 15 20 15 15
HMWC2V1F1D2 63000 15 10 15 15
HMWC2V3F1D2 63000 15 20 15 15
LMWC2V2F1D1 30000 15 15 15 10
LMWC2V2F1D2 30000 15 15 15 15
LMWC2V2F1D3 30000 15 15 15 20
HMWC2V2F1D3 63000 15 15 15 20
MMWC2V2F2D2 50000 15 15 50 15
MMWC2V2F3D2 50000 15 15 100 15
HMWC2V2F2D2 63000 15 15 50 15
HMWC2V2F3D2 63000 15 15 100 15
HMWC1V2F2D2 63000 10 15 50 15
4.3.2. Electrospinning
solution was place in a 10 ml syringe to which a capillary tip of 0.4 mm inner diameter was attached. The positive electrode of the high voltage power supply is connected to the capillary tip. The grounded electrode was connected to a metallic collector wrapped with aluminum foil as shown in Fig. 1.
Figure 1: Typical electrospinning Set-up
4.3.3. Morphology
4.3.4. Interfacial and Viscosity Measurements
Figure 2: DROP instrument for the measurement of interfacial tension [34]
The results that are calculated are the surface tension, shape factor (b), radius of curvature (R0), the drop volume, height and width, the surface area, and the contact angle with the
horizontal plane. The surface tension of the monolayers is measured by means of a Wilhelmy plate [31].
Viscosity was measured using a rheometer (StressTech HR, Rheologica Instruments AB) with rheoExploer V5 operating software using concentric cylinder geometry as the samples were more fluidic. Samples were presheared at 30 Pa for 60 sec and all experiments were performed at 25 ºC.
4.3.5. Mechanical properties measurements
The gauge length of the mats was 3 cm and average thickness was 0.14 mm. Tensile properties of electrospun web were measured with 10 mm/min strain rate. Void volume fraction was calculated using Image J analyzer. SEM images were scanned and different layers of nanofibers were made distinct using a grey scale. The void area (proportional to volume) was calculated as area of single nanofiber layer subtracted from total area in that plane.
4.4. Results and Discussion
4.4.1. Effect of molecular weight and concentration on surface tension
sensitive to molecular weight and concentration of polymer in electrospinning as viscosity. Polymer solutions are essentially non-Newtonian fluids, elongational flow resists the break up of the viscoelastic jet, leading to the formation of long threads of mini jets. As a result, morphology of nanofibrous structures has a dependence on these two factors (Mw and concentration). Hence, polymer concentration and molecular weight have tremendous effect on the viscoelastic jets of nanofibers [32].
Table 3: Surface tension (mN/m) of nylon-6 solutions in formic acid at different molecular weight and concentration
Table 4: Variation in viscosity as a function of molecular weight and concentration.
Molecular Weight (gm/mol)
Concentration Viscosity (cP)
LMW 10 wt % 29.6
HMW 10 wt % 53.1
LMW 15 wt % 129
HMW 15 wt % 154
Concentration LMW MMW HMW
4.4.2. Effect of Concentration and Molecular Weight on morphology of nanofibers
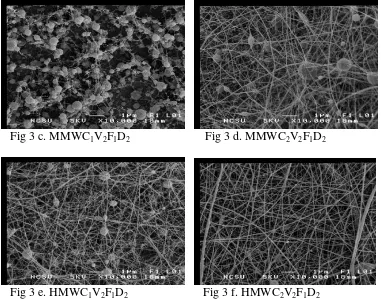
Assessment of scanning electron micrographs of three nylon-6 molecular weights revealed effect of concentration on the nanofiber morphology as shown in Figure 3. For low and medium molecular weight nylon-6 no nanofibers are observed at 10 wt. % concentration. This is attributed to the low viscosity resulting in low viscoelastic force due to low degree of chain entanglement not able to withstand the applied electric field. A study on role of chain entanglements during electrospinning has been done by Shenoy et al. [41]. This is given by the equation:
( e)sol = p Mw / Me (3)
Where
(
e)
sol is the solution entanglement number, p is volume fraction of polymer insolution, Mw is weight average molecular weight of polymer and Me is entanglement
molecular weight of polymer. (Me for nylon-6 is 5000 gm/mol [42]). Based on above
equation ( e
)
sol was calculated and is shown in Table 5. We observe that as the value of(
e)
sol approaches 2, fiber formation is seen.Table 5. Estimation of solution entanglement number for different nylon-6 solutions [40]
Molecular weight Concentration (wt %) ( e)sol
30000 10 0.634
30000 15 0.948
50000 10 1.05
Table 5 Contd.
63000 10 1.33
63000 15 1.99
Jet stability is an important factor in formation of nanofibers. Under high electric fields in the case of 10 wt % concentration of low and medium molecular weight nylon samples, jet stability is not achieved, and as a result it breaks into smaller jets and form beads. High molecular weight nylon-6 sample at same concentration showed nanofibers relatively higher in number in contrast to low and medium molecular weight with fewer beads. At 15 wt % concentration, low and medium molecular weight nylons formed beaded and broken nanofibers whereas high molecular weight nylon produced bead free nanofibers. Therefore, as the concentration and molecular weight increases, occurrence of beads decreases. This is due to the increased degree of chain entanglement with the rise in molecular weight ultimately causing an increase in viscosity and therefore higher viscoelastic force causing elongation of fibers. Figure 3 shows that in all the samples, an increase in concentration resulted in formation of nanofibers. A reduction in average bead size was also seen. For example, the average bead size reduced from 433.54 nm to 129.2 nm and the number of beads reduced from 0.465/ m2 to 0.09/ m2 in the case of high molecular weight nylon-6.
vital in the study of the elongational flow characteristics. The longest relaxation time ( )
of the molecules in solution can be estimated from the Rouse model [33-34] 6 s [ ] Mw/ 2RT (4)
where s is the solvent viscosity, [ ] is the intrinsic viscosity, R is the gas constant and T
is the temperature. An increase in molecular weight increases the relaxation time of the polymer. The relaxation time of low, medium and high molecular weight polymer (from equation 4) is calculated as 1.65 x 10⁻², 3.35 x 10⁻² and 5.48 x 10⁻² sec respectively. Its evident that with an increase in molecular weight the relaxation of polymer chains becomes more difficult and as a consequence, the elongational flow is reduced and we get nanofibers with larger diameters. At 15 wt % concentration, high molecular weight nylon-6 shows smooth and uniform nanofibers whereas medium and low molecular weight nylon-6 shows beaded nanofibers Fig. 3 (b, e & f). Hence, as the molecular weight increases, tendency to form nanofibers also increases. Similar phenomenon is observed in all the samples with an increase in concentration. Comparison of 15 wt. % high and medium molecular weight nylon-6 in Fig. 4 shows that average diameter of nanofibers increases with increasing molecular weight. The diameter distribution of high molecular weight is narrower than that for medium molecular weight.
Fig 3 c. MMWC1V2F1D2 Fig 3 d. MMWC2V2F1D2
Fig 3 e. HMWC1V2F1D2 Fig 3 f. HMWC2V2F1D2
Figure 3: Effect of molecular weight and concentration on morphology of nanospun fibers. Low Mw nylon-6 10 wt % (a) & 15 wt % (b); Medium Mw nylon-6 10 wt % (c) & 15 wt % (d); high Mw nylon-6 10 wt % (e) & 15 wt % (f) (All samples at 15kV, 15
l/min, 15 cm)
0 5 10 15 20 25 30 35 40 0.0 2-0.03 0.0 3-0.04 0.0 4-0.05 0.0 5-0.06 0.0 6-0.07 0.0 7-0.08 0.0 8-0.09 0.0 9-0.1 0.1-0 .11 0.1 1-0.12 0.1 2-0.13 0.1 3-0.14 0.1 4-0.15 0.1 5-0.16 Diameter (µm) Fr eq ue nc y (% )
MMW 15 wt % HMW 15 wt %
4.4.3. Effect of Voltage on morphology of nanofibers
Voltage illustrates enormous effect on morphology of nylon-6 nanofibers as shown by the SEM micrographs in Figure 5. Three voltages were selected 10, 15 and 20 kV at which nanofibers were produced. For a particular molecular weight, other parameters such as concentration, distance and feed rate were kept constant at 15 wt %, 15 cm and 15 l/min respectively.
As shown in Fig. 5 for the low and medium molecular weight nylon samples, as the voltage was increased from 10 kV to 20 kV a drop in bead formation was observed. In the case of low molecular weight nylon-6 sample at lower voltages of 10 and 15 kV essentially no nanofibers are seen but at 20 kV some fibers started to form. Same trend was observed for medium molecular weight sample but with higher number of nanofibers. It is evident from Figure 5 (a-f) that an increase in voltage with other parameters kept constant leads to improved nanofiber formation with a relative decrease in bead size.
nevertheless, nanofibers obtained from high molecular weight nylon-6 were without beads and more uniform as compared to other samples.
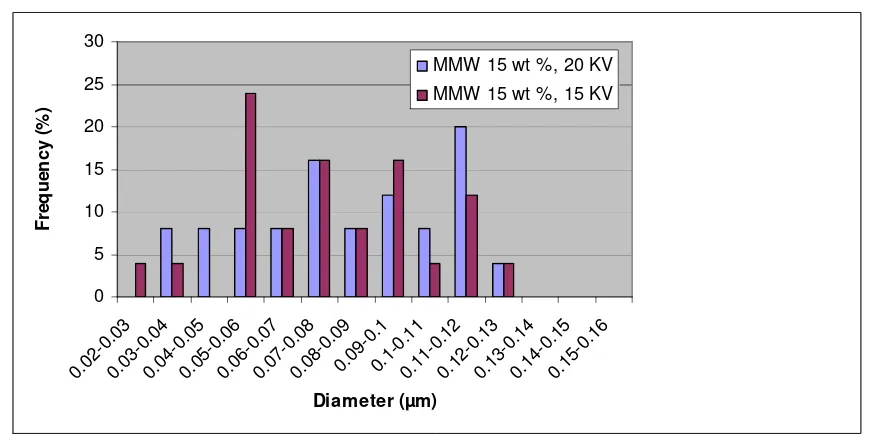
We assume that increasing voltage further could furnish uniform nanofibers. Effect of voltage on the nanofiber diameter distribution demonstrates that in all the samples as the voltage is increased diameter also increases. Average diameter of nanofiber for medium molecular weight nylon-6 increased from 78 nm at 15 kV to 83 nm at 20 kV. For high molecular weight nylon-6 average diameter increased from 77.16 nm at 10 kV to 93.76 nm at 15 kV. Figure 6 (a, b) shows the diameter distribution as a function of voltage. The rationale behind this observation is that an increase in voltage drives the charged jet to emerge from tip through Taylor’s cone rapidly due to higher electrostatic forces, so the solvent is removed more quickly resulting an increase in fiber diameter. These results agree with work carried out by Zhang and co-workers [35].
Fig 5 a. LMWC2V1F1D2 Fig 5 b. LMWC2V2F1D2 Fig 5 c. LMWC2V3F1D2
Fig 5 g. HMWC2V1F1D2 Fig 5 h. HMWC2V2F1D2 Fig 5 i. HMWC2V3F1D2
Figure 5: Effect of Voltage
(a, b, c) Low Mw nylon-6 at 10, 15, 20 kV; (d, e, f) Medium Mw nylon-6 at 10, 15, 20 kV; (g, h, i) High Mw nylon-6 at 10, 15, 20 kV (All samples at 15 wt%, 15 l/min, 15 cm) 0 5 10 15 20 25 30 0.0 2-0.03 0.0 3-0.04 0.0 4-0.05 0.0 5-0.06 0.0 6-0.07 0.0 7-0.08 0.0 8-0.09 0.0 9-0.1 0.1-0 .11 0.1 1-0.12 0.1 2-0.13 0.1 3-0.14 0.1 4-0.15 0.1 5-0.16 Diameter (µm) Fr eq ue nc y (% )
MMW 15 wt %, 20 KV MMW 15 wt %, 15 KV
0 5 10 15 20 25 30 0.0 2-0.03 0.0 3-0.04 0.0 4-0.05 0.0 5-0.06 0.0 6-0.07 0.0 7-0.08 0.0 8-0.09 0.0 9-0.1 0.1-0 .11 0.1 1-0.12 0.1 2-0.13 0.1 3-0.14 0.1 4-0.15 0.1 5-0.16 Diameter (µm) Fr eq ue nc y (% )
HMW 15 wt %, 15 KV HMW 15 wt %, 10 KV
Figure 6 (b)
Figure 6 (a, b): Diameter distribution as a function of voltage. Increase in voltage augmented diameter size in medium Mw (Fig 6a) and high Mw (Fig 6b) nylon-6.
4.4.4. Effect of Distance on morphology of nanofibers
The distance between the tip of the capillary and the grounded plate can have a significant impact on morphology of electrospun nanofibers. Three different distances were chosen 10, 15 and 20 cm between the tip of the needle and the grounded plate. For a particular molecular weight, other parameters such as concentration, voltage and feed rate were kept constant at 15 wt %, 15 kV and 15 l/min, respectively.
observed, same result was observed in the case of medium and high molecular weight samples. An increase in distance provides more time for solvent evaporation, resulting in finer nanofibers and uniform diameter size. High molecular weight 15 wt % nylon-6 was also electrospun at a distance of 20 cm. Figure 7 (c, d) shows that high molecular weight 15 wt % nylon-6 showed more consistent nanofibers as compared to low molecular weight 15 wt %. We observed that there is a difference in the morphology of the nanofibers from two samples at similar conditions, low molecular weight sample are less uniform with more beads as compared to high molecular weight nylon-6 as predicted by Shenoy [41] based on entanglement concentration.
Fig 7 a. LMWC2V2F1D1 Fig 7 b. LMWC2V2F1D2 Fig 7 c. LMWC2V2F1D3
Fig 7 d. HMWC2V2F1D3
Figure 7: Effect of distance on nanofiber morphology.
(a, b, c) Low Mw 15 wt % nylon-6 at distance 10, 15 and 20 cm. (d) high Mw 15 wt % nylon-6 at distance 20 cm (All samples at 15 KV, 15 l/min)
Figure 8: Diameter distribution as a function of distance and molecular weight.
0 5 10 15 20 25 30 0.0 2-0.03 0.0 3-0.04 0.0 4-0.05 0.0 5-0.06 0.0 6-0.07 0.0 7-0.08 0.0 8-0.09 0.0 9-0.1 0.1-0 .11 0.1 1-0.12 0.1 2-0.13 0.1 3-0.14 0.1 4-0.15 0.1 5-0.16
Diameter ( m)
Fr eq ue nc y (% )
4.4.5. Effect of Feed Rate on morphology of nanofibers
Three feed rates were chosen to determine the effect of mass throughput (15, 50 and 100 µl/min) on fiber morphology. Other parameters such as concentration, voltage and distance were kept constant at 15 wt %, 15 kV and 15 cm respectively. The general trend depicted an increase and then decrease in fiber forming tendency as the feed rate was progressively increased.
At 15 wt % concentration, medium molecular weight nylon-6 was chosen to ascertain the effect of varying feed rate. Nanofibers with typical beads on string structure were observed at 15 µl/min. When the feed rate was increased to 50 µl/min, frequency of beads declined and more slender nanofibers were noticed. Finally, at a rate of 100 µl/min, no nanofibers were formed, instead a thick rope like structure was seen (Fig. 9 a,b,c). At 15 wt % concentration similar results were seen for high molecular weight nylon-6. As the feed rate was increased from 15 to 100 µl/min, morphology shifted from un-beaded nanofibers to non-uniform nanofibers with beads (Fig. 9 d,e,f). At 10 wt % concentration high molecular weight nylon-6 gave analogous results which further verify our earlier results (Fig. 9 g,h). As the feed rate increases, more polymer is available at the needle tip to be electrospun which exceeds the rate of removal at a fixed electric field and therefore this mass imbalance gives rise to beaded or thick nanofibers.
was increased from 15 to100 µl/min in the case of high molecular weight (15 wt %) nylon-6.
Fig 9 a. MMWC2V2F1D2 Fig 9 b. MMWC2V2F2D2 Fig 9 c. MMWC2V2F3D2
Fig 9 d. HMWC2V2F1D2 Fig 9 e. HMWC2V2F2D2 Fig 9 f. HMWC2V2F3D2
Fig 9 g. HMWC1V2F1D2 Fig 9 h. HMWC1V2F2D2
Figure 9: Effect of Feed Rate
Fig 10 (a)
Fig. 10 (b)
Figure 10 (a, b) Effect of Feed rate on diameter distribution on high Mw (Fig 10 a) and medium Mw (Fig 10 b) shows an increase overall diameter size with an increase in feed rate.
4.4.6. Mechanical Testing of Nanofibrous mats
As the molecular weight of a polymer increases, mechanical properties also increase due to increased number of chain entanglements. However, it is unclear what the effect of
0 5 10 15 20 25 30 0.0 2-0.03 0.0 3-0.04 0.0 4-0.05 0.0 5-0.06 0.0 6-0.07 0.0 7-0.08 0.0 8-0.09 0.0 9-0.1 0.1-0 .11 0.1 1-0.12 0.1 2-0.13 0.1 3-0.14 0.1 4-0.15 0.1 5-0.16 Diameter (µm) Fr eq ue nc y (% )
MMW 15 wt %, 15 µl/min MMW 15 wt %, 50 µl/min 0 5 10 15 20 25 30 0.02-0 .03 0.03-0 .04 0.04-0 .05 0.05-0 .06 0.06-0 .07 0.07-0 .08 0.08-0 .09 0.09-0 .1 0.1-0. 11 0.11-0 .12 0.12-0 .13 0.13-0 .14 0.14-0 .15 0.15-0 .16 Diameter (µm) F re q u en cy ( % )
Mw has on the mechanical properties of the fibrous mat would be, since the mechanical properties are dependent on both fiber properties as well as the bond strength of fiber-fiber junctions. As Mw increases we expect fiber-fiber strength/modulus to increase, however we are unsure of the effect Mw will have on the strength of the fiber-fiber weld points. (We would expect the interdiffusion to decrease as Mw increases, but are unsure of how that will effect the weld strength).
Table 6. Tensile properties of electrospun nylon-6 web
Electrospun web Tenacity (kgf) Elongation at
break (%) (kgf/mmModulus 2)
HMW 0.4 ± 0.07 16.6 ± 2.5 5.1 ± 0.59
MMW 0.312 ± 0.019 18.65 ± 0.75 4.37 ± 0.59
LMW 0.15 ± 0.02 9.3 ± 1.7 3.26 ± 0.21
4.5. Conclusion
In the present endeavor, the electrospinning technique was used to produce nanoscale fibers of nylon-6. The core objective of this study was to fabricate nanofibers of high molecular weight of nylon-6 for understanding entanglement of linear polymer chains and its effect on morphology and jet stability of electrospun fibers. To substantiate our study it was necessary to probe low and medium molecular weight nylon-6 and compare with the high molecular weight nylon-6. Variation in surface tension was insignificant with an increase in molecular weight and concentration of polymer. Molecular weight and concentration are prime factors affecting the morphology of the nanofibers. At same concentration level, low molecular weight nylon-6 formed small droplets, while medium molecular weight fibers just started to form nanofibers but high molecular weight nylon-6 formed mats of nanofibers. An increase in relaxation time (as molecular weight increases) suppresses the jet instability due to increased chain entanglements, forming unbeaded and continuous fibers.
molecular weight nylon-6 it was possible to manufacture nanofibers even at low voltages as against low and medium molecular weight nylon-6. With an increase in tip to collector distance, (thereby increasing the time of flight of nanofibers), a reduction in diameter size is observed. The diameter of electrospun nanofibers increased with an increase in feed rate. Favorable feed rate to produce nanofibers was higher in case of low molecular weight and lower in case of high molecular weight nylon-6. Mechanical properties showed that tenacity as well as modulus increase as molecular weight is increased with no negative effects on the fiber-fiber weld points.
4.6. Acknowledgements:
4.7. References
1. Huang-Zhang, Y. Z.; Kotaki, M.; Ramakrishna, S. Composites Science and Technology2003, 63, 2223.
2. Pedicini, A.; Farris, R. J. J Polym Sci Nylonrt B: Polym Phys 2004, 42, 752. 3. Deitze, J. M.; Kosik, W.; McKnight, S. H.; Beak-Tan, N. C.; Desimone, J. M.;
Crette, S. Polymer 2002, 43, 1025.
4. Ding, B.; Kim, H. Y.; Lee, S. C.; Shao, C. L.; Lee, D. R.; Park, S. J.; Kwag, G. B.; Choi, K. J. J Polym Sci, Part B: Polym Phys 2002, 40, 1261.
5. Dai, H.; Gong, J.; Kim, H. Y.; Lee, D. R. Nanotechnology 2002, 13, 674.
6. Deitzel, J. M.; Kleinmeyer, J.; Harris, D.; Beck-Tan, N. C. Polymer 2001, 42, 261.
7. Reneker, D. H.; Chun, I. Nanotechnology 1997, 7, 216. 8. Bergshoef, M. M.; Vancso, G. J. Adv Mater 1999, 11,362. 9. Doshi, J.; Renker, D. H. J Electrostat 1995, 35, 151.
10.Gibson, P. W.; Schreuder-Gibson, H. L.; Riven, D. AIchE J 1999, 45,190. 11.Fong, H., Renker, D. H. Structure formation in polymeric fibers’, In Salem, D.
R.; Sussman, M. V., Editors. Electrospinning and formation of nanofibers; Hanser: Munich, 2001, Chapter 6.
12.Hou, H.; Jun, Z.; Reuning, A.; Schaper, A.; Wendorff, J. H.; Greiner, A. Macromolecules 2002, 35, 2429.
13.Kenawy, E. R.; Bowlin, G .L.; Mansfield, K.; Layman, J.; Simpson, D. G.; Sanders, E. H. Journal of Controlled Release 2002, 81,57.