Abstract
GIBSON, NATHAN SCOTT. An Engineering Design Approach for Accelerating Innovative Design Solutions in a Rapid Prototyping Environment.
(Under the direction of Dr. Timothy G. Clapp)
With time as a major competitive factor in today’s marketplace, it is crucial to
bring products to the market and solve problems in existing products in a swift manner.
Rapid prototyping methods are very effective ways of streamlining this effort. However,
current rapid prototyping methods generally apply after a solution concept has been
selected. Many current conceptual design methods were reviewed and it was shown that
a need exists for similar acceleration of the problem identification, idea generation, and
concept selection portions of the design process. This would bring the conceptual front
end of the design process under the umbrella of what is considered “rapid prototyping”.
The Ideal Final Result (IFR) of each of the three major conceptual steps was developed to
be able to formulate a series of steps to accelerate the process by performing only what is
necessary to accomplish the IFR’s. The existing methods and custom-designed methods
provided for filling in what was needed for each step. An “Ideality-based” concept
selection method was developed to make the idea selection process more complete. The
entire methodology is explained in detail, and a case study to use the new methodology
was performed on an existing, real problem situation to show the useful and accelerated
An Engineering Design Approach for
Accelerating Innovative Design Solutions in a
Rapid Prototyping Environment
By
NATHAN S. GIBSON
A thesis submitted to the Graduate Faculty of North Carolina State University
In partial fulfillment of the Requirements for the Degree of
Master of Science
TEXTILE ENGINEERING
Raleigh, North Carolina 2000
APPROVED BY:
____________________________ ____________________________ Dr. Jon Rust Dr. Joseph David
Textile Engineering, Chemistry, Mechanical Engineering and Science
____________________________ Dr. Timothy G. Clapp, Chair Textile Engineering, Chemistry,
Biography
I, Nathan S. Gibson, was born in Wilmington, North Carolina in 1977. As I grew up, I had the opportunity to live in many places throughout North Carolina. Upon
graduation from high school in 1995, I attended North Carolina State University to obtain a Bachelor of Science degree in Textile Engineering, which I received in 1999. During the course of my undergraduate studies I developed significant interest in machine design and innovative problem solving. Therefore, I felt that graduate school was an ideal way to develop and satisfy these interests, and I remained at N.C. State to continue my education. In December of 2000, I will receive a Master of Science degree in Textile Engineering with a minor in Mechanical Engineering.
Acknowledgements
I would like to thank the United States Army Natick Research, Development, and Engineering Center and the College of Textiles for providing the financial support necessary to make this project possible. In addition I would like to extend sincere gratitude to Dr. Tim Clapp for his guidance, mentoring, and genuine care, at both the graduate and the undergraduate levels. I would like to thank Dr. Jon Rust and Dr. Joseph David for their participation as members of my Graduate Committee. I would also like to thank Bob Bennett of Clemson University, Hai Bui, Tom Moretto, and Steve Szczesuil of Natick Labs for their valuable technical support. I would like to provide additional acknowledgement to the College of Textiles secretarial staff, without whom many important things would have been much harder to accomplish.
Table of Contents
List of Tables viii
List of Figures ix
1.Introduction 1
1.1Global Competition 1 1.2 Cycle Time Reduction 2
1.3 The Design Process 3 1.3.1 Problem Identification 3
1.3.2 Problem Definition 3
1.3.3 Information Gathering 4
1.3.4 Idea Generation 4
1.3.5 Concept Selection 4
1.3.6 Conceptualization 5
1.3.7 Analysis 5
1.3.8 Prototyping 5
1.3.9 Design Optimization 5
1.3.10 Commercialization 6
1.4 Rapid Prototyping 6
1.5 How This Research Will Address These Issues 6
2. Literature Review 8
2.1 Introduction 8
2.2 Rapid Prototyping 8
2.2.1 Rapid Prototyping History 8
2.2.2 Rapid Prototyping Development 9
2.2.3 The Rapid Prototyping Process 10
2.3 Problem Identification 18
2.3.1 Eppinger/Ulrich Problem Identification 18
2.3.2 Zlotin/Zusman/Terninko TRIZ Problem Identification 23
2.3.3 Quality Function Deployment 27
2.3.4 The Collaborative Innovation Process 31
2.4 Idea Generation 35
2.4.1 Brainstorming 35
2.4.2 Fishbone Diagram 38
2.4.3 Zlotin/Zusman/Terninko TRIZ Concept Generation 39
2.4.4 Synecties 48
2.4.5 Axiomatic Design 49
2.5 Concept Selection 51
2.5.1 Pugh Concept Selection 51
2.5.2 Eppinger/Ulrich Concept Selection Method 53
2.6 Summary 57 3. Problem Identification in Rapid Prototyping 58
3.1 Introduction 58
3.2 Theory Development Methodology 59
3.3 Application of Theory Development Model to Problem Identification 60 3.3.1 IFR Formulation 60
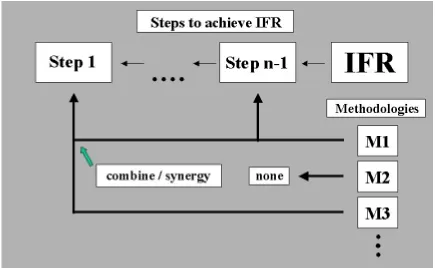
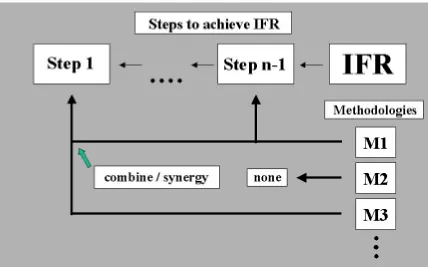
3.3.2 "Steps to Achieve IFR" Formulation 60
3.3.3 Application of Reviewed Methods 62
3.4 Conclusion 67
4. Idea Generation in Rapid Prototyping 68
4.1 Introduction 68
4.2 Theory Development Methodology 69
4.3 Application of Theory Development Model to Idea Generation 70
4.3.1 IFR Formulation 70
4.3.2 "Steps to Achieve IFR" Fon-nulation 70
4.4 Conclusion 76
5. Concept Selection in Rapid Prototyping 77
5.1 Introduction 77
5.2 Theory Development Methodology 78
5.3 Application of Theory Development Model to Concept Selection 79
5.3.1 IFR Formulation 79
5.3.2 "Steps to Achieve IFR" Formulation 79
5.3.3 Application of Reviewed Methods 80
5.4 Conclusion 86
6. Case Study: Design Application of Model 87
6.1 Introduction 87
6.2 Conceptual Design Methodology for Rapid Prototyping (Summary) 88
6.3 Case Study Problem Situation 92
6.4 Overview of Non-Sewn Seaming Methods 93
6.4.1 Ultrasonic Welding 93
6.4.2 Adhesive Joining 94
6.5 Presentation of Partial Design 95
6.5.1 Assessment 95
6.5.2 Felled Seam Formation 96
6.5.3 Presentation of Design 98
6.5.4 Adhesive Delivery Mechanism 102
6.5.5 Statement of Case Study Problem 104
6.6 Case Study Application of Methodology 105
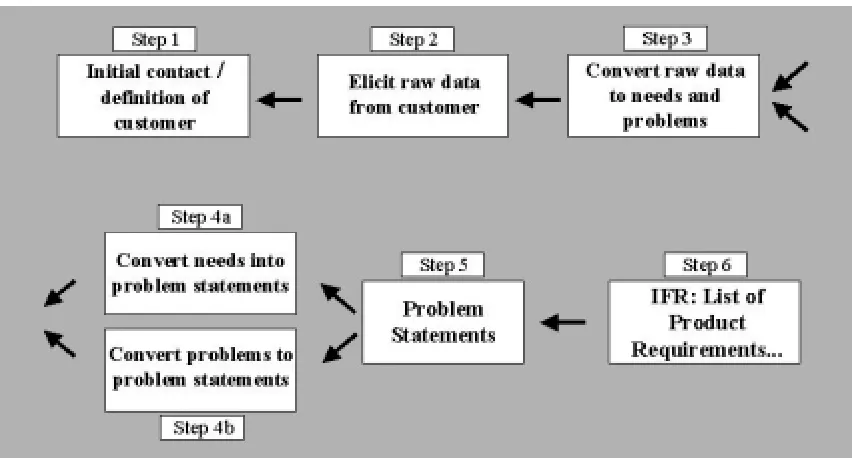
6.6.1 Initial Contact / Definition of Customer 105
6.6.2 Elicit Raw Data From Customer 105
6.6.3 Convert Raw Data to Needs and Problems 108
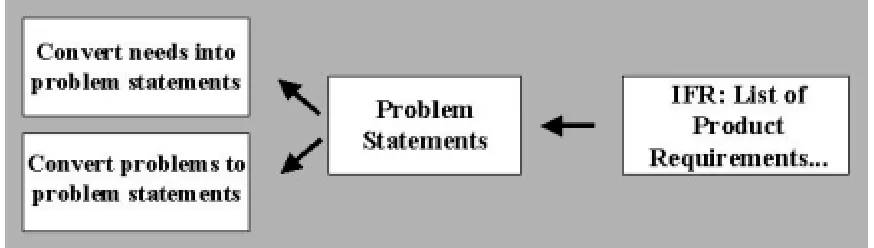
6.6.4 Convert Needs to Problem Statements 109
6.6.5 Problem Statements 110
6.6.6 Product Requirements 110
6.6.8 Narrow the Scope for Innovation 111 6.6.9 Generate Solution Concepts 112 6.6.10 Ensure Concepts Fulfill Problem Statements 116
6.6.11 Refinement 116
6.6.12 Final List of Solution Concepts 116
6.6.13 Ensure Concepts are Unique 116
6.6.14 Reduce the Number of Concepts with Broad Criteria 117
6.6.15 Rank Concepts with Strict Criteria 118
6.6.16 Select Concept 121
6.6.17 One Concept 122
6.7 Usefulness of Methodology 122
6.8 Conclusion 123
7. Conclusions and Future Work Recommendations 124
7.1 Conclusions 124
7.2 Future Work 126
List of Tables
Table 1-1: Steps in the Traditional Design Process 3 Table 2-1: Osborn’s Checklist for Adding New Ideas 36
List of Figures
Figure 2-1: The Rapid Prototyping Wheel (The 4 Major Aspects of RP) 10 Figure 2-2: The Generalized Rapid Prototyping Process 11 Figure 2-3: Three Methods of Producing 3-D Custom Objects 12 Figure 2-4: Solid Model Construction of a Guide Track 12
Figure 2-5: Three Methods of Representing Objects 13
Figure 2-6: A 3-D Block and its .STL representation 15 Figure 2-7: Major Rapid Prototyping Part Formation Techniques 16
Figure 2-8: Function Diagram example 26
Figure 2-9: House of Quality matrix 28
Figure 2-10: Fishbone Diagram example 39
Figure 2-11: Idea Generation: Conventional vs. TRIZ 41
Figure 2-12: Contradiction Analysis Procedure 42
Figure 2-13: Contradiction Table 43
Figure 2-14: S-curve Descriptors 46
Figure 2-15: The Smallest Su-Field Model 47
Figure 2-16: Pugh Matrix 51
Figure 3-1: Theory Development Model 59
Figure 3-2: Status of Development Model 61
Figure 3-3: “Steps to Achieve IFR” for Problem Identification 62 Figure 3-4: Different Visions of Product Attributes 63
Figure 4-1: Theory Development Model 69
Figure 4-2: “Steps to Achieve IFR” for Idea Generation 71
Figure 5-1: Theory Development Model 78
Figure 5-2: “Steps to Achieve IFR” for Concept Selection 79 Figure 5-3: Ideality-Based Concept Selection Matrix 82 Figure 5-4: Weighted Ideality-Based Concept Selection Matrix 84
Figure 6-1: Methods Used for Each Step 91
Figure 6-3: Ultrasonic Welding Technology 94
Figure 6-4: Typical Felled Seam Folder 96
Figure 6-5: Typical Felled Seam Folder 96
Figure 6-6: Felled Seam Formation 98
Figure 6-7: Felled Seam Bonding Mechanisms 98
Figure 6-8: ZYPPY Alignment Device 99
Figure 6-9: Alignment System 100
Figure 6-10: Z-folder System 101
Figure 6-11: Z-folder Helical Rods 101
Figure 6-12: Helical Folding Action 102
Figure 6-13: Adhesive Nozzles 102
Figure 6-14: Available Resources for Adhesive Felled Seaming System 106
Figure 6-15: Conversion of Statements to Needs 108
Figure 6-16: House of Quality for Adhesive Insertion 109 Figure 6-17: Ideality-based Concept Selection Matrix 117
Figure 6-18: Concept 1 118
Figure 6-19: Concept 2 119
Figure 6-20: Concept 3 119
Figure 6-21: Concept 4 120
1. Introduction
1.1. Global Competition
The globalization of the marketplace is one of the most important challenges facing companies today. International competition has been aided in recent years by many things. The trend toward increasing dissolution of boundaries, provided by regional treaties such as NAFTA and the European Union, has served to unify markets.
Standardization of manufacturing and processes, such as provided by ISO-type programs and certifications, brings companies and manufacturers around the world to a more level plane. The emergence of information technology, especially the World Wide Web, has resulted in a free flow of information and provided a means of fusing world markets. The effect of these and other developments has served to increase receptivity to global brands and foreign products. Companies face stiff competition, even in home markets, because competitors are increasingly able to take advantage of global strategy [1].
1.2. Cycle Time Reduction
Cycle time describes the duration needed to accomplish a procedure with a pre-established set of steps [3]. For the purposes of this analysis, directed at product engineering and development, cycle time is the “mind-to-market” time for a product, from the first idea or charge from a customer to commercialization. With the advent of a globalized marketplace and the challenges that follow, cycle time for product developers has become quite competitive. To survive, companies must reduce product delivery times while retaining or increasing profitability. The faster a company can identify a market need and produce goods to meet that need, the better it will perform against competitors who are after the same thing. However, other factors must be considered. While reduction of cycle time can result in advantages in market share and profitability, development also may be done in such haste that the product has not been sufficiently debugged, or the wrong technology may have been chosen [4]. So, when reducing product cycle time, the goal is not to cut corners or skip steps, but to carry out the task of developing the product in a shorter timespan.
1.3. The Design Process
Time is a major competitive factor in today’s marketplace. In product development, the design portion of the cycle time usually constitutes a substantial portion of the total cycle time, and is probably the biggest factor in making or missing a product delivery schedule [5]. Therefore, the design process has been a major focus for time reduction strategies. As part of this analysis, the steps of the traditional engineering design process, shown below in Table 1.1, will be explained. There are many different variations in design process methodologies, but constants exist within most of these, and the steps presented here are generic but necessary and important ones that should be present in any
Step 1 Problem Identification Step 2 Problem Definition Step 3 Information Gathering Step 4 Idea Generation Step 5 Concept Selection Step 6 Conceptualization Step 7 Analysis
Step 8 Prototyping
Step 9 Design Optimization Step 10 Commercialization
Table 1-1: Steps in the Traditional Design Process
1.3.1. Problem Identification
At the very beginning it must be determined what is exactly the problem to be solved, for the rest of the design process will focus on solving what has been identified as the
problem. It is not guaranteed that this identification is the correct problem to solve, so this problem identification is a very important first step. A problem to be solved may be many things. It may be, among other things, an inadequate or insufficient current situation that needs correction. Or it may be a nonexistent situation with only a goal. Generally, a need reflects dissatisfaction with an existing condition, and the desired solution may be expressed in several ways, such as: improve the item’s reliability, reduce the cost of the product, or improve product performance and efficiency [6]. Once the goal is articulated, a clear view of the objective is visible and the design process can continue in that direction.
1.3.2. Problem Definition
constraints must be developed, whilst not putting up barriers to solutions that may be found within a wide area. Declarations of what the final design must contain need to be stated. When this important step in the design process is carefully completed, a clearer picture of how the design process will progress is seen, and the chances of obtaining more innovative or unconventional solutions can be increased.
1.3.3 Information Gathering
In this stage, one should collect as much information as possible about the problem and surrounding issues. This includes a history of the current design and ones similar to it, the technology behind the design (i.e. physical principles, natural or induced effects, etc.), other attempts to solve the problem, and similar problems in other fields. Becoming as much of a subject matter expert about the problem and its surroundings will aid
tremendously in the development of solution ideas and concepts, as well as providing a good general understanding of what is being considered.
1.3.4 Idea Generation
In this stage, ideas are developed that are potential solutions to the problem or parts of the problem. Many techniques are available for the generation of ideas that are constructive to the design endeavor, some of which will be later considered. This is not the stage for eliminating or critiquing ideas; concepts should be developed and recorded. This is a very important step, for many subsequent steps in the design process will use the results of this idea generation stage in an attempt to direct and shape them towards the final objective.
1.3.5 Concept Selection
ensure that it meets all requirements and follows design constraints; it must meet the customer’s needs.
1.3.6 Conceptualization
This step comes when the designer has selected one or a few ideas to develop to a conceptualized design. Three-dimensional solid modeling is a useful tool for
conceptualizing ideas. The designer can use this stage to better determine the feasibility of a concept, to more effectively communicate to others the concept, or to design the entire system that utilizes a chosen concept.
1.3.7 Analysis
In this stage, the solution concept(s) are analyzed for true feasibility. The designs are checked against physical laws or with an engineering analysis such as Finite Element Analysis to determine if they are viable solutions. This analysis stage can also be used for determining the best design, if not already done.
1.3.8 Prototyping
This stage is where the chosen design is transformed into a model or prototype to test the design. There are many ways to do this. This stage allows the design to be subjected to real-life issues not seen on paper, such as methods of assembly and durability, and design flaws can be detected. This can be a lengthy process, and much research is being devoted to the reduction of this time. It is however a very important step because it allows
visualization of the design in hardware and provides an opportunity for testing the design.
1.3.9 Design Optimization
1.3.10. Commercialization
This final stage of the design process is where the product design is ready for production and delivery to the customer. This stage may not be applicable for some designs, such as a custom design meant for research or a singular customer, but if the product is to be produced on a larger scale this is a necessary step. Factors such as production volume, assembly methods, production facilities and more must be considered. Most importantly, the design must be at a stage where it is reliable enough to be commercialized.
1.4. Rapid Prototyping
Prototyping a design is a crucial step in the product development process, as previously stated. However, for the past decade, significant focus has been placed on speeding up the process of producing an initial model of a design, and this has been termed “rapid prototyping”. Through many different types of part manufacturing, rapid prototyping has helped designers and engineers shorten the design cycle by allowing a prototype to be made in a few hours rather than a few weeks. Rapid prototyping stems from the advent of computer generated three-dimensional modeling of parts. From there, computer files are converted into a format that allows a machine to fabricate the part layer by layer from cross-sections. There are many different variants and methods of this procedure, but this is the basic rapid prototyping concept. These rapid prototyping systems can directly produce actual parts for experimentation and observation. Part complexity does not have the effect on part production as machining. Therefore, immense benefits can be realized from the ability to produce parts quickly.
1.5. How This Research Will Address These Issues
conveniently define the conceptual stage out of existence-or more precisely, out of their minds. They simply define the start of a development project as when they have
approved a concept [7]. What must be realized is that the time that exists in the design stages from problem identification to concept selection is included in the cycle time, which starts when a market need or opportunity arises. So, there exists a tremendous need to accelerate this portion of the design process in much the same way that rapid prototyping has accelerated the rest of it.
2. Literature Review
2.1. Introduction
This research will address the opportunities present to accelerate the design process during the conceptual stages; that is, problem identification, idea generation, and concept selection. Much progress has been made in the field of rapid prototyping, but the need exists for similar advancements in the early parts of the design process, which when completed will result in a completeness in design methodology that serves to reduce cycle time for the entire product development process. A review of rapid prototyping will be presented. Then, reviews of current problem identification, idea generation, and concept selection techniques will be submitted, for the dual purpose of showing the present state of these design process steps and comparing them to the latter stages of the design process that have been accelerated by rapid prototyping technology. This will show the need for a systematic approach to accelerate innovative designs at the front end of the design process.
2.2. Rapid Prototyping
2.2.1. Rapid Prototyping History
The purpose of prototyping is to physically represent the concepts in a design. It has always been done, but recently, with the advent of computers and related technology, rapid prototyping has become a common practice. Prototyping has gone through three phases, the last two of which have emerged only in the last 20 years [7]. The first phase, termed Hard or Manual Prototyping, is centuries old and was not a sophisticated process. The techniques used in making these prototypes tend to be craft-based and extremely labor-intensive [7].
In the early 1980’s the second phase of rapid prototyping, Soft or Virtual
done in the virtual realm. Development in this type of rapid prototyping has been
extensive since its advent, and it remains to be a very useful tool in product development. The third phase of rapid prototyping goes back to making physical parts, but uses a technology called solid freeform fabrication, or layer manufacturing [7]. There are many techniques that use this technology, but most revolve around the basic concept of transferring a computer model file to a machine will essentially “print” the part in three dimensions by adding one layer at a time. Very complex parts can be produced in this fashion and this third phase of rapid prototyping has contributed much to product development.
2.2.2. Rapid Prototyping Development
The aspects of rapid prototyping can be seen in four distinct areas. They are: input, method, material, and applications [7]. The role of each in rapid prototyping technology will be discussed.
2.2.2a. Input
This is the electronic information about the design that will be required to formulate the prototype. It may be a computer-generated three-dimensional model of the design or objects in the design, or it may be a representation of an existing physical object in a computer format, which has most likely been obtained by reverse engineering with a variety of equipment.
2.2.2b. Method
There are more than 20 vendors for rapid prototyping systems, and there are several categories that these systems will tend to fall under; photo-curing, cutting and gluing/joining, melting and solidifying/fusing, and joining/binding [7].
2.2.2c. Material
2.2.2d. Applications
Products made with rapid prototyping technology are used in many phases and aspects of product development, including design, engineering, analysis, planning, tooling, and manufacturing. A wide range of industries currently use this technology.
Shown below in Fig 2-1 is the Rapid Prototyping Wheel, which shows the four aspects of rapid prototyping, each with accompanying details.
Figure. 2-1: The Rapid Prototyping Wheel (The 4 Major Aspects of RP) [7]
2.2.3 The Rapid Prototyping Process
Figure 2-2: The Generalized Rapid Prototyping Process
2.2.3a. 3-D Solid Modeling
To begin the rapid prototyping process, a design must exist. Solid modeling is an excellent way to accomplish this. A solid model is a computer-based representation of a physical object. The basic difference between solid models and 2D and 3D CAD models is that solid models contain information about the nature of the space enclosed by the geometry used to describe the object [10]. Solid modeling software allows the user to construct objects and groups of objects in a three-dimensional coordinate system. The user may move, rotate, join, and separate objects in the three-dimensional space as if they were in actuality.
Solid modeling technology as known today began to develop in the early 1970’s. There was a common goal among those competing to develop such systems, that being to be able to create complex three-dimensional shapes in a virtual environment, but
differences existed in ideas of how to represent the data in the computer [10]. Currently, standards have been adopted and competitors offer different functionality with their respective software packages. The advent of the personal computer and significant developments in computing technology have led to a dramatic increase in the availability and usefulness of solid modeling.
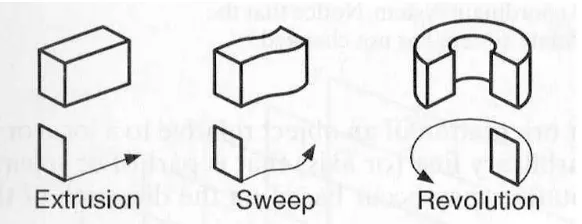
create a valid dimensional object. Some common methods of producing three-dimensional parts in this fashion are extrusion, sweep, and revolution. Shown below in Figure 2-9 are visual representations of these techniques.
Figure 2-3: Three Methods of Producing 3-D Custom Objects
These techniques can also be used to remove material from an existing object, to create custom designs. By using other techniques such as blending or filleting edges and trimming or extending surfaces, along with combinations of techniques, virtually any three-dimensional object can be created on the computer. Shown in Figure 2-3 is an example of how an object is created by using these techniques.
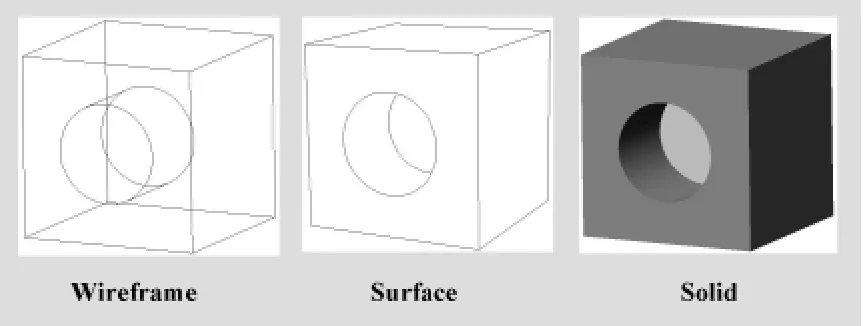
Solid models may be represented and viewed in three different ways in the virtual world. These are wireframe, surface, and solid. Wireframe representation is where only the edges of an object are shown constructed by points in space connected by lines. In surfaces, objects are represented by modeling selected surfaces, and realistic shaded images can be produced. In solid, objects are represented by the 3D space they occupy. Shown in Figure 2-5 are examples of these three ways of representing objects.
Figure 2-5: Three Methods of Representing Objects
There are many advantages to using 3-D solid modeling in product development and rapid prototyping. In addition to being able to accurately represent objects virtually, with the ability to manipulate them not unlike in the real world, it can be done very quickly. Current software is very user-friendly, intuitive, and easy to use. Entire assemblies such as complex machines or intricate modern part designs can be designed on the computer. Designing in this fashion is very advantageous because changes can be made very quickly. The natural process of having design iterations can be performed virtually, which saves time because it can be done much faster, and saves money because each iteration is not a prototype that was built and wasted.
such that some of it occupies the same three-dimensional space as that of another object. The software can detect when this has occurred and alert the user for correction.
Animation is another capability of solid modeling that can be very useful. Objects can be made to move, rotate, or have relative motion to other objects. These animations can be used to show how parts will move in real life when a prototype is built, to prove a design concept, to compare multiple design concepts, or simply to augment the presentation of a design. This technology is very advanced and it is common to be able to direct part motions along a time curve and export that information to a computer movie file for presentation independent of the solid modeling software.
Another extremely useful advantage of solid modeling is the ability to perform engineering analyses on the designs. Finite Element Analysis (FEA) tools exist that are able to perform stress/strain, deformation, and thermal calculations. The object can be virtually subjected to constraints, pressures, forces, or temperatures specified by the user. Material properties of the object are also specified. Then, the designer can inspect the results of the analysis. Color bands usually represent stresses in the object, and actual deformations of the objects show the effects of forces or pressures. These analytical tools are very useful because a designer or an engineer can see what will happen to the object in real life when subjected to the forces and placed in the environment for which it is intended.
2.2.3b. Data Conversion and Transmission
After the 3-D model has been completed, it must be converted into a format that the rest of the rapid prototyping system can interpret. This is a very simple and cursory step in the rapid prototyping process, but it is very important. Most, if not all, CAD/CAM vendors and rapid prototyping component manufacturers use a common format based on the stereolithography system, and this format is an .STL file. The .STL file is a
Figure 2-6: A 3-D Block and its .STL representation
2.2.3c. Checking and Preparation
It is a very common occurrence for .STL files to be faulty. This usually results from either errors in the CAD model or non-robustness of the CAD-STL interface [7]. There may be unwanted shell punctures (holes, gaps, cracks, etc.) in the model, which will result in a faulty .STL file. Software exists that will locate and correct such errors. This process is tedious and time-consuming because of the vast amount of geometric entities that are usually present in CAD models, but it is necessary in order to obtain a valid .STL representation of the model. Once this has been accomplished, it is necessary to prepare to form the actual prototype. The building parameters must be set, based on which type of rapid prototyping system will be used (liquid, solid, powder, etc.) and how the build will proceed. This includes determination of geometrical objects, assembly
characteristics, building orientation, spatial assortments, arrangement with other parts, support structures, and slice parameters [7].
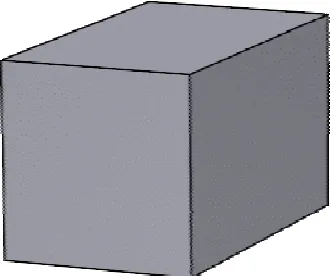
2.2.3d. Building
Figure 2-7 Major Rapid Prototyping Part Formation Techniques
In the subtractive process, the prototyping process begins with a block of material and the part is formed by removing material. An additive process is where material is added, usually in layers, to form the model. A formative process is where material is formed into the correct parameters by forces (stamping) or molds.
2.2.3e. Post-processing
This is the final step in the rapid prototyping process. Cleaning, post-curing, and finishing are typically performed to complete the prototyping process. Cleaning is to remove excess elements that may have remained after the build, such as resin trapped in holes or slots, or where excess unused powder needs to be removed. Solvents are often used in cleaning. Only some liquid-based systems require post-curing, where pockets of liquid need further treatment to cure. The task of finishing involves modifications such as sanding and painting, as well as any additional machining processes.
2.2.4. Advantages of Rapid Prototyping
Rapid prototyping also has affected the designs that can be put forth. Product designers can increase part complexity with little effect on lead time and cost [7]. With less manufacturing restrictions, designs can be more optimized to meet customer requirements. Also, parts that earlier could not be constructed with conventional machining technology can now be easily formed using rapid prototyping techniques.
The consumer benefits from rapid prototyping because the products which they buy are more likely to meet individual needs and wants because of a more diverse offering of products, more customization is possible, and they will be available at lower prices. Over the past 25 years, prototype complexity has increased while project
2.3. Problem Identification
The success of a product is determined by how well the customer is satisfied by the product at the end of the development process. In order to obtain maximum customer satisfaction, their needs must be determined to identify the problem before the design process begins. Needs are largely independent of any particular product that might be developed; they are not dependent upon the concept that will be chosen. A product development entity should be able to identify customer needs without knowing if or how it will address those needs. Needs are different than specifications, which do depend on the concept selected. Product specifications depend on what is technically and
economically feasible and on what competitors offer in the marketplace, as well as on customer needs [9]. There are many theories and methodologies for identifying the problem based on the needs of the customer, and the following will highlight a diverse array of these.
2.3.1 Eppinger/Ulrich Methodology
In their book, “Product Design and Development”, Eppinger and Ulrich present a method for the process of identifying customer needs and translating those needs into product specifications [9]. It is not meant to be a rigid process, but is intended to provide structure to the very important and potentially arduous task of identifying the problem. This can aid in interaction with the customer, which is very important because the entity developing the product can better provide for the customer if the customer’s environment and point of view are understood. Each step of this methodology will be considered.
2.3.1a. Define the Scope of the Effort
Although this step is usually precedes the product development process, it is very
2.3.1b. Gather Raw Data From Customers
The product developer must elicit information from the customer. Creating an open channel for information flow can be very helpful. While the type of customer and
product being dealt with will affect how this is done, Eppinger and Ulrich have presented some generic ways of creating the information channel. Three methods of
communication with the customer are commonly used. They are interviews, focus groups, and observing the product in use. Each has its own benefits and limitations, and using one of them or a combination of them may be effective. However, it must be resolved who should be the customers considered. Needs can be identified more efficiently by interviewing a class of customers who experience needs months or years ahead of the majority of the marketplace and stand to benefit substantially from product innovations. Eppinger and Ulrich denote these customers as “lead users”. These lead users should be a focus of the data collection effort because they can often articulate emerging needs or may have already invented solutions to meet the needs. Thus, the product development entity may be able to identify needs that are still latent for the majority of the marketplace [9]. Latent needs are needs which are neither fulfilled nor commonly articulated or expressed. This can results in anticipating trends and beating the competitors to the market.
Gathering needs data should be an exercise in listening, interpreting, and asking the right questions. The goal is to elicit from the customer all of the needs that may exist in order to formulate the correct problem, and ultimately, to deliver a product that will satisfy the customer. Eppinger and Ulrich prepared the following interview guide containing helpful questions and prompts to facilitate a structured dialogue:
• Walk us through a typical session using the product.
• What do you like about the existing products?
• What do you dislike about the existing products?
• What issues do you consider when purchasing the product?
• What improvements would you make to the product?
• Go with the flow – If the customer gives information in a manner different than the interview guide would elicit, it may provide unexpected information.
• Use visual stimuli and props – Customer reactions to existing and competitors’ products may provide valuable information.
• Suppress preconceived hypotheses about the product technology – Customers frequently will make assumptions about the product concept that they expect to meet their needs. This type of dialogue should be suppressed in favor of that which will produce information about underlying needs that should be satisfied by the design.
• Have the customer demonstrate the product and/or typical tasks related to the product – This can produce valuable information that can be used when formulating design specifications.
• Be alert for surprises and the expression of latent needs – Unexpected statements from the customer need to be followed up on. This could easily reveal latent needs that should be incorporated into the design.
• Watch for non-verbal information – Body language, expressions, and other non-verbal clues can offer insights into other customer needs.
2.3.1c. Interpret Raw Data In Terms of Customer Needs
After the interview or discussion with the customer, it is very helpful to fill in a data template to organize and document the interaction. In it should be the question or prompt posed, the verbatim statements the customer made, and the customer need implied by that statement.
2.3.1d. Organize the Needs into a Hierarchy
2.3.1e. Establish the Relative Importance of the Needs
It would now be necessary to establish the relative importance that customers place on different needs. According to Eppinger and Ulrich, there are two basic ways to approach the task of ranking the needs; consensus of the product development team members based on experience with the customers and further customer surveys. The choice between the two can be determined by the team based on the time and cost to do one over the other.
2.3.1f. Reflect On the Results and the Process
The given process of identifying and cataloguing customer needs for problem
identification can be useful, but Eppinger and Ulrich stress that the team must continually challenge its results to verify that they are consistent with the knowledge and intuition the team has developed through the interaction with the customers. They provide some questions the team should ask to ensure this:
• Have we interacted with all of the important types of customers in our target market?
• Are we able to see beyond needs related only to existing products in order to capture the latent needs of our target customers?
• Are there areas of inquiry we should pursue in follow-up interviews or surveys?
• Which of the customers we spoke to would be good participants in our ongoing development efforts?
• What do we know now that we didn’t know when we started? Are we surprised by any of the needs?
• Did we involve everyone within our own organization who needs to deeply understand customer needs?
• How might we improve the process further?
remains on customer needs, and that a clear understanding of those needs exists among the development team.
The next step after eliciting the customer needs is translating those needs into product specifications. While the expressions of the customer are useful in
communicating what is needed, they rarely guide the product development entity in developing and engineering the product. Therefore, a set of specifications derived from the customer needs statements must be developed to steer the designers in the correct direction. The product specifications do not tell the product development entity how to address the customer needs, but they do represent an unambiguous agreement on what the team will attempt to achieve in order to satisfy the customer needs [9]. Eppinger and Ulrich term this set of initial specifications “Target Specifications” (to be later refined to suit the limitations of the product concept actually selected). There are three steps in this portion of the Eppinger/Ulrich methodology. They will each be discussed below.
2.3.1g Prepare the List of Metrics.
The relationship between needs and metrics is central to the entire concept of
specifications. The best way to generate the list of metrics is to contemplate each need in turn and to consider what precise, measurable characteristic of the product will reflect the degree to which the product satisfies that need [9]. Ideally, each need would be met with one metric, but often that is not the case. Frequently more than one metric is needed to meet one need.
2.3.1h Collect the Competitive Benchmarking Information
In this step, the relationship of the new product to competitive products must be determined (if such similar products exist). A good way to compare is to make a chart listing the developing product’s metrics and values for those metrics, and then listing the values for the same metrics for each competitive product.
2.3.1i Set Ideal and Marginally Acceptable Target Values for Each Metric
the metric that would just barely make the product commercially viable [9]. To set target values, the team has many considerations; including the capability of competing products available at the time, competitors’ future product capabilities, and the product’s mission statement and target market assessment [9].
2.3.2 Zlotin/Zusman/Terninko TRIZ Problem Identification
TRIZ is a Russian acronym that stands for “Theory of Inventive Problem Solving.” Founded by Genrich Altshuller in 1946, TRIZ is essentially a methodology for
developing innovative solutions for problems [11]. By analyzing thousands of patents, he found patterns and principles that repeated across all technological fields. He organized them and created a methodology to harness this information. His work prompted others to continue it, and to date millions of patents have been analyzed, and TRIZ theories and methodologies are constantly being refined.
2.3.2a Innovative Situation Questionnaire (ISQ)
One segment of TRIZ methodology focuses on identifying the correct problem to solve. The Innovative Situation Questionnaire (ISQ) is the tool used to gather customer
requirements and translate them into statements of what the problem is. Design or inventive problems are not always clearly defined and the product development team does not know all relevant information. The ISQ makes explicit all the information needed for the individuals working with innovative problems [11]. Shown below is the ISQ, from Zlotin/Zusman/Terninko.
Innovative Situation Questionnaire
1. Information about the system you would like to improve/create and its environment.
1.1.System name.
1.2.System’s primary useful function. 1.3.Current or desired system structure. 1.4.Functioning of the system.
2. Available resources.
2.1. List all available resources: substance, field, functional, informational, time, and space resources.
3. Information about the problem situation.
3.1. Desired improvement to the system or a drawback you would like to eliminate. 3.2. Mechanism that causes the drawback to occur, if it is clear.
3.3. History of the development of the problem. 3.4. Other problem(s) to be solved.
4. Changing the system.
4.1.Allowable changes to the system. 4.2.Limitations to changing the system.
5. Criteria for selecting solution concepts. 5.1.Desired technological characteristics. 5.2.Desired economic characteristics. 5.3.Desired timetable.
5.4.Expected degree of novelty. 5.5.Other criteria.
6. History of attempted solutions to the problem. 6.1.Previous attempts to solve the problem.
6.2.Other system(s) in which a similar problem exists.
2.3.2b. Problem Formulation
The Zlotin/Zusman/Terninko TRIZ methodology then provides a way to take the information learned during the completion of the ISQ and build upon it and transform it into a problem statement set. It is called Problem Formulation, and it is a process for constructing a simple cause and effect graph to show the linkage between the primary harmful function (PHF) in a system and the primary useful function (PUF). These are identified in the ISQ. A function in this context is very loosely defined; it can mean an object, a process, or even an event. The primary useful function of a system is the positive goal of the system’s existence. The primary harmful function is the entity that the design must eliminate. The graph provides a useful image of the many interrelated smaller problems included within the main problem. To effectively resolve the main problem (eliminate PHF), formulate the cause and effect relationships of all the related problems [11].
The next step in problem formulation involves wording the problems in precise phrases that describe the interaction between useful functions (Ufn) and harmful
functions (HFn). This requires that each statement contain at least two functions. There are three possible links between useful functions and harmful functions [11]. They are:
1) UFn causes HFn
2) UFn is introduced to eliminate HFn 3) Ufn is required for another Ufn
These links lead to a set of eight questions that should be asked to assure that no
relationships are forgotten [11]. They also serve to find all of the functions in the system and account for them. Four of the questions relate to useful functions, and four relate to harmful functions. The eight questions are:
Useful Functions
1) Is this useful function required for another useful function(s)? 2) Does this useful function cause any harmful effect(s)?
3) Has this useful function been introduced to eliminate a harmful effect(s)? 4) Does this useful function require another useful function(s) in order to perform?
Harmful Functions
7) Is this harmful function caused by a useful function(s)?
8) Has a useful function been introduced to eliminate this harmful function(s)?
An affirmative answer to any question identifies another function or another link in the model, and their relationships are depicted with a flow chart. It is important to ask each of the four appropriate questions for every function in the model. The graphing process may begin with either the PUF or the PHF. Use an affirmative answer to lead you to another function, either useful or harmful [11]. Shown in Figure 2-8 is an example of a problem formulation function diagram.
Figure 2-8: Function Diagram example
2.3.2c. Problem Statement Development
1a Find a way to eliminate, reduce, or prevent [ ] under the condition of [ ]. 1b Find a way to benefit from [ ].
2a Find a way to eliminate, reduce or prevent [ ] under the condition of [ ] and [ ]. 2b Find a way to benefit from [ ].
The problem identification process that TRIZ offers, consisting of the ISQ and the Problem Formulation processes, is meant to be a clear, methodical strategy for
identifying the customer requirements and then directing those into a set of problem statements from which the product development entity can launch the remainder of the project.
2.3.3. Quality Function Deployment (QFD)
Quality Function Deployment originated in the 1960’s and was systematized in the 1970’s at the Mitsubishi Kobe shipyards in Japan. Essentially, QFD is a methodology used for structured product planning and development – it enables the product
development team to clearly specify the customer’s needs and wants against how it is to be achieved. Each proposed feature is then systematically evaluated in terms of its impact within the overall product design. QFD helps define what the end user is really looking for in the way of market-driven features and benefits. It then helps to convert these into customer requirements and required product characteristics. The QFD methodology allows the early part of the product development process to be truly customer driven. In other words, it is a method for developing a design quality aimed at satisfying the consumer and then translating the consumer’s demands into design targets and major quality assurance points to be used throughout the production stage [12]. It should be noted that QFD methodology can be used throughout the design and
production process, but for this review only the portion pertaining to customer-driven problem identification will be considered.
The House of Quality (HOQ) is a graphical tool used to drive the entire QFD process. It is a large matrix that contains seven different elements, and it is “a kind of conceptual map that provides the means for interfunctional planning and
Figure 2-9: House of Quality matrix [13]
The seven elements of the HOQ are the following [13]:
1. Customer needs – This is the voice of the customer. These can be attributes, requirements, or quality levels.
3. Importance of Customer Needs – This is where weighting is applied to the customer needs in order to know the relative importance of each.
4. Planning Matrix – This is a competitive analysis of the company’s product versus competitors’ products for each customer need. There are columns to judge how much improvement is needed in the current product, how much sales leverage may result from the improvement, and a final overall score for each customer need.
5. Feature-to-Feature Correlation – Often changing a feature positively may affect other features negatively. This correlation allows one to identify such impacts and tradeoffs.
6. Prioritized Technical Descriptors or Targets – This sums the effects of all prior variables on each product feature.
These elements of the HOQ provide much-needed information that will be used extensively in the product development process. The process of constructing the HOQ has many steps, but it is not difficult. It may be a lengthy progression, but it is
worthwhile. The steps in building the HOQ are listed and explained below.
1. Customer Needs/Wants – Information is collected from the customer and the product development team creates a hierarchy of customer needs and places it in the customer needs section of the HOQ.
2. Importance of Customer Needs – The customer needs and requirements should be rated based on the question: How important is this feature to the user? Rating the needs takes constructive dialogue among members of the product development team. Most QFD analyses use a rating scale of 1 to 5, where 5 is very important and 1 is very unimportant.
3. Competitive Analysis – The current product is rated against each customer need, using a 1 to 5 scale. Competitors’ products are also rated, and listed with the current product in the planning matrix portion of the HOQ.
5. Improvement Ratio – By dividing the future goal rating by the current rating, an improvement ratio is calculated.
6. Sales Point – This column in the planning matrix gives marketing a chance to rate whether or not they would get leverage out of any improvements. The basic question being addressed here is: Given the importance of this feature to the customer, and considering the magnitude of the improvement ratio, if we in fact make a change in this feature, can you, marketing, get some leverage from such a change?
7. Score – A customer score is calculated for each individual customer need by multiplying customer importance, improvement ratio, and sales point. This value provides a hierarchy of customer needs. These raw scores are normalized to percentages.
8. Product Features/Engineering Characteristics – Using the expertise on the product development team, a list of Product Features/Engineering Characteristics is
generated.
9. Customer Needs/Product Features Relationship – Product features are entered into the HOQ matrix adjacent to the customer needs. For each cell of the relationship matrix, it is estimated whether or not there is a relationship between the column and row. The amount of relationship is represented by the following symbols: a double circle is a strong relationship and has numerical score of 9; a single circle represents a moderate relationship and has a score of 3; a triangle signifies a low or possible relationship and is given a score of 1. A blank cell signifies no relationship and implies score of 0.
10.Product Features/Engineering Characteristics Relationship Score – In each cell containing a numerical value, the relationship score (1,3, or 9) is multiplied by the corresponding percent score for the corresponding customer need. A final feature score is calculated by summing all the products in the column. The column totals represent a rank order of Product Features/Engineering Characteristics weighted by customer needs. They indicate how much influence the Product Features/Engineering Characteristics have on meeting customer needs.
The roof matrix allows the team to identify and quantify the impact, if any, that a change to one Product Feature/Engineering Characteristic may have on another. The same relational symbols are used as before. Any cell with a high correlation is a strong indicator that significant communication and caution must be used if changes are to be made.
Many valuable things are learned from the House of Quality. The combination of the Product Features/Engineering Characteristics score, the interaction values, and the amount of customer needs affected by a change in a product feature or engineering characteristic is very important in decision-making. A Product Feature/Engineering Characteristic that scores high, has little interaction with others, and relates to many customer needs is desirable. However, changing a feature or characteristic that has a low score or has many interactions may be dangerous.
These 11 steps to complete the HOQ are excellent, but they are not absolute. A company may wish to alter things to tailor it to their operation. Many variations exist in the literature. What has been presented here is a good working knowledge of what Quality Function Deployment and its main tool, the House of Quality, consists. Also, it has been shown how they can be used effectively in the portion of the product
development process that concerns gathering information from the customer and translating that into product and engineering requirements to prepare for the idea generation stage.
2.3.4. The Collaborative Innovation Process (CI)
1. Value Modeling: Create weighted stakeholder-value model, a gauge used to evaluate and select concepts
2. Innovative Focus: Identify where to focus innovation effort to add the most value 3. Innovation: Innovate in focus areas, generate concepts
4. Concept Evaluation & Selection: Evaluate concepts, using value-based gauge, and select those that add the most value
5. Risk-Reduced Development Planning (RRDP): Create a development plan to reduce risk quickly, reducing cost and time for rework.
The steps of the CI process that have relevance to the Customer
Requirements/Problem Definition portion of the design process are Steps 1 and 2. Value Modeling allows the team to gain an understanding of the relative value of a set of tangible, measurable characteristics of the product or process. Then, the team can take a proposed concept and place a gauge against it to measure its score on each characteristic, to gain a good idea of its value [17].
There are two parts to Value Modeling, Stakeholder Needs Modeling and
Simplified QFD. For Stakeholder Needs, a short list of the stakeholders’ top-level needs is developed, and their relative importance is established. A weighted average of that and a similar list made by the product development entity represent the combined stakeholder value associated with each need [17].
• Use of only one QFD table: saves time while maximizing usefulness
• Concurrency: Product and process characteristics are evaluated simultaneously
• Combines requirements of all relevant stakeholders, rather than only the customer
• Identifies contradictions that can be resolved using TRIZ principles
The next step in the CI process that has relevance to the Customer Requirements portion of the design process is Step 2, Innovation Focus. This is essentially a problem formulation strategy that guides the product development entity to focus innovative efforts in the correct place; that is, to allow the design team to “drill down in areas of the design space that present the most valuable innovation opportunities while understanding and managing the risk that competitors might pursue other areas” [17]. Innovation Focus consists of:
• Problem Formulation Modeling
• Functional Modeling
• Value Analysis
Problem Formulation Modeling has been discussed in Section 2.3.2, as part of the TRIZ review. Functional Modeling is similar to Problem Formulation Modeling, except it represents useful and harmful functions from a systems approach. That is, it provides understanding of which system elements perform which harmful and useful functions by relating supersystems, systems, subsystems, and stakeholders.
2.4 Idea Generation
Once the customer requirements have been determined and the problem has been defined, the next step is to generate solution concepts and ideas that will solve the problem whilst meeting all customer requirements. A product development entity must have a plan of attack for developing these ideas. It needs this structure because if a procedure is not followed, adverse occurrences may take place. Among these are: assuming there is only one right answer, choosing the first solution that comes to mind, being distracted by irrelevant information, and rushing the process. There are many methodologies that exist for generating solution concepts, and the following will highlight a diverse array of these.
2.4.1 Brainstorming
Brainstorming is one of the most basic techniques for generating ideas. It is routinely used in many areas, with individuals, small groups, or large groups. Typically, the initial stages of idea generation begin with an unstructured free association of ideas to solve the problem. During this activity, lists of all possible solutions are generated and should include wild or unusual solutions regardless of feasibility [15]. In this fashion, people brainstorming in groups can build upon each other’s suggestions, but a positive attitude should be maintained and no negative comments on or judgements of ideas should be allowed. The facilitator of the brainstorming session should also seek to keep in check comments that are often said but can severely diminish the quality of the session. Some of these comments include [15]:
• That won’t work
• That’s too radical
• It’s not our job
• We don’t have enough time
• That’s too much hassle
• It’s against our policy
• We haven’t done it this way before
• We’ve always done it like this
• That’s not practical
• We can’t solve this problem
It is not a new concept that brainstorming sessions usually are very productive at first and then quickly drop off after a few minutes. It is usually wasteful of time to continue after this point. However, several techniques have been developed within brainstorming theory to overcome this occurrence and generate additional ideas.
2.4.1a. Osborn’s Checklist
Within this checklist are techniques used to generate additional ideas that are related to those previously obtained. The checklist is shown in Table 2-1.
Adapt? How can this (product, plan, idea) be otherwise used as is?
Modify? Change the meaning, material, color, shape, odor, etc.?
Magnify? Add new component? Make longer, stronger, thicker, higher?
Minify? Split up? Remove something? Make lighter, weaker, thinner?
Substitute? Who else, where else, or what else? Other component or approach?
Rearrange? Interchange parts? Other patterns, layouts? Reverse roles, Re-sort?
Combine? Combine parts, ideas? Blend? Compromise?
Table 2-1 Osborn’s Checklist for Adding New Ideas [15]
2.4.1b. Random Stimulation
2.4.1c. Other People’s Views (OPV)
The inability to see a problem from various viewpoints can be a severely limiting factor in problem solving and idea generation. Imagining yourself in the role of another person allows you to see complications or aspects of the problem not considered previously. OPV works very well especially when the problem involves the thoughts and feelings of others. For example, a designer of a machine must not only take into account
engineering, but must consider the views of the consumers, the marketing personnel, management, safety, the financial departments, and maintenance personnel. Inaccurately seeing the problem from their point of view could lead to a substandard or even failed product.
2.4.1d. Futuring
Futuring is a concept generation technique that focuses on developing ideas that are not currently technologically feasible but could be in the future. Questions are asked such as: What are the characteristics of the ideal solution? What current problem would make our jobs easier when solved? What solutions would change the way we do business? A key notion in Futuring is that one must be bold enough to suggest alternatives that promise major advances, yet may only have a small probability of success [15]. The idealized solution is visualized and then work is done that will advance toward it. Listed below are the steps that should be taken when using Futuring [15]:
1) Examine the problem carefully to make sure that the real problem has been defined. 2) Imagine yourself at some point in the future after the problem has been solved. What
are the benefits of having a solution?
3) “Look around” in the future. Try to imagine an ideal solution to the problem at hand without regard to technical feasibility. Remember, in the future, anything is possible. 4) Make statements such as: “If only [ x ] would happen, I could solve [ y ].
2.4.2 Fishbone Diagram (Cause and Effect Diagram)
Dr. Kaoru Ishikawa, a Japanese quality control statistician, invented the fishbone
diagram. Also referred to as a Cause and Effect Diagram, it is essentially a graphical way to organize and record brainstorming ideas. The value of the fishbone diagram is to assist teams in categorizing the many potential causes of problems or issues in an orderly way and in identifying root causes. To construct a fishbone diagram, the following procedure is used [15]:
1. Draw the fishbone diagram
2. List the problem/issue to be studied in the "head of the fish".
3. Label each ""bone" of the "fish". The major categories typically utilized are:
• Methods, Machines, Materials, Manpower
• Place, Procedure, People, Policies
• Surroundings, Suppliers, Systems and Skills
These categories are to be used as guides, but new categories may certainly be developed as needed. The categories are to help organize ideas.
4. Use an idea-generating technique (e.g., brainstorming) to identify the factors within each category that may be affecting the problem/issue and/or effect being studied. The team should ask... "What are the machine issues affecting/causing..."
5. Repeat this procedure with each factor under the category to produce sub-factors. Continue asking, "Why is this happening?" and put additional segments each factor and subsequently under each sub-factor.
6. Continue until you no longer get useful information as you ask, "Why is that happening?"
7. Analyze the results of the fishbone after team members agree that an adequate
amount of detail has been provided under each major category. Do this by looking for those items that appear in more than one category. These become the "most likely causes".
Figure 2-10: Fishbone Diagram example [15]
From the fishbone diagram, the solutions that have been developed can be evaluated. The solutions contain structure and organization, and the problem can be attacked from multiple fronts.
2.4.3 TRIZ Concept Generation
2.4.3a. Psychological Inertia
Researchers and problem solvers have their favorite directions for investigation, and these generally look like a line vector located within or near their specialties. Most problem solvers, engineers, or product developers ignore the universe of knowledge that exists and rely solely on the knowledge they have to come up with ideas. Psychological inertia is also the tendency to resist change. “We have always done it this way” is a commonly uttered phrase that easily stifles innovation by not allowing things that have not been done to take place. For example, to illustrate the power of psychological inertia, there are pictures of early automobiles upon which paper-mache horse heads were
attached. Yet another way that psychological inertia rears its head is through the way to which things are referred. Names of objects create a mental image of what it can or cannot be. For example, if there was a situation where an object was to be designed to hold a group of papers together, having a design goal that the paper clip be redesigned would most likely limit the concepts generated. A way to describe the problem would be to give the prompt in purely non-technical and simplistic terms, such as a having a design goal of a device that would hold a group of papers together securely.
Psychological inertia is an often-unseen entity that can dramatically affect the success of innovation in a product development environment. TRIZ seeks to suppress the effects of psychological inertia by providing a methodology to lead the designer away from the rut that can be fallen into, and toward the solutions that exist in the knowledge of the universe [22].
2.4.3b. Ideality and the Ideal Final Result
effects, which drives ideality to zero. This would be a system that completes its intended function without existing [22]. What TRIZ suggests is that before generating ideas, one should envision the IFR of the problem situation. By having the stated description of the system at its IFR state, many obstacles to developing innovative solutions can be
avoided, especially psychological inertia. Then, while developing ideas, one should start from the IFR and work backwards, adding what needs to be added until the goal of the system’s existence is met. This way, the maximum ideality for the system at that time can be obtained during the initial design. If concept generation begins at the current state and one works forward, it is very likely that the end point will be much further away from ideality, mainly because much of the system that is unnecessary or that prevents
innovation remains in the system. This concept is illustrated in Figure 2-11.
Figure 2-11: Idea Generation: Conventional vs. TRIZ
2.4.3c. Contradiction Analysis
standard class of problems for which solutions exist. If the right analogy is drawn upon, a useful solution can be obtained [11]. The solution sets are generic, and have been derived from the analysis of millions of patents, thereby encompassing countless fields of knowledge. This way, if a similar problem has existed before in a completely different field, analogous thinking can be used to draw its solution to the problem at hand. Where many problem solvers go directly from the problem to a solution by trial and error, TRIZ based contradiction analysis uses a more efficient method. As shown in Figure 2-12, the problem should be converted to a general problem so that it can be seen how that problem in generic form has been solved before. Then, the general solution can be used to
stimulate ideas for a specific solution.
Figure 2-12: Contradiction Analysis Procedure
There are two types of contradictions that problems can be structured as, technical contradictions and physical contradictions. A technical contradiction exists when known alternatives available to improve one aspect of a design do so at the expense of another aspect of the design (improving “x” will cause “y” to deteriorate). A physical
contradictions is a very important step. Understanding the problem is crucial. By completing the Innovative Situation Questionnaire (ISQ, from section 2.3.2a), some of the answers could already contain contradictions that relate to the problem. When the contradiction is formed, then decide if it is technical or physical, then use the appropriate method to resolve the contradiction. Technical contradictions are solved using the TRIZ Contradiction Table, and physical contradictions are solved using TRIZ Separation Principles.
There are 39 Parameters in TRIZ methodology with which to express the
technical contradiction, such as weight, temperature, accuracy or strength. Representing the contradiction as a combination of two of the 39 Parameters requires a broad
interpretation of the parameters [11]. When the contradiction is specified, the
Contradiction Table should be consulted to find which of the 40 Principles could be used to resolve the contradiction. The 40 Principles are concepts such as Nesting, Inversion, Prior Action, or Feedback that have been proven through the patent literature to have repeating solution concepts for a combination of parameters. There is usually more than one principle that has been used in the past to solve any particular contradiction. Shown in Figure 2-13 is a portion of the Contradiction Table to show how it is used.
![Figure. 2-1: The Rapid Prototyping Wheel (The 4 Major Aspects of RP) [7]](https://thumb-us.123doks.com/thumbv2/123dok_us/1407422.1173351/21.612.167.485.214.534/figure-rapid-prototyping-wheel-major-aspects-rp.webp)

![Figure 2-10: Fishbone Diagram example [15]](https://thumb-us.123doks.com/thumbv2/123dok_us/1407422.1173351/50.612.111.540.68.258/figure-fishbone-diagram-example.webp)