University of Windsor University of Windsor
Scholarship at UWindsor
Scholarship at UWindsor
Electronic Theses and Dissertations Theses, Dissertations, and Major Papers
2014
Mechanical and Material Characterization of Mining Wheels for
Mechanical and Material Characterization of Mining Wheels for
Enhanced Safety
Enhanced Safety
Sante DiCecco
University of Windsor
Follow this and additional works at: https://scholar.uwindsor.ca/etd
Recommended Citation Recommended Citation
DiCecco, Sante, "Mechanical and Material Characterization of Mining Wheels for Enhanced Safety" (2014). Electronic Theses and Dissertations. 5157.
https://scholar.uwindsor.ca/etd/5157
This online database contains the full-text of PhD dissertations and Masters’ theses of University of Windsor students from 1954 forward. These documents are made available for personal study and research purposes only, in accordance with the Canadian Copyright Act and the Creative Commons license—CC BY-NC-ND (Attribution, Non-Commercial, No Derivative Works). Under this license, works must always be attributed to the copyright holder (original author), cannot be used for any commercial purposes, and may not be altered. Any other use would require the permission of the copyright holder. Students may inquire about withdrawing their dissertation and/or thesis from this database. For additional inquiries, please contact the repository administrator via email
Mechanical and Material Characterization of Mining Wheels for Enhanced Safety
By
Sante DiCecco
A Thesis
Submitted to the Faculty of Graduate Studies
through the Department of Engineering Materials
in Partial Fulfillment of the Requirements for
the Degree of Master of Applied Science
at the University of Windsor
Windsor, Ontario, Canada
2013
Mechanical and Material Characterization of Mining Wheels for Enhanced Safety
by
Sante DiCecco
APPROVED BY:
______________________________________________
B. Minaker
Mechanical, Automotive, and Materials Engineering
______________________________________________
R. Bowers
Mechanical, Automotive, and Materials Engineering
______________________________________________
W. Altenhof, Advisor
Mechanical, Automotive, and Materials Engineering
______________________________________________
H. Hu, Co-Advisor
Mechanical, Automotive, and Materials Engineering
iii
AUTHOR’S DECLARATION OF ORIGINALITY
I hereby certify that I am the sole author of this thesis and that no part of this
thesis has been published or submitted for publication.
I certify that, to the best of my knowledge, my thesis does not infringe upon
anyone’s copyright nor violate any proprietary rights and that any ideas, techniques,
quotations, or any other material from the work of other people included in my thesis,
published or otherwise, are fully acknowledged in accordance with the standard
referencing practices. Furthermore, to the extent that I have included copyrighted
material that surpasses the bounds of fair dealing within the meaning of the Canada
Copyright Act, I certify that I have obtained a written permission from the copyright
owner(s) to include such material(s) in my thesis and have included copies of such
copyright clearances to my appendix.
I declare that this is a true copy of my thesis, including any final revisions, as
approved by my thesis committee and the Graduate Studies office, and that this thesis has
iv ABSTRACT
A study was undertaken to evaluate the mechanical and material behaviour of the
Q345 alloy, used in fabrication of five-piece mining wheel assemblies. Material samples
were extracted from all components of a five-piece wheel. Material testing included
compositional analyses, fully submerged corrosion testing, and microstructural analyses.
Mechanical testing included hardness testing, tensile testing and stress-based high-cycle
fatigue testing of specimens with polished and pre-corroded surface conditions. Special
emphasis was placed on obtaining the fatigue behaviour of the alloy in the pre-corroded
condition. Component microstructures were all found to consist of ferrite and colony
pearlite. Ultimate tensile strengths of most component samples ranged from 471 MPa to
544 MPa, which was within minimum alloy specifications. Fatigue results found
polished specimens and pre-corroded specimens to have endurance strengths of
approximately 295 MPa and 222 MPa, respectively, at 5,000,000 cycles. The
v
DEDICATION
In loving memory of
vi
ACKNOWLEDGEMENTS
This study was completed under the supervision and guidance of my advisors, Dr.
William Altenhof and Dr. Henry Hu. I am thankful for their support, encouragement,
and, most notably, patience during the past two and a half years of my studies. From
their efforts, I have been able to learn the skills required to succeed both academically
and within the workplace.
I would like to express my appreciation to committee members Dr. Bruce
Minaker and Dr. Randy Bowers, both of whom have always offered constructive
criticism regarding my work. Additionally, I am thankful to Mr. Richard Banting, who
provided input regarding my studies.
I would like to give acknowledgement to all technical staff within Faculty of
Engineering; with special emphasis given to Andy Jenner, who, without a doubt, played a
critical role in ensuring my completion in a timely manner.
Graciously acknowledged is the financial support of the Natural Sciences and
Engineering Research Council of Canada (NSERC), the Government of Ontario (OGS),
and the Workplace Safety and Insurance Board (WSIB).
Finally, I would like to thank my friends and family for their constant support and
vii
TABLE OF CONTENTS
Author’s Declaration of Originality ... iii
Abstract ... iv
Dedication ... v
Acknowledgements ... vi
List of Tables ... ix
List of Figures ... x
1. Introduction ... 1
1.1. Background ... 1
1.2. Objectives of Study ... 3
1.3. Scope of Study ... 4
1.4. Organization of Study ... 5
2. Literature Review ... 7
2.1. Multi-Piece Mining Wheel Failures ... 7
2.1.1. Multi-Piece Wheel Failure Incident Reports ... 8
2.1.2. Failure Analysis of a Cracked Wheel Rim ... 10
2.2. Fatigue in Metals ... 11
2.2.1. Stages of Fatigue ... 12
2.2.2. Fatigue Design Approaches ... 17
2.2.3. Fatigue Life Factors ... 21
2.3. Statistical Analysis of Fatigue Data ... 26
2.3.1. Testing and Data Sampling ... 27
2.3.2. Curve Fitting ... 29
2.3.3. Confidence Bands ... 32
2.4. Corrosion Testing of Steels ... 34
2.4.1. Corrosion in the Mining Environment ... 36
2.4.2. Accelerated Corrosion Testing Standards ... 42
2.5. Properties of Mining Wheel Fabrication Material ... 46
2.5.1. Tensile Studies ... 47
2.5.2. Fatigue Studies ... 48
2.5.3. Corrosion Studies ... 50
viii
3. Experimental Procedures ... 53
3.1. Specimen Extraction ... 54
3.2. Energy Dispersive Spectroscopy Analysis ... 55
3.3. Accelerated Corrosion Testing ... 56
3.3.1. Mass-Loss ... 56
3.3.2. Surface Roughness ... 59
3.4. Optical Microscopy ... 60
3.5. Cross-Sectional Hardness Measurements ... 62
3.6. Tensile Testing ... 64
3.7. Fatigue Testing and Analysis ... 66
3.7.1. Fatigue Testing Procedures ... 67
3.7.2. Statistical Analysis of Fatigue Data ... 72
3.7.3. Surface Analysis ... 74
3.7.4. Fatigue Testing Matrix ... 75
4. Results and Discussion ... 77
4.1. Energy Dispersive Spectroscopy Analysis ... 78
4.2. Corrosion Behaviour ... 80
4.2.1. Mass-Loss ... 81
4.2.2. Surface Roughness ... 85
4.3. Microstructure ... 88
4.4. Cross-Sectional Hardness ... 97
4.5. Tensile Properties ... 100
4.6. Fatigue Properties ... 106
4.6.1. As-Extracted Fatigue Behaviour ... 107
4.6.2. Pre-Corroded Fatigue Behaviour ... 115
4.6.3. Fracture Surface Analysis ... 122
4.7. Summary of Results ... 128
5. Conclusions and Recommendations ... 131
References ... 137
Appendix A: Summary of Corrosion Conditions in Select Mines ... 142
ix
LIST OF TABLES
Table 2.1 ASTM E739 fatigue test sampling recommendations ... 28
Table 2.2: Chemical composition of Q345 and A572 G50 ... 47
Table 3.1: Estimated cycles to fatigue failure and corresponding loads... 71
Table 3.2: Initial fatigue testing matrix... 76
Table 4.1: EDS analysis of all components of a five-piece mining wheel with corrections made to include a nominal carbon content of 0.2 wt% ... 80
Table 4.2: Summary of surface area mass-loss corrosion data discussed in 4.2.1 ... 85
Table 4.3: Summary of surface roughness measurements of a sample pre-corroded specimen, a sample worn wheel component, and a sample new wheel component ... 88
Table 4.4: Summary of wheel component microstructure pearlite area fractions ... 96
Table 4.5: Summary of average HRB hardness measurements of five-piece wheel components ... 99
Table 4.6: Mean and range YS and UTS values of specimens in the as extracted condition ... 101
Table 4.7: Mean and range YS and UTS values of specimens in the pre-corroded condition ... 104
Table 4.8: Percent difference in YS and UTS of as-extracted and pre-corroded wheel specimens ... 105
Table 4.9: As-extracted fatigue dataset fit coefficients and statistical analysis values of each fit ... 108
Table 4.10: Percent replication of each as-extracted fatigue dataset ... 110
Table 4.11: Endurance strengths and lower limit fatigue equations for as-extracted ‘Rim’ and Gutter datasets ... 113
Table 4.12: Results of statistical analysis of pre-corroded Gutter and Lock Ring fatigue datasets ... 116
Table 4.13: Failure stresses of pre-corroded dataset fits at 50,000 and 5,000,000 cycles ... 118
Table 4.14: Failure stresses of as-extracted and pre-corroded ‘Rim’ fits at 50,000 and 5,000,000 cycles... 120
Table 4.15: Lower confidence band equations of as-extracted and pre-corroded ‘Rim’ datasets ... 122
x
LIST OF FIGURES
Figure 1.1: Cross-sectional view of a five-piece wheel assembly [7] ... 2
Figure 2.1: 2007, Massachusetts, USA wheel failure. Black arrow indicates failure region [4]. ... 9
Figure 2.2: Stages of slip band development during fatigue initiation ... 14
Figure 2.3: Fatigue crack growth direction [17] ... 16
Figure 2.4: Fatigue crack growth as a function of crack propagation stage [17] ... 16
Figure 2.5: Fatigue surface factors for surface conditions as a function of material UTS [22] ... 23
Figure 2.6: Sample S-N plot demonstrating application of confidence bands [34] ... 33
Figure 2.7: Summary of ground water conditions in various Pa, USA anthracite mines [40] ... 37
Figure 2.8: (a) Chloride, (b) oxygen and (c) sulfate levels in the ground water of a South African gold mine [38]... 38
Figure 2.9: Analysis of two groundwater conditions from a South African gold mine [41] ... 39
Figure 2.10: Summary of mine water properties for various Canadian mines [39] ... 41
Figure 2.11: Summary of atmospheric properties for various Canadian mines [39] ... 42
Figure 2.12: Microstructure of Q345 for different heat treatments: (a) base metal zone, (c) recrystallized zone, (e) fusion zone, (f) weld metal zone [53] ... 49
Figure 2.13: High-cycle fatigue life of a 16Mn steel [55] ... 50
Figure 2.14: Mass-loss corrosion behaviour of Q345 and other HSLA steels after wet/dry cyclic corrosion testing [57] ... 51
Figure 3.1: Accelerated corrosion test setup: (a) all corrosion containers, and (b) top view of one corrosion container ... 58
Figure 3.2: Roughness profile with equally spaced roughness readings for calculation of Rz ... 60
Figure 3.3: (a) 100x micrograph of specimen extracted from the flange, (b) binary image of (a) created using ImageJ ... 62
Figure 3.4: (a) Wilson Rockwell Hardness tester and (b) sample Lock Ring hardness specimen ... 64
Figure 3.5: Tensile specimen geometry with gauge length, G, of 51.25 mm, fillet radius, R, of 1.68 mm, and gauge diameter of 6.35 mm ... 65
xi
Figure 3.7: (a) Instron illustration of RR Moore system, (b) RR Moore machine in operation, (c) up close image of image machine with pre-corroded specimen, and (d)
weights used to adjust specimen stress ... 68
Figure 3.8: Fatigue specimen geometry and dimensions ... 69
Figure 3.9: Sample roughness profile of fully ground Rim Base fatigue specimen ... 69
Figure 4.1: (a) EDS Spectrum of BS band at 500x magnification, (b) BSE image of the sample analyzed ... 79
Figure 4.2: Percent mass-loss over time of fatigue specimens submerged in 3.5 wt% NaCl solution ... 82
Figure 4.3: Surface area mass-loss over time of fatigue specimens submerged in 3.5 wt% NaCl solution ... 83
Figure 4.4: Surface roughness profile of pre-corroded fatigue specimen ... 86
Figure 4.5: Surface roughness profile of in-service corroded wheel component ... 86
Figure 4.6: Roughness profile of new painted flange ... 88
Figure 4.7: Micrographs of Rim Base at (a) 100x, (b) 500x, and in binary at (c) 100x, (d) 500x... 89
Figure 4.8: Micrographs of BS Band at (a) 100x, (b) 500x, and in binary at (c) 100x, (d) 500x... 90
Figure 4.9: Micrographs of Flange at (a) 100x, (b) 500x, and in binary at (c) 100x, (d) 500x... 91
Figure 4.10: Micrographs of Gutter at (a) 100x, (b) 500x, and in binary at (c) 100x, (d) 500x... 92
Figure 4.11: Micrographs of Lock Ring at (a) 100x, (b) 500x, and in binary at (c) 100x, (d) 500x ... 93
Figure 4.12: SEM micrographs of Lock Ring (a) 500x, (b) 1000x, (c) 2000x, and (d) 4000x... 95
Figure 4.13: Component HRB hardness as a function of depth ... 99
Figure 4.14: Yield strength and ultimate tensile strength as a function of pearlite content for as-extracted wheel component tensile testing ... 102
Figure 4.15: Engineering stress-strain behaviour of as-extracted specimens from the Lock Ring and the Gutter ... 103
Figure 4.16: As-extracted and pre-corroded stress-strain curves of Lock Ring and Gutter specimens ... 106
Figure 4.17: High-cycle fatigue behaviour of as-extracted specimens from all wheel components ... 107
Figure 4.18: As-extracted fatigue data with upper and lower confidence bands ... 112
xii
Figure 4.20: S-N curves of as-extracted and pre-corroded 'Rim' fatigue datasets ... 119
Figure 4.21: Fracture surfaces of low-load Gutter fatigue specimens (a) as-extracted and (b) pre-corroded ... 124
Figure 4.22: Higher magnification SEM fractographs of low-load Gutter fatigue specimens in the (left) as-extracted and (right) pre-corroded conditions. From top to bottom: (a,b) 100x, (c,d) 500x fatigue initiation zone; (e,f) 100x, (g,h) 500x fatigue failure zone... 126
1
1.
INTRODUCTION
1.1.Background
A mining industry is essential for the economic growth and long term prosperity
of a country. It promotes expansion of a country’s underlying infrastructure, and must
grow accordingly. For a mining industry to maintain growth, modern machinery and
mining techniques are employed to allow for greater expansion of a mine beneath the
earth’s surface. With the increasing depth of mines, heavy mining vehicles are exposed
to more severe conditions, both environmental, e.g., corrosion, elevated temperature, as
well as mechanical loading, e.g., vehicle payload, uneven terrain and side-impact due to
narrow mine pathways conditions. In these conditions, components of the mining
vehicles have the potential to fail prematurely if proper preventative maintenance
procedures are not implemented. Of particular susceptibility to failure are the multi-piece
wheels used for mounting of mining vehicle tires [1].
A typical multi-piece wheel, Figure 1.1, is manufactured using high-strength
low-alloy (HSLA) structural steel. The design consists of a rim base, a mounting disc, a front
flange, a rear flange, a split lock ring, and a bead seat band. Based on the expected
function of the wheel (e.g. loading, tire size), certain components are sometimes
combined into one forged or machined component. These wheels are used in place of
single piece rims when their corresponding tires are too stiff to be mounted, using
2
mining vehicles, which require stiff and durable Off-The-Road (OTR) tires to support
their large payloads and to withstand the harsh terrain conditions of a mine.
While the necessity for multi-piece wheels is clear, their use introduces additional
safety hazards into the workplace [3], [4]. These hazards are caused by the relatively
complex working mechanisms of the wheels, the high pressures used within the tires and
the unfavourable environmental and operational conditions associated with underground
mining. Thus, extra care and due diligence are taken when dealing with multi-piece
wheels by ensuring mining personnel are trained to safely install and handle the wheels,
as well to as perform scheduled preventative maintenance. Unfortunately, even with
current safety measures, several instances of workplace injuries and fatalities associated
with multi-piece wheel failures have been reported [4], [5] [6].
Figure 1.1: Cross-sectional view of a five-piece wheel assembly [7]
Based on available mining wheel failure incident reports, wheel failures can be
3
attributable to mechanical failure of individual wheel components. Human error can be
addressed by better safety and handling training; however, mechanical failure indicates
that current wheel preventative maintenance procedures are inadequate at addressing
wheel failures. The cause for this inadequacy is rooted in the fact that little information
is available to accurately estimate the lifespan of multi-piece mining wheels, which
experience fatigue, wear, corrosion, fretting, and sudden impact and high cyclic loadings,
as noted within incident reports [6], [8], [9] [10] and a mining wheel failure analysis
survey [11].
The research presented in this study is part of an on-going project that investigates
the failure mechanisms of multi-piece wheel assemblies and develops innovative
solutions to improve the safety associated with all facets of multi-piece mining wheels.
Specific to this work, the material properties of the structural steel used in the
manufacturing of a five-piece wheel are evaluated. Attention is placed on obtaining the
fatigue behaviour of the wheel material in the as-extracted and pre-corroded conditions.
Material property variations are to be determined between wheel components, which are
attributable to microstructural and compositional variances. Data from this study will
later be used within the project research group to facilitate prediction of the fatigue life of
the five-piece wheel design under investigation.
1.2.Objectives of Study
The primary objective of the present study is to assess the mechanical and
material properties of the structural steel used in manufacturing of a five-piece mining
wheel. Special emphasis is placed on the fatigue life of the material in the as-extracted
4
1. Evaluate the mechanical and material properties of the structural steel used in the
manufacturing of the components of a five-piece mining wheel to ensure the
mechanical properties coincide with minimum strength standards;
2. Note differences in material properties between wheel components and correlate this
behaviour with microstructural and compositional variations, where possible; and
3. Quantify the high-cycle fatigue behaviour of the wheel material in the as-extracted
and pre-corroded conditions using stress based fatigue testing. Employ appropriate
methods of statistical fatigue life analysis to evaluate data.
1.3.Scope of Study
Experimental testing is to be conducted to obtain the mechanical and material
properties of the structural steel used in construction of the components of a five-piece
mining wheel. Testing examines the behaviour of the material in the as-extracted and
artificially pre-corroded states. Test specimens are to be extracted at random from each
wheel component under investigation to ensure any variations in component
microstructures were accounted for during testing. Artificial corrosion is necessitated
because specimen extraction from used rim components would remove all traces of
corrosion. Obtaining the fatigue behaviour of the steel in the corroded state is of special
interest in this work, based on its reported role in multi-piece wheel failure. Welded
areas of the wheel components are assumed to satisfy all relevant quality control
standards and further investigation of this topic is beyond the scope of this work.
Artificial corrosion consists of fully submerging test specimens in an aerated
5
periodically re-exposed to the solution until a corrosive film has formed on their surfaces.
Surface roughness of the used wheels and artificially corroded specimens is to then be
measured to verify that the level of corrosion sufficiently reflects the corrosion wheel
components experience during service.
Microstructural and compositional analyses are to be performed on specimens
extracted from the new wheels to observe any variations in material behaviour between
wheel components. The results are to be cross-referenced with cross-sectional hardness
testing and uniaxial tensile testing, when necessary, and based on available specimens.
Tensile testing in the corroded state is to be performed to determine the effects of
corrosion on the strength and ductility of the material.
Fatigue behaviour of the wheel material in the two conditions under investigation
is to be determined through stress-based rotating bending fatigue testing. Testing at
various stress amplitudes is to be done at random to reduce environmental bias. A
logarithmic regression analysis is to be performed on each data set to generate confidence
bands and trends from the fatigue data.
1.4.Organization of Study
Chapter 2 presents a detailed review of topics relevant to the failure and analysis
of multi-piece mining wheels. It includes a summary of wheel failure incidents to justify
the work being conducted. Sections are included on the fatigue of metals and related
statistical analysis procedures, in preparation for the fatigue work undertaken in this
study. Discussion on corrosion in the mining workplace and accelerated corrosion testing
is presented. Finally, selected works with the structural steel used in fabrication of
6
Chapter 3 presents the detailed methodologies and testing procedures employed
throughout this study. Included in this chapter are sections on: (a) specimen extraction,
(b) compositional analysis (c) accelerated corrosion, (d,e) cross-sectional hardness and
surface roughness procedures, (f) optical microscopy and (g) tensile testing. In addition
to these basic topics, detailed methodologies regarding fatigue testing are presented.
These include the fatigue testing matrix, the type of fatigue testing selected, with
justification, as well as a discussion of the statistical methods employed for fatigue data
analysis.
Chapter 4 includes all of the results and related discussions from experimental
testing. The primary objective of this chapter is to discuss and analyze the experimental
fatigue behaviour of the structural steel of the five-piece mining wheel under
investigation in the as-extracted and pre-corroded conditions. In addition to fatigue data,
data from other experimental mechanical and material tests are presented and discussed.
Where appropriate, this data is used to explain differences in wheel material fatigue
behaviour.
In Chapter 5, conclusions from the research of this study are presented, as well as
recommendations for future research. Details regarding how the data from this work will
7
2.
LITERATURE REVIEW
The purpose of this literature review is to address key subjects related to this
study. Included in section 2.1 is a summary of a select group of reports dealing with
mining wheel failures. Sections 2.2 and 2.3 deal with fatigue in metals and relevant
means of fatigue data analysis. In section 2.4, corrosion in the mining workplace and a
summary of relevant accelerated corrosion testing procedures is discussed. Section 2.5
summarizes relevant works which have involved the structural steel used in the
manufacturing of five-piece mining wheels.
2.1.Multi-Piece Mining Wheel Failures
Multi-piece mining wheel incident reports are generated whenever mining
personnel experience injuries or fatalities while working with the wheels. Often, these
injuries occur from a lack of care by parties involved [10], [12], however, there are also
many reports where failures have occurred simply due to failure of a wheel component.
Summarized below is a sample of reported wheel failures that were not preventable with
current wheel safety practices. The selection comes from over 40 known multi-piece
wheel incident reports. It is suspected that a great deal more incidents have occurred
worldwide, however, developing nations with prominent mining industries do not always
have strong incident reporting standards. Additionally, results of a metallurgical failure
8
2.1.1. Multi-Piece Wheel Failure Incident Reports
In 1998, in Saskatchewan, Canada, the rear wheel from a Toro 35D underground
haul truck failed during removal of the wheel. The failure occurred as the service
technician was removing the final bolt connecting the wheel assembly to the vehicle axle.
During failure, the outer flange was projected away from the wheel with the full force of
the pressurized tire, resulting in the death of the technician. An investigation into the
incident found that extensive fatigue cracks were present both in the rim and in the outer
bolting flange [8].
Documented in 2000, in Ontario, Canada, a worker was critically injured while
inflating a multi-piece wheel tire. During inflation, the lock ring became disengaged and
was propelled away from the tire into the employee. The worker sustained a broken left
arm, broken right hand, and bruise to the left leg. Cause for the failure was not
reported [5].
A lock ring was propelled from a three-piece wheel during installation onto an
off-the-road vehicle in 2003, in Alaska, USA. The lock ring struck the wheel service
worker, ultimately resulting in their death. An investigation into the incident found that
the lock ring had experienced severe pitting from corrosion, and had become sprung due
to excessive loading. These factors reduced the structural integrity of the ring, preventing
it from safely engaging other wheel components. Recommendations from the incident
included better wheel inspection schemes and better wheel handling safety training [9].
In 2004, in Saskatchewan, Canada, the tire used on a multi-piece wheel exploded
during installation onto a vehicle, resulting in a single fatality. Investigation into the
9
damage over the course of its service life, attributable to both corrosion and fatigue. The
damage to this component meant that the related wheel lock ring could not be properly
seated within the gutter region. This issue prevented full engagement of other wheel
components, and subsequently caused the sudden loss of tire pressure once the tire was
rolled to the mining vehicle for installation [6].
A multi-piece split rim failure occurred while a mechanic was changing the tire of
a container handler vehicle (Figure 2.1) in 2007, in Massachusetts, USA. Upon failure,
wheel components were propelled away from the vehicle, striking, and fatally injuring,
the mechanic. The incident occurred due to a variety of factors, including improper tire
handling procedures and mechanical failure of the gutter region of the wheel due to
material degradation, resulting in fatigue cracks within the gutter. Recommendations
from the incident involved better handling procedures, in addition to more vigorous
wheel component structural integrity examinations [4].
10
Incidents 1 and 2 involved wheel failures where the primary factors were fatigue
and corrosion, respectively. Reports 4 and 5 involved wheel failures where both corrosion
and fatigue facilitated the premature failure of the wheels. These sample reports are
representative of the general trend in wheel failures, when human error is not considered.
Thus, obtaining the corrosion and fatigue behaviour of the structural steel used in
construction of mining wheels was a primary objective of this study. In incident report 3,
no cause for the wheel failure was determined. This report was included in an effort to
also highlight the need for a greater knowledge of multi-piece wheel failure mechanisms,
and the early signs of their failure.
2.1.2. Failure Analysis of a Cracked Wheel Rim
In a report commissioned by North Shore Industrial Wheel Manufacturer,
Bodycote performed a metallurgical failure analysis of a cracked wheel rim [11].
Evaluation incorporated visual and stereomicroscopic examination techniques, scanning
electron microscopy (SEM), energy dispersive X-ray spectroscopy (EDS), metallographic
examination and microhardness testing. Visual and stereomicroscopic examination
revealed cracks located in the gutter region, where the lock ring made contact with the
rim. Scanning electron microscopy analysis of locations near the cracks showed signs of
rubbing and wear damage. Crack analysis revealed relatively brittle fracture features,
including intergranular and cleavage features. Energy dispersive spectroscopy analysis
found most of the crack surface to be covered by oxides; however, levels of chloride were
also detected.
Microhardness testing was conducted on the core of the wheel rim. Three
11
found to be 82. Cross-sectional hardness readings were also taken, at depths from 0.03
mm to 2.00 mm from the surface. Hardness measurements near the surface were
recorded as 97.8-99.4 HRB. Measurements at a depth of 2.00 mm from the surface found
the hardness to be 90.3. Overall, hardness did not vary significantly beyond a depth of
0.4 mm.
Conclusions from the investigation of Bodycote found that the gutter cracks
occurred through either corrosion assisted fatigue or stress corrosion cracking. It is stated
that even if corrosion was the cause, it would not be feasible to remove chloride from the
mining environment. Therefore, the recommendation was made to reduce or eliminate
the relative motion between the lock ring and gutter to mitigate wheel failures.
2.2.Fatigue in Metals
Fatigue in metals is characterized as the progressive, localized, damage of a metal
subjected to cyclic and/or fluctuating loads [13]. Fatigue failure is the result of fatigue
loading conditions that were allowed to persist until failure. These loading conditions are
always below the ultimate tensile strength (UTS) of the metal, and often below the yield
strength (YS). Because fatigue failures always occur below the UTS, special
considerations must be given when designing any structure expected to experience
variable loading conditions. The condition of variable loading is exactly the case of a
mining vehicle wheel, which, by nature, experiences cyclic fluctuating loads during
operation. To correctly address the problem of fatigue associated with the structural steel
of mining wheels - a primary objective of this study - a summary of key aspects of
12 2.2.1. Stages of Fatigue
From a mechanical standpoint, the progression of fatigue within a material can
generally be divided into three stages: (a) fatigue crack initiation, (b) fatigue crack
propagation or growth, and (c) fatigue failure. Similarly, from a materials standpoint,
fatigue progression can be divided into four stages: (a) cyclic plastic deformation, (b)
fatigue crack initiation, (c) propagation of micro-cracks into macro-cracks, and (d)
fatigue failure. The two definitions of fatigue behaviour are roughly equivalent, except
that crack initiation in the former definition is further separated into crack initiation and
cyclic plastic deformation in the latter definition. Regardless of which progression
scheme is followed, the establishment of fatigue stages (notably the crack initiation and
progression stages) has allowed for significant advances in engineering design through a
better understanding of the mechanisms associated with each stage [13].
Fatigue crack initiation can only take place if the material experiences cyclic
plastic deformation. In contrast, most fatigue failures occur at stress levels below the
yield strength of the material. This discrepancy is explained by examination of what
occurs at the microstructural level of the material during application of a cyclic load.
Discussion is first presented for uniaxial loading, and then made for the more general
loading conditions seen within industry.
During uniaxial loading, stresses are not evenly distributed within the material.
Local defects in the microstructure cause stress concentrations that can exceed the
nominal applied stress, resulting in areas of local plasticity. Some common defects
include inclusions, high density dislocation areas, and mismatched grain boundaries. If
13
can occur at these locations. In practice, however, fatigue crack initiation sites are
primarily located at the surface [14] of any component experiencing variable loading
conditions.
Cyclic loading of most structural components often encompasses some degree of
bending in addition to uniaxial loading, generates an uneven macroscopic stress
distribution within the material, with the maximum stress being at the surface of the
material. Even if this stress is below the yield stress of the material (as is often the case),
it still results in a local maximum stress. This stress is augmented through interaction
with the surface defects of the component, which acts as stress risers. Typical defects can
include nicks, dents, pitting, corrosion, wear, or simply surface roughness caused by the
machining process [13]. The net effect can produce stress levels sufficient to cause local
plasticity, eventually resulting in fatigue crack initiation.
From a microscopic viewpoint, localized plasticity within a cyclically loaded
component also preferentially arises at the component surface due to the absence of
adjacent material on the surface, exposed to the testing environment. Since the surface of
the material is exposed to half as many adjacent grain boundaries as the remaining
microstructure, it is less constrained to motion, allowing for deformation to transpire with
more ease, and thus at lower stress levels [15].
Once local deformation takes place on the surface of the material, a slip step is
formed. The slip step implies the creation of a new layer of material. The new layer is
exposed to the testing environment, and for most materials and testing environments, this
14
material, and is not easily removed during reversed slip; thus resulting in some
irreversible changes [15].
Over several cycles of slip step generation, slip bands develop. Dislocation
gliding takes place along these bands in an effort to minimize energy. Slip and
dislocation gliding continues in this way until an obstacle is reached, at which point
dislocation pileup occurs. Eventually, with a high enough dislocation density, the
obstacle may be overcome through dislocation climb, jog, cross-slip or similar
mechanisms [16]. This process repeats itself over the course of many cycles, due to the
continued preference of dislocation motion along the low energy slip bands. The result
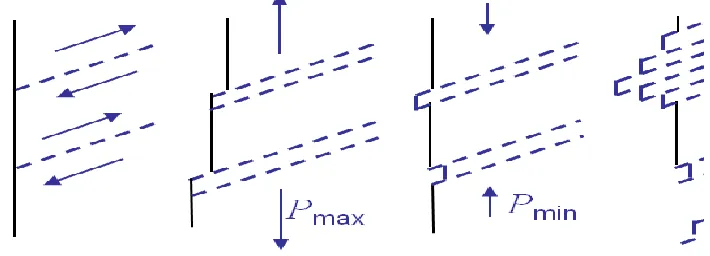
of this activity creates persistent slip bands (PSB), as illustrated in Figure 2.2.
Figure 2.2: Stages of slip band development during fatigue initiation
With continued dislocation motion along the PSBs, dislocation density and
interaction increases, resulting in some work hardening and plastic deformation along the
PSBs. Parallel slip bands in the material can be formed from this activity, as well as a
ladder type slip structure. Over more cycles, PSB dislocations begin to interact with
intersecting grain boundaries and free surfaces. Stress concentrations result and slip into
15
time, eventually overwhelming the surrounding microstructure, and prompting the
initiation of fatigue cracks [16].
Following crack initiation, crack propagation takes place. Fatigue behaviour in
this stage is primarily controlled by fracture mechanics and bulk material properties,
which is contrasted with the initiation stage, in which surface effects dictate fatigue
behaviour. Crack propagation is discussed in three stages: (a) micro-cracks, (b)
macro-cracks, and (c) fracture.
In the first stage of crack propagation, fatigue micro-cracks move along shear
planes, and thus have a tendency to be angled at 45° (Figure 2.3) relative to the surface
(in the case of crack initiation at the surface). During this stage, cracks propagate freely
until microstructural barriers are encountered (e.g. grain boundaries, inclusions,
sufficiently hard material phases). The cracks then lose energy and decelerate if they are
able to overcome the crack barrier, or they become arrested if sufficient energy is
unavailable to overcome the obstacle. Knowledge of this behaviour has allowed material
engineers to prolong the first stage of crack propagation by use of grain refiners within
16 Figure 2.3: Fatigue crack growth
direction [17]
Figure 2.4: Fatigue crack growth as a function of crack propagation stage [17]
In the second stage of crack propagation, prolonged crack growth results in an
increase in the stress intensity at the tip of the crack. As a result, cracks begin to deviate
from the initial slip bands, and generally move perpendicular to the applied stress.
Continued progression of cracks in this stage results in the development of a crack front.
Here, the crack tip can be approximated by a single continuous line, and the crack
propagation rate can be averaged from individual crack rate values. At this stage,
individual micro-cracks may be considered as one continuous macro-crack, governed by
the balance between crack driving forces, and the crack growth resistance of the material
[17]. The time for a macro-crack to develop is highly sensitive to the material being
studied, as would be expected based on the role of the microstructure in crack
propagation. Nevertheless, a common trait of macro-crack propagation is the generation
17
In the final stage of fatigue crack growth, crack growth rates are unstable, as the
material approaches failure, as illustrated in Figure 2.4. In this regime, the process is
comparable to a quasi-static failure, as the crack tip stress intensity is approaching the
fracture toughness of the material. Based on material properties and microstructure,
loading ratio (R=min/max stress), and stress state, the failure is ductile or brittle. The
fracture surface after failure can be characterized by two areas: (a) the region in which
crack initiation and stable propagation transpired, and (b) the region where final crack
propagation occurred, after crack stress levels exceeded the fracture toughness of the
material [17].
Duration of the crack initiation and crack propagation stages is strongly governed
by, among other factors, the amplitude of the applied stress and the strength of the
material. If the stress amplitude is high (above yield), stresses within the material are
sufficient for crack propagation; thus, the fatigue life is primarily controlled by crack
propagation. Conversely, for lower stress amplitudes (below yield), stresses within the
material are low, requiring a greater amount of time to allow for fatigue crack initiation.
These two scenarios are referred to as low-cycle and high-cycle fatigue, respectively.
2.2.2. Fatigue Design Approaches
In fatigue design, knowledge of component loading conditions and desired
lifespan are essential. Once these parameters have been determined, the appropriate
fatigue life prediction scheme can be selected. In the case of infinite life (cycles >106)
component design, the stress-based fatigue prediction scheme can be used. For a
component design of finite fatigue life (cycles <103), the strain-based fatigue prediction
18
The stress-life (S-N), or infinite life, method is the first fatigue prediction scheme
to see widespread usage, with its origins dating as far back as the mid 1800’s in the
prediction of railroad axle failures [13]. The basis of the stress-life method consists of
generating S-N diagrams. S-N diagrams are developed by plotting nominal material
stress amplitudes (S) against the corresponding number of cycles to material failure (N).
The diagram is normally displayed on a log-log plot, with a log-linear line of best fit
representing the mean fatigue behaviour of the material. Two central features typically
arise from S-N diagrams: (a) a power law relationship between stress and fatigue cycles
and (b) a fatigue endurance limit.
The power law relationship is classically observed as a straight line through S-N
test data on a log-log plot. This relationship is critical for the design engineer because it
allows for the mathematical representation of the material’s fatigue behaviour in the
high-cycle regime. With S-N test data and knowledge of its power law behaviour, statistical
analyses may be made to ensure reliability of the high-cycle stress-life data by taking the
lower limit of the mean fatigue behaviour for a desired confidence band.
Certain materials, notably low alloy carbon steels, display what is known as an
endurance limit. This means that below a certain stress level, they no longer display
signs of fatigue degradation, or, stated otherwise, they have an infinite fatigue life. This
behaviour is primarily attributable to a lack of energy for crack initiation to persist into
crack growth, due to insufficient stress levels. The endurance limit is dependent on a
number of factors, including material surface finish, and therefore cannot be considered a
19
however, for design considerations, an endurance limit is sometimes assigned, which is
determined from the fatigue strength at 108 cycles [18].
The stress-life method makes use of continuum theory, i.e., no cracks, and is
generally only applicable to stress amplitudes below the yield strength of a material.
Thus, the stress-life method is a high-cycle fatigue methodology (>104 cycles to failure),
in which the total fatigue life of the material is largely associated with the fatigue crack
initiation phase. Because of this, the only failure criterion the stress-life method can
measure is the cycles to total separation of a material test specimen. Despite these
limitations, the stress-life method is still widely used within industry due to its simplicity
and the abundance of historically available test data.
The strain-life (ɛ-N), or finite-life, method is a fatigue prediction scheme meant to
address the fatigue behaviour of a material for the relatively low cycle regime
(approximately 102 to 106 cycles). Like the S-N approach, the strain-life method assumes
a material continuum, and thus, is incompatible with the presence of cracks.
Furthermore, the strain-life approach uses strain, instead of stress, as the controlling
factor, and can thus be applied to situations involving local plastic deformation. This
feature allows for several advantages over the S-N method.
The strain-life method can be used in the evaluation of low-cycle high stress
fatigue regimes, by accounting for the work hardening a material experiences during
cyclic plastic deformation. Thus, the strain-life approach is well suited for evaluation of
notch effects on the fatigue response of materials.
While the strain-life approach is primarily used in the low-cycle fatigue regime, it
20
marginally higher degree of accuracy relative to the stress-life approach. This is because
even in the high-cycle regime, small amounts of cyclic plastic deformation and work
hardening occur (as is required for fatigue), which alters the material’s response to the
application of stress. The result is that the stress-life method may tend to be more
conservative in fatigue life estimations [13].
Given that strain is the controlling factor in the strain-life method, and that in the
low-cycle fatigue regime the crack-initiation period occupies a lower percentage of the
total fatigue life, various failure criteria can be selected for strain-life evaluation. These
criteria include separation, percentage maximum load drop for a given strain level, or
micro-cracking [13]. Each criterion provides different information on the fatigue
response of the material; however, like the S-N approach, they are only applicable within
the fatigue crack initiation stage, where material continuum remains valid.
Once fatigue crack initiation is superseded by crack propagation, the stress-life
and strain-life approaches can no longer be applied. Instead, linear elastic fracture
mechanics (LEFM) must be used. This approach allows for quantification of the stress
field at the crack tip of a propagating crack. It is a macroscopic approach and makes use
of the bulk properties of the material under investigation. The main goal of this approach
is obtaining a material’s fatigue crack propagation rates, which may then be used in the
design of a damage tolerant component, with a finite fatigue life. For this reason, the
LEFM approach is often paired with the strain-life approach, which allows for a complete
picture of a material’s low-cycle fatigue behaviour [13].
Although the strain-life method can predict low-cycle fatigue behaviour, and
21
endurance limit exists), it is not without its drawbacks. Primarily, strain-life testing is not
as straightforward as the simple load-controlled process of S-N testing. As a result, ɛ-N
testing equipment will tend to be more costly and operate at lower maximum frequencies,
due to the need for additional equipment instrumentation over S-N testing. Thus,
strain-life testing can be cost prohibitive and unnecessary if only the high-cycle fatigue
behaviour of the material is required. For low-cycle fatigue testing, the strain-life method
and related testing equipment must be employed.
2.2.3. Fatigue Life Factors
The fatigue behaviour of a material is a dynamic property that is influenced by
many factors. Therefore, the fatigue behaviour of a material cannot be accurately used
for design without knowledge of the fatigue testing conditions [13]. Likewise, a
structural component cannot be designed without knowledge of its expected working
conditions, and how these and other various factors influence the component’s fatigue
life. To proceed with the investigation on the fatigue behaviour of the structural steel of
a multi-piece mining wheel, understanding of factors that would influence its fatigue
behaviour was necessary. A discussion of the most relevant factors and testing methods
(where appropriate) is presented below.
Loading Type: The type of loading a component experiences relative to laboratory
testing can influence the material’s endurance limit. In the case of a material tested under
pure cyclic bending, the material’s endurance limit in practice may be reduced by 15%
for axial loading or by 41% for pure torsion [19]. Stress ratio and mean applied stress are
22
material dependent. Generally, fully reversed loading (R=-1) is considered to be a more
severe loading condition [20].
Component Geometry: The presence of notches on a fatigue specimen or in a
component design will significantly reduce its high-cycle fatigue life due to the localized
stress concentration [13]. Additionally, component size has been empirically found to
reduce the endurance limit, presumably due to the higher probability of imperfections in a
larger component relative to a test specimen [19].
Temperature: Decreases in temperature relative to the ambient prolong the period
in which fatigue is restricted to the crack initiation stage [13]. For low loading
conditions, this increases the total fatigue life for a given stress amplitude. At
temperatures significantly above the ambient, crack nucleation in slip bands may be
facilitated at the grain boundaries. At high temperatures, the effects of creep on fatigue
life are also to be considered.
Surface Condition: During discussion of fatigue crack initiation, it was found that
the surface is the primary initiation point for material fatigue. Therefore, surface effects
have a large influence on high-cycle fatigue behaviour. Surface roughness always
reduces the fatigue life of a material relative to the polished condition. An extreme
measure of this compares the surface finish of a lathe-formed component to a ground and
polished component. The median fatigue life in cycles of the lathe-formed specimens
decreased by approximately a factor of 10 relative to the ground and polished specimens
[21]. It should, however, be noted that in addition to surface roughness, residual stress
effects were also in play. In general, residual compressive stresses improve fatigue life
23
residual tensile stresses promote crack initiation. The high-cycle fatigue life of a material
can also be improved through microstructural and chemical surface treatments that inhibit
crack nucleation (e.g. surface quenching, protective coatings) [13]. Figure 2.5 illustrates
general decreases in fatigue life for various surface conditions.
Figure 2.5: Fatigue surface factors for surface conditions as a function of material UTS [22]
Environment: Environmental effects play a large role in fatigue initiation.
Generally, a component tested in vacuum exhibits superior high-cycle fatigue behaviour
relative to a component tested in the ambient [13]. This behaviour is attributable to the
presence of oxygen, which facilitates crack initiation, as discussed in section 2.1;
however, the effects of the ambient are normally not considered in fatigue design since
most fatigue testing is performed in ambient conditions, and not in a vacuum. While the
ambient is not considered in fatigue design, the effects of a corrosive environment must
be considered.
The effects of corrosion on fatigue have been investigated extensively for various
24
testing in a corrosive chamber and cyclic stress/strain testing of pre-corroded specimens.
Fatigue testing in an environmental/corrosive chamber is typically done to replicate
highly corrosive service conditions. It promotes the synergistic effects associated with
the two processes, and greatly reduces fatigue life. This is especially true for high-cycle
low frequency testing, where the specimen is exposed to the corrosive environment over
a prolonged period of time.
Pre-corrosion testing is a less severe form of fatigue corrosion testing. Like
corrosion chamber testing, it seeks to replicate service conditions; however, the
mechanisms of fatigue and corrosion do not interact strongly with this testing scheme.
Instead, fatigue specimens are first subjected to corrosion, which may influence surface
topology, and generate some degree of microcracking. Then, the specimens are subjected
to fatigue loading until failure (or run-out). This type of testing is best employed in
conditions where fatigue is a primary failure mechanism, with corrosion playing a small
role in overall failure. It is also well suited for full-scale component fatigue testing,
where the components have been exposed to corrosion during their service life. Finally,
it provides a good first step in corrosion fatigue characterization, since it is relatively
simple to implement in comparison to chamber testing and allows for the separate
evaluation of a material’s corrosion behaviour and resulting fatigue
behaviour [23], [24], [25].
Microstructure: Microstructural effects play a large role in the fatigue crack
initiation and crack propagation resistance of steels. In the work of Kurita et al. [26], the
effect of strengthening mechanisms on ferrite-pearlite steels with similar YS and UTS
25
precipitation, increased dislocation density, grain refinement, and increased pearlite
volume fraction. Results found that the high-cycle fatigue behaviour of the steels was
governed by crack initiation in the ferrite matrix. Therefore, strengthening mechanisms
which improved YS and UTS, but did not strengthen the ferrite matrix (dislocation
density, grain refinement, pearlite volume fraction), were reported to have little effect on
the high-cycle fatigue life. Conversely, solid solution strengthening and precipitation
hardening, which improve the strength of the ferrite matrix, were reported to improve the
high-cycle fatigue life.
Sankaran et al. [27] investigated the low and medium cycle fatigue and tensile
behaviour of medium carbon steels with differing microstructures (air cooling [AC],
quench and temper [QT], and two-step cooling and annealing following forging [TSCA]).
It was found that the QT and TSCA steels demonstrated markedly improved YS and UTS
over the air cooled steel. Further, the low-cycle fatigue behaviour, where plasticity is
significant, for both QT and TSCA steels, was improved over the AC steel. This
behaviour is attributable to the improved bulk material properties of the former two
steels, which is critical in low-cycle fatigue, where crack propagation dominates. In the
medium cycle fatigue testing (<3x10⁵ cycles), all steels demonstrated similar behaviour.
This was attributable to the presence of ferrite in all microstructures.
Investigations similar to those previously discussed are also documented in
references [28] and [29]. In the former, it was found that if a ferrite-pearlite
microstructure was replaced with a primarily bainitic microstructure, the high-cycle
26
fatigue crack propagation resistance of a low carbon steel was improved by a fine
dispersal of bainite along prior austenite grain boundaries, as opposed to pearlite.
2.3.Statistical Analysis of Fatigue Data
In fatigue testing, there is always scatter in the acquired data. This scatter is
generally caused by the cumulative effects of various factors. Some common factors
include the testing environment, specimen geometry, and specimen loading conditions
[30]. Scatter associated with these factors can generally be minimized through regulation
of the testing environment, regular calibration of the testing equipment, and careful
preparation of testing specimens. Other factors associated with fatigue data scatter
include specimen surface finish and microstructure [30]. These factors are much more
difficult to control.
In the case of specimen surface finish, even with a vigorous polishing regime,
surface roughness varies between specimens. Since it would be impractical to measure
the roughness of each specimen, especially for large datasets, some variance in surface
conditions is generally accepted. Likewise, for fatigue scatter associated with material
microstructure, little can be done beyond extracting all specimens from the same
material, with the same heat treatment, at the same extraction depth, and so some scatter
in material microstructure is accepted. In fact, while surface effects are minimized when
practical, often, variances in microstructure will be encouraged, to an extent [31]. This is
especially true in the fatigue testing of structural components. The reasoning behind this
philosophy is that it would be more prudent to have a fatigue data set with more scatter
that encompasses the entire family of microstructures within a component, than to have a
27
approach is limited to microstructures with similar effects on fatigue, and could not be
usefully applied to significantly different microstructures (e.g. pearlite versus martensite
in steel).
Given that scatter in fatigue data is both expected, and sometimes encouraged, it
is critical that appropriate statistical tools be used during evaluation of the data.
Therefore, a brief overview of statistical methods of fatigue data analysis is presented
below. Focus is made primarily on the regression analysis of fatigue data, and generating
appropriate confidence bands. Furthermore, discussion is limited to analysis of fatigue
data associated with specimen failure. Only S-N analysis is discussed, however, general
procedures are equally applicable to ɛ-N datasets. Evaluation of fatigue run-out
(specimens that do not fail) is not addressed and was beyond the scope of this study. All
information presented below originates from references [30], [31], [32], [33] unless
otherwise stated.
2.3.1. Testing and Data Sampling
Grouping and randomization of fatigue test samples are essential features of a
well-planned fatigue test program. Randomization ensures that variability of testing
conditions (e.g. humidity) is spread among all test data, ensuring no bias in datasets is
developed. Grouping ensures that in the event of a testing equipment malfunction, a
small subset of fatigue specimens over a range of conditions are affected, as opposed to
all specimens for one specific testing condition. This is important if one is performing
fatigue testing on various materials of different expected fatigue behaviour, or if a limited
28
The validity of a fatigue analysis is largely dependent on the data sampling size,
relative to the number of loading conditions. ASTM E739 offers guidance for the
minimum number of S-N fatigue data points that should be acquired for statistical
analysis, based on the type of fatigue testing being performed. The recommendations
assume the data are based on random sampling, and that no run-out data points are
included. This is summarized in Table 2.1.
In addition to the minimum number of fatigue test specimens, the ASTM
guideline offers minimum percent replication values. The percent replication is
calculated using Equation (2.1), where l is the number of loading conditions, n is the total
number of test specimens, and R is the percent replication. For example, under the design
allowable condition, a minimum of 12 specimens is required, which would allow for 6
loading conditions if the minimum of 50% replication is desired. For the reliability
criterion, with a minimum of 12 specimens, only 3 loading conditions would be possible
to achieve a minimum percent replication of 75%.
[ ] (2.1)
Table 2.1 ASTM E739 fatigue test sampling recommendations
Type of Test Minimum Number of
Specimens
Minimum Percent Replication
Preliminary & Exploratory 6 to 12 17 to 33
Research and Development 6 to 12 33 to 50
Design Allowable 12 to 24 50 to 75
29 2.3.2. Curve Fitting
In S-N fatigue curve fitting, a linear fit of the form of Equation (2.2) is typically
applied. In Equation (2.2), X is the independent variable, Y is the dependent variable, m
is the slope of the linear fit, and A is the intercept. During analysis, the stress is taken as
the independent variable, and the cycles to failure is taken as the dependent variable.
This is in contrast to a typical S-N plot, which presents the stress as the dependent
variable.
(2.2)
Equation (2.2) cannot be directly applied to raw S-N data. First, the data must be
linearized. Fatigue data typically demonstrates a logarithmic relationship over certain
stress ranges. Therefore, to utilize Equation (2.2), the cycles to failure, N, are commonly
transformed using a logarithmic function. When this approach is utilized, the S-N data is
said to be log-linear. If the stress values, S, are also transformed logarithmically, the S-N
data is said to have a log-log relationship. The type of transformation applied to a fatigue
dataset for linearization should be performed based on a visual evaluation of the plotted
data. This also helps in determining the range in which the fit is applicable.
Once the fatigue data has been linearized, a curve fitting technique capable of
generating a best-fit straight line should be selected. Linear regression analysis using the
least-squares method is a good example of an approach that works well for this purpose.
Equation (2.3) and Equation (2.4) may be used for calculating the sample population
values of the intercept (Â) and the slope (̂), respectively. In these equations,
30
fatigue testing, this corresponds to the applied stress levels, and the cycles to failure.
These equations are recommended by ASTM E739 and are based on the method of
least-squares.
̂ (2.3)
̂ ∑
∑ (2.4)
Upon completion of the least-squares regression analysis, care should be taken to
ensure that the calculated fit is statistically relevant. Simple methods of evaluating the
legitimacy and accuracy of a fit include performing an F-test and calculating the R2
value. Additionally, a t-test of the fit’s slope and intercept can be performed. Before
each of statistical tests is described, several key definitions relevant to their
understanding are presented.
The regression sum of squares (SSR) (Equation (2.5)) is the sum of the squares of
the deviations of predicted values relative to the mean of the test data. It represents the
explainable variance associated with a fit. The residual sum of squares (SSE) (Equation
(2.6)) is the sum of squares of the deviations of predicted values from test values. It
represents the unexplainable variance associated with a fit, and is also commonly known
as error sum of squares. The total sum of squares (SST) is the sum of SSR and SSE and
represents the total variance associated with a fit. The standard error of the dataset is
denoted as SYX, and is used in the calculation of the standard error (deviation) of the
slope and intercept. Equation (2.7) shows the SYX in terms of the SSE and the degrees of
31
∑ ̂
(2.5)
∑ ̂
(2.6)
√
(2.7)
The F-test is a measure of a regression fit’s significance. In the test, a null
hypothesis is presented which states that all regression coefficients are insignificant (i.e.
== 0). The alternate hypothesis states that at least one coefficient is significant (i.e. =/=
0). Evaluation is performed by calculating the observed F value. Equation (2.8) is the
F-value formula for simple linear regression. The observed F F-value must exceed the critical
F value for the alternate hypothesis to be valid. Critical F values are widely available for
a range of degrees of freedom and confidence levels. A 95% confidence interval is
commonly used in S-N fatigue data analysis.
The R2 value (Equation (2.9)), or the coefficient of determination, is a measure of
how well the regression analysis fits the dataset. It can be thought of as the ratio of the
explained variation of the fit, and the total variation of the fit. Mathematically, it is
described as ratio of the SSR and SST (SSR + SSE). Therefore, as the SSE is minimized
(dependent on testing conditions), the R2 value approaches unity, indicating a perfect fit
between the curve and test data.
The T-test is similar in nature to the F-test; however, instead of assessing the
![Figure 1.1: Cross-sectional view of a five-piece wheel assembly [7]](https://thumb-us.123doks.com/thumbv2/123dok_us/1407626.1173375/15.612.146.491.394.609/figure-cross-sectional-view-piece-wheel-assembly.webp)
![Figure 2.1: 2007, Massachusetts, USA wheel failure. Black arrow indicates failure region [4]](https://thumb-us.123doks.com/thumbv2/123dok_us/1407626.1173375/22.612.186.464.441.649/figure-massachusetts-wheel-failure-black-indicates-failure-region.webp)
![Figure 2.3: Fatigue crack growth direction [17]](https://thumb-us.123doks.com/thumbv2/123dok_us/1407626.1173375/29.612.110.543.85.280/figure-fatigue-crack-growth-direction.webp)
![Figure 2.5: Fatigue surface factors for surface conditions as a function of material UTS [22]](https://thumb-us.123doks.com/thumbv2/123dok_us/1407626.1173375/36.612.202.447.188.377/figure-fatigue-surface-factors-surface-conditions-function-material.webp)
![Figure 2.6: Sample S-N plot demonstrating application of confidence bands [34]](https://thumb-us.123doks.com/thumbv2/123dok_us/1407626.1173375/46.612.143.505.137.369/figure-sample-s-plot-demonstrating-application-confidence-bands.webp)
![Figure 2.7: Summary of ground water conditions in various Pa, USA anthracite mines [40]](https://thumb-us.123doks.com/thumbv2/123dok_us/1407626.1173375/50.612.124.532.333.554/figure-summary-ground-water-conditions-various-anthracite-mines.webp)
![Figure 2.8: (a) Chloride, (b) oxygen and (c) sulfate levels in the ground water of a South African gold mine [38]](https://thumb-us.123doks.com/thumbv2/123dok_us/1407626.1173375/51.612.114.538.219.448/figure-chloride-oxygen-sulfate-levels-ground-south-african.webp)
![Figure 2.11: Summary of atmospheric properties for various Canadian mines [39]](https://thumb-us.123doks.com/thumbv2/123dok_us/1407626.1173375/55.612.116.534.72.315/figure-summary-atmospheric-properties-various-canadian-mines.webp)
![Figure 2.12: Microstructure of Q345 for different heat treatments: (a) base metal zone, (c) recrystallized zone, (e) fusion zone, (f) weld metal zone [53]](https://thumb-us.123doks.com/thumbv2/123dok_us/1407626.1173375/62.612.126.523.187.479/figure-microstructure-different-treatments-metal-recrystallized-fusion-metal.webp)