Forecasting the Heart Disease using Filter
with Shift Add Tree
Anjana R
PG Scholar, Dept. of ECE, TKM Institute of Technology, Kollam, Kerala, India
ABSTRACT: Heart diseases are an important factor in increasing death rate. One of the main reason for such a situation is ventricular arrhythmia. Ventricular arrhythmia is an abnormal ECG rhythm and is responsible for sudden deaths in persons with heart problems unless treated within seconds. Ventricular arrhythmias if not neither accurately diagnosed nor treated, immediate death occurs. The implantable cardioverter- defibrillator, long-term ECG monitoring and machine learning techniques are the existing methods to detect ventricular arrhythmia but they have shortcomings like too difficult to implement or compute, low specificity in discriminating between normal and abnormal conditions and these cannot predict the ventricular arrhythmia. A fully integrated electrocardiogram (ECG) signal processor (ESP) is the only solution that performs prediction instead of detection of ventricular arrhythmia. ECG signal processing, feature extraction and classification will predict the occurrence of arrhythmia.
KEYWORDS: Ventricular arrhythmia; Electrocardiography; Pan and Tompkins algorithm; Feature extraction
I . INTRODUCTION
The electrical activity of the heart is presented by the Electrocardiogram (ECG) signal. Due to the ease of use and non-invasiveness, ECG is not only used as a prime tool to monitor the functionality of the heart but also to diagnose the cardiac arrhythmia by extracting information about intervals, amplitudes, and wave morphologies of the different P, QRS, and T waves. The extracted features from the ECG signal play an essential role in diagnosing many cardiac diseases. Sudden cardiac death accounts for approximately 300000 deaths in the United States per year and in most cases, is the final result of ventricular arrhythmias, including ventricular tachycardia (VT) or ventricular fibrillation (VF) . Ventricular arrhythmia is an abnormal ECG rhythm and is responsible for 75%–85% of sudden deaths in persons with heart problems unless treated within seconds. Most ventricular arrhythmias are caused by coronary heart disease, hypertension, or cardiomyopathy, and VT is a fast rhythm of more than three consecutive beats originating from the ventricles at a rate more than 100 beats/min . VF is another rhythm characterized by the chaotic activation of ventricles, and it causes immediate cessation of blood circulation and degenerates further into a pulseless or flat ECG signal indicating no cardiac electrical activity.
II. RELATED WORK
Various studies have been done for classification of various cardiac arrhythmias. Due to advancement in technology, the development of hardware for accurate ECG analysis and classification in real time has become possible. Many attempts succeeded to implement ECG signal processing and classification systems in hardware. Shiu et al. [10] implemented an integrated electrocardiogram signal processor (ESP) for the identification of heart diseases using the 90-nm CMOS technology. The system employed an instrumentation amplifier and a low-pass filter (LPF) to remove the baseline wander and the power line interference form the ECG and employed a time-domain morphological analysis for the feature extraction and classification based on the evaluation of the ST segment. The system was carried out in a field-programmable gate array and consumed a total of 40.3-μW power and achieved an accuracy of 96.6%. The main disadvantage of the system is that it uses fixed search window with predefined size to locate S and T fiducial points, which is not suitable for real-time scenarios.
Another ESP was fabricated on the 0.18-μm CMOS technology and executed different functions for the three stages of pre-processing, feature extraction, and classification. The algorithm behind these functions was based on the quad level vector [12]. Moreover, the functions were all pipelined to increase hard- ware utilization and reduce power consumption. Besides, the system employed clock gating techniques to enable and disable each processing unit individually according to the need and it applied voltage scaling up to 0.7 V. The ECG processor consumed 6 μW at 1.8 V and 1.26 μW at 0.7 V, which is much better than the previous system due to the low-power techniques it employed.
On the other hand, the implanted systems have been suggested as an alternate solution to the body wearable devices and attracted much interest in the field. The main benefit of such approach is that the impact of a person’s motion and his daily activities is dramatically reduced. Chen et al. [14] proposed a syringe-implantable ECG system for arrhythmia classification based on the state-of-the-art 65-nm CMOS process. The system acquires the ECG signal, filters it, amplifies it, and digitizes it through the analog front-end (AFE) module. The AFE contains a low-noise instrumentation amplifier, a variable gain amplifier, and a successive approximation register analog-to-digital converter. The arrhythmia detection is performed using two approaches. The first approach evaluates the variance of the RR interval and applies a simple threshold technique to distinguish between normal and abnormal intervals. In the second approach, the ECG signal is transformed into the frequency domain, and the variation in the spectrum is analysed.
III. METHODOLOGY
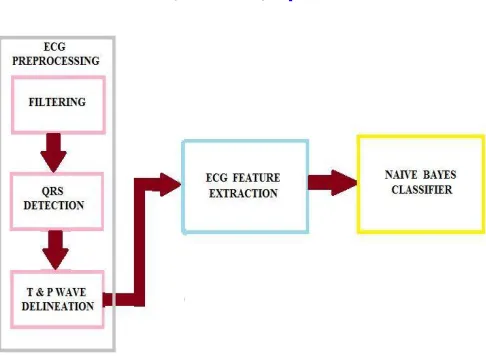
This paper proposes a fully integrated low-powered ESP for the prediction of ventricular arrhythmia before the onset. The detection is not enough to save lives as the patient is left with a very few seconds to die. On the other hand, an early prediction of VT/VF would improve the quality of life by alerting the patient before any critical condition. This is achieved by analyzing the ECG segment that precedes the onset of VT/VF condition Unlike other systems that acquire the ECG signal and transmit it for further analysis, the system aims to design and develop an integrated biomedical processor that is capable of acquiring the ECG signal from the heart along with processing and analyzing it on the same chip without any external interaction. Thus, the patient would have immediate alert to his situation and that is very important, especially in critical situations. The prediction system consists of three main stages, which are the ECG pre-processing, feature extraction, and classification, as shown in Fig.1.
Fig 1. Block diagram of prediction system
In the second stage, seven features are extracted from the ECG signal and grouped together to construct a unique set. . The feature extracted includes RR, TP and PR intervals and width of wave T, wave P and QRS. Multiple features were necessary to enhance the robustness of the system, and thus, we constructed this unique set of ECG intervals and used it as input for the final stage.
In the final stage, naive Bayes algorithm is used to identify the signals that are susceptible to ventricular arrhythmia. There are many reasons for choosing the naive Bayes. First, the ECG features have shown strong potential in the prediction of ventricular arrhythmia with a p-value < 0.001. Second, it was intended to investigate the performance of the system without introducing the strong biasing effect of a classifier. Finally, naive Bayes is the simplest classification method that can be easily implemented in hardware.
A. ECG PREPROCESSING Filtering
Bandpass filtering of the raw ECG signal is the first step in which the filter isolates the predominant QRS energy centered at 10 Hz, and attenuates the low frequencies characteristic of the P and T waves, baseline drift, and higher frequencies associated with electromyography noise and power line interference. The main important point is not to lose the information carried by the ECG signal after being filtered out. The low pass and high pass filter can be constructed using shift- add filter by providing corresponding coefficients. Filter consists of delay unit, partial product generation (PPG) unit and shift-add tree. D flip flop is used to provide delay. The cut-off frequency of the LPF filter is 11 Hz, and it introduces a delay of six samples, whereas the HPF has a cut-off frequency and delay of 5 Hz and 16 samples, respectively. The coefficients of the filters are all integers and of power-of-two, which make them suitable for hardware implementation. Figure 2 shows the architecture of shift-add tree.
The input provided is 8 bit and the PPG unit is of 2bit.The 2 bit PPG value determines the output corresponding to input. Consider a value P which is one left shift of 8 bit input value. If the PPG value is 0 the output is also 0, if it is 1 out is the combination two MSB bits of input and input itself, if 2 bit PPG value correspond to 2 then out is value P and if PPG value is 3 out will be the sum of P and input. These values are provided to shift-add tree. All the L/2 partial products generated by each of the PPGs are thus added by (L/2) binary adder trees. The outputs of the L/2 adder trees are then added by a shift-add tree according to their place values. Each of the binary adder trees require log2N stages of adders to add N partial product, and the shift–add tree requires log2L − 1 stages of adders to add L/2
output of L/2 binary adder trees. The filtered output is provided to differentiator unit.
QRS Detection
other ECG wave peaks. After filtering, the PAT algorithm is decomposed into four steps. Differentiation of the filtered signal is used to distinguish the QRS complex from other ECG waves by finding high slopes.
Fig 2. Architecture of shift-add filter
Then, a nonlinear transformation is performed by squaring of the filtered ECG signal in which it is important to emphasize the higher frequencies in the signal obtained from the previous step, which are normally characteristic of QRS complex. After that, integration is carried out by a moving time window to extract additional features. Finally, adaptive amplitude thresholds are applied to the averaged signal to detect R peaks.
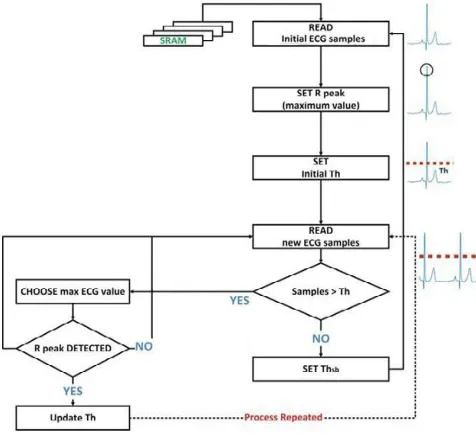
For real-time hardware implementation the peak detection technique is as shown in Fig. 3. Initially, the design reads the first 200 ECG samples from the SRAM, which stores the samples of the averaged ECG signal. The maximum value among these samples is set as an initial R peak and used to compute the initial value of the threshold, Th, which is set to 50% of the peak value. Then, the value of every incoming sample is compared with Th, and only the sample value, which is greater than the threshold, is used in the next step. If none of the samples have a higher value than Th, the algorithm redefined the value of the threshold and set it to 50% of the peak value (Thsb). As soon as the demarcation of the samples that exist in the QRS complex region is done, the maximum value among them is set as a new R peak, and the threshold is updated accordingly (50% of the last detected R peak). The process repeats itself, and the threshold is adjusted according to the last detected R peak. The last step in the QRS complex detection is to find the corresponding R peaks in filtered signal, which is done by subtracting the delay encountered due to the filters.
T and P Wave Delineation
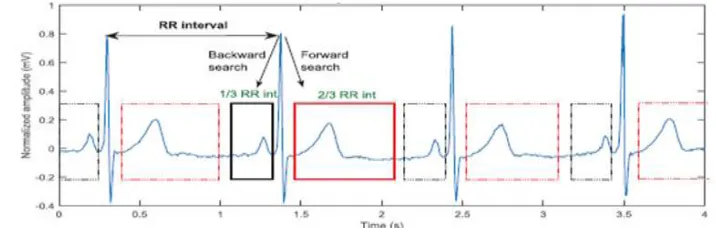
The method is based on adaptive search windows along with adaptive thresholds to accurately distinguish T and P peaks from noise peak. In each heartbeat, the QRS complex is used as a reference for the detection of T and P waves in which two regions are demarcated with respect to R peaks. These regions are then used to form the forward and backward search windows of the for the detection of T and P waves in which two regions are demarcated with respect to R peaks. These regions are then used to form the forward and backward search windows of the T and P waves, respectively, as shown in fig 4. A forward search window is assumed to contain the T wave, and the boundaries are extended from the QRS offset to two third of the previously detected RR interval.
Similarly, a backward search window for the P wave is identified and extended from the QRS onset backwardly to one third of the previous RR interval. The position of T and P peaks is demarcated in their respective search windows by finding the local maximum or/and local minimum that are above the associated thresholds.
.
Fig 3: Adaptive search windows
B. FEATURE EXTRACTION STAGE
D. CLASSIFICATION STAGE
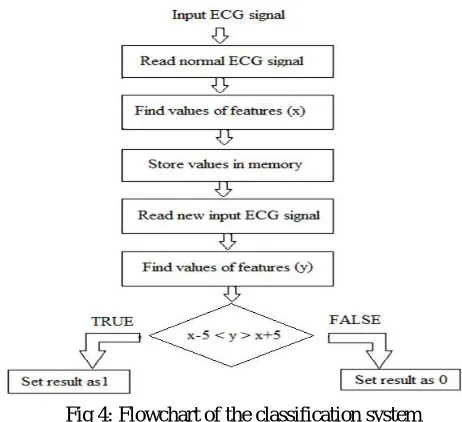
The classifier compares the values of features extracted from normal ECG signal and the input provided. The flowchart of classifier system is shown in figure 4.
Fig 4: Flowchart of the classification system
The values of the feature extracted of normal ECG signal is found out let it be x. Then read the new input ECG values let it be y. If the new value have a difference of 5 from the normal value then the output corresponding to that feature is set to 1 representing the presence of the disorder otherwise output is 0 representing absence of arrhythmia.
IV. SIMULATION RESULTS
Verilog simulations were done using Xilinx ISE 14.2 and MATLAB r2013a is used to extract filter co-efficient and to get hex values of input ECG signal. The database is taken from MIT Physionet. The figure 5 and 6 shows the final output.
The input given is ECG_in and analysis_out is the output shown as in figure 5. First case a normal ECG is provided as input signal. So there will be no chance of occurrence of arrhythmia and the output is 0 representing there is no chance of occurrence of arrhythmia.
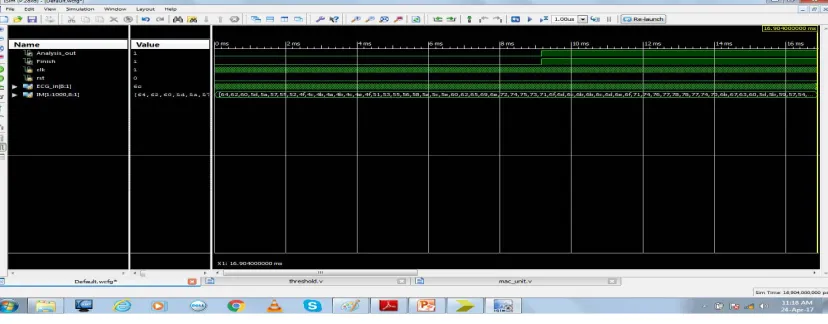
Fig 6: Prediction of arrhythmia
Figure 6 shows the Verilog output predicting arrhythmia. The input given is ECG_in and analysis_out is the output. In this case an arrhythmic ECG is provided as input signal. The output is 1 represents there is a chance of occurrence of arrhythmia.
V. CONCLUSION AND FUTURE WORK
Now a day’s heart disease is common in human and even in children. Among them arrhythmia is more risky and deadly. So it is necessary to detect arrhythmia and take proper steps to provide treatment to patients suffering from arrhythmia. By observing ECG wave arrhythmia can be detected. The simulation results showed that the prediction system provide better result. The system takes normal ECG and an arrhythmic ECG wave and provided accurate output before arrhythmia occur. Thus patient will get sufficient time to get treated. The improvement can be made by integrating multiple biomedical signals with ECG like blood sugar, pressure, electromyography etc. and employing some power reduction techniques like clock and frequency scaling.
REFERENCES
1. Nourhan Bayasi, Hani Saleh, Baker Mohammad et.al, “Low-Power ECG-Based Processor for Predicting Ventricular Arrhythmia,” IEEE Transactions On Very Large Scale Integration (VLSI) Systems, August 2015.
2. Pramod Kumar Meher and Sang Yoon Park,” Area-Delay-Power Efficient Fixed-Point LMS Adaptive Filter With Low Adaptation-Delay”, IEEE Transactions On Very Large Scale Integration (VLSI) Systems, Vol. 22, No. 2, February 2014.
3. S.Y. Hsu, Y. Ho, Y. Tseng et.al, “A sub-100 W multi-functional cardiac signal processor for mobile healthcare applications,” Proc. Symp. VLSI Circuits, June 2012.
4. Abdul Qayoom, Bhat Vineet Kumar and Sunil Kumar,” Design of ECG Data Acquisition System,” IJARCSSE ,Volume 3, Issue 4, April 2013. 5. Bo-Yu Shiu, Shuo-Wei Wang, Yuan-Sun Chu and Tsung-Heng Tsai,” Low-Power Low-Noise ECG Acquisition System with DSP for Heart Disease Identification”, IEEE Transactions on biomedical engineering, vol. 51, no. 7, July 2013.
6. Ahsan H. Khandoker, Mohammad Hasan Imam, Jean-Philippe Couderc et.al,” QT Variability Index Changes With Severity of Cardiovascular Autonomic Neuropathy”, IEEE Transactions On Information Technology In Biomedicine, Vol. 16, No. 5, September 2012.
7. S.Karpagachelvi, Dr.M.Arthanari and M.Sivakumar,” ECG Feature Extraction Techniques,” IJCSIS Vol. 8, No. 1, April 2010.
9. Omid Sayadi,Mohammad B. Shamsollahi, and Gari D. Clifford, “Robust Detection of Premature Ventricular Contractions Using a Wave-Based Bayesian Framework”, IEEE Transactions on biomedical engineering, Vol. 57, no. 2, February 2010
10. J Pardey,” Detection of Ventricular Fibrillation by Sequential Hypothesis Testing of Binary Sequences”, Computers in Cardiology volume 34,
February 2007, pg:573−576.
11. Philip de Chazal, Maria O’Dwyer and Richard B. Reilly,” Automatic Classification of Heartbeats Using ECG Morphology and Heartbeat Interval Features”, IEEE Transactions on biomedical engineering, vol. 51, no. 7, July 2004.
BIOGRAPHY