ISSN(Online): 2320-9801 ISSN (Print) : 2320-9798
I
nternational
J
ournal of
I
nnovative
R
esearch in
C
omputer
and
C
ommunication
E
ngineering
(An ISO 3297: 2007 Certified Organization)
Vol. 4, Issue 10, October 2016
A Study on Tools of Big Data Analytics
K.Yogeswara Rao 1, S.Adinarayana 2
Assistant Professor, Dept. of CSE, Gitam University, Andhra Pradesh, India1
Associate Professor, Dept. of IT, Sri Vishnu Engineering College for Women, Bhimavaram, Andhra Pradesh, India2
ABSTRACT: In today’s competitive world of internet era, users of different applications including social networking
sites , mobile apps, blogs, movie reviews, e –commerce websites and travel websites generates huge volume of data( called as big data) which is mostly unstructured in nature. Handling and processing such a huge volume of data is not an easy task with existing traditional tools. With shorter product life-cycles, evolving client behavior associated an economy that travels at the speed of sunshine and knowledge has gone on to be a lot of concerning analytics and business connexion. Therefore, there is a need and demand for high end tools to handle Big data to process in to useful information for business intelligence. In this paper we have discussed and explored the tools that are a unit the most effective within the market to harness, analyze and build the foremost sense out of Big Data.
KEYWORDS: Large data, Hadoop, Thor cluster, Node, Grid grain, Pentaho, MongoDB
I.INTRODUCTION
In earlier days, web is employed for less than the aim of causation e-mails messages, browsing queries so it can be handled effectively with native RDBMS tools. However in this internet era web generates large amount of knowledge every second and it will increases day by day hour by hour.
Thus such form of information is troublesome to method as a result of it contains the billons records of million individuals. info that features the net sale, social networks, on-line transactions, e-mails, audios, videos, images, device information, science analysis, health records, search queries, click streams, posts, cloud computing, mobile phones and their applications. It cannot be deals with ancient information like RDBMS, DBMS, and ORDBMS.
In the last twenty years, the information is increasing day by day across the planet. There are quite a pair of billion web users within the world these days and 4.61 billion mobile phones in 2016[1]. Curiously, twitter tweets statistics as of today (now) are 544,748. Some facts regarding the data are, there are quite 350,000 tweets each minute[2], quite a pair of million searching’s on Google each minute, quite seventy hours of videos are uploaded to YouTube, There are quite one hundred million emails are sent, quite four hundred GB of data is process in face book and quite 570 websites are created each minute on web. Face book has quite one billion folks active accounts from that 751 million mistreatment face book from a mobile. Throughout 2012, 2.5 large integer bytes of data were created each day. Huge knowledge and its analysis are the middle of recent science and business areas. Large amount of information is generated from the numerous sources either in structured or unstructured kind. Such style of data keep in databases then it became tough to extract, transform and load. So this leads to the development of tools for extracting knowledge from big data.
A. DEFINING BIG DATA
According to Forbes , “Big data is a collection of data from traditional and digital sources inside and outside your company that represents a source of ongoing discovery and analysis” [9].
B. WHAT COMES AT A LOWER PLACE LARGE DATA
Big data involves the data created by utterly totally different devices and applications. Given below square measure variety of the fields that come at a lower place the umbrella of Big data.
ISSN(Online): 2320-9801 ISSN (Print) : 2320-9798
I
nternational
J
ournal of
I
nnovative
R
esearch in
C
omputer
and
C
ommunication
E
ngineering
(An ISO 3297: 2007 Certified Organization)
Vol. 4, Issue 10, October 2016
data to handle i.e Search engines data from utterly totally different databases which includes different click streams which is an interesting research area known as click stream mining.
C. BIG DATA CHARACTERIZATION
The need of big data generated from the big corporations like YouTube, Face book, Google, yahoo, etc for the aim of study of huge quantity of data that is in structured kind or maybe in unstructured kind. Google contains the big quantity of information. So there is the necessity of Big Data Analytics . The big data generated from different sources is completely different from structured data in terms of variety, volume and velocity . As per the characterization is concern, across a wide range of real-world big data applications and various software stacks demonstrate how the choice of big vs little core-based servers for energy-efficiency is significantly influenced by the size of data, performance constraints, and presence of accelerator.
D. BIG DATA INFRASTRUCTURE
For a medium size or even big company that is not necessary making a living from renting space and processing power to clients, the construction of a Big Data infrastructure is often as expensive as inefficient. So Big Data is not the answer for every type o company, is very expensive and hard do make on your own, and you need a specialized human resources. In the current labor market the Big Data specialists are very few and also the means to train programmers, architects and business analysts are few and very expensive. The architecture of a Big Data solution is rather different from other data storage solution like Data Warehouse.
II. TOOLS FOR BIG DATA
We have a wide range of tools for handling big data. Some of the tools we are discussing here are apache Hadoop, HPCC, STORM, Cognos, MongoDB, and Pentaho.
A. HADOOP
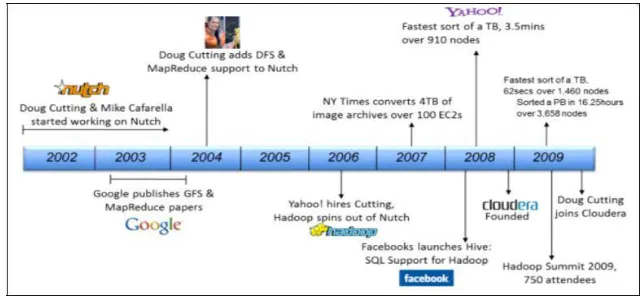
Hadoop was started by Doug Cutting to support two of his other well known projects, Lucene and Nutch. Hadoop has been inspired by Google’s File System (GFS) which was detailed in a paper by released by Google in 2003 Hadoop, originally called Nutch Distributed File System (NDFS) split from Nutch in 2006 to become a sub-project of Lucene. At this point it was renamed to Hadoop
Figure 1: History of Hadoop
ISSN(Online): 2320-9801 ISSN (Print) : 2320-9798
I
nternational
J
ournal of
I
nnovative
R
esearch in
C
omputer
and
C
ommunication
E
ngineering
(An ISO 3297: 2007 Certified Organization)
Vol. 4, Issue 10, October 2016
Hadoop is apache open source software which runs on a cluster of commodity machines. Hadoop provides both distributed storage and distributed processing of very large data sets. Hadoop is capable of processing big dataof sizes ranging from Gigabytes to Peta bytes.
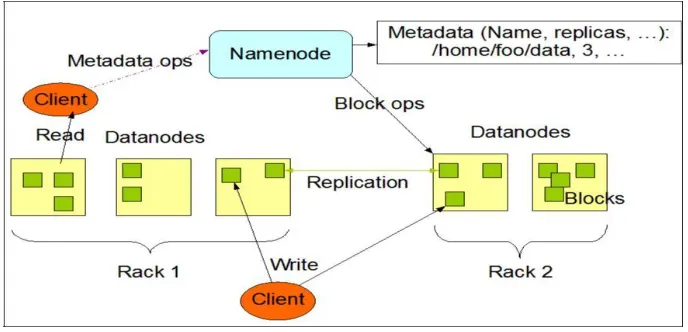
Hadoop architecture is similar to master/slave architecture which is shown in figure 1.
Figure 1: HDFS architecture
Hadoop is a master/ slave architecture. The master being the name node and slaves are data nodes. The Name node controls the access to the data by clients. The data nodes manage the storage of data on the nodes that are running on. Hadoop splits the file into one or more blocks and these blocks are stored in the data nodes. Each data block is replicated to 3 different data nodes to provide high availability of the Hadoop system. The block replication factor is configurable.
i. The five daemons of Hadoop
The five daemons of Hadoop system are [12]
a) Hadoop Distributed File System(HDFS) is designed to run on commodity machines which are of low cost hardware. The distributed data is stored in the HDFS file system. HDFS is highly fault tolerant and provides high throughput access to the applications that require big data.
b) Name node is the heart of the Hadoop system, manages the file system namespace. It stores the metadata information of the data blocks. This metadata is stored permanently on to local disk in the form of namespace image and edit log file.
c) Secondary Name node is responsible to periodically copy and merge the namespace image and edit log. In case if the name node crashes, then the namespace image stored in secondary name node can be used to restart the name node. d) Data Node stores the blocks of data and retrieves them. The data node also reports the blocks information to the name node periodically.
e) Job Tracker responsibility is to schedule the clients jobs. Job tracker creates map and reduce tasks and schedules them to run on the data nodes (task trackers). Job Tracker also checks for any failed tasks and reschedules the failed tasks on another Hadoop Job tracker can be run on the Hadoop or a separate node.
f) Task Tracker runs on the data nodes and is responsible to run the map or reduce tasks assigned by the job tracker and to report the status of the tasks to the name node.
ISSN(Online): 2320-9801 ISSN (Print) : 2320-9798
I
nternational
J
ournal of
I
nnovative
R
esearch in
C
omputer
and
C
ommunication
E
ngineering
(An ISO 3297: 2007 Certified Organization)
Vol. 4, Issue 10, October 2016
ii.Map Reduce in Hadoop
Traditional Enterprise Systems normally have a centralized server to store and process data. Traditional model is certainly not suitable to process huge volumes of scalable data and cannot be accommodated by standard database servers. Moreover, the centralized system creates too much of a bottleneck while processing multiple files simultaneously.
Google solved this bottleneck issue using an algorithm called MapReduce. MapReduce divides a task into small parts and assigns them to many computers. Later, the results are collected at one place and integrated to form the result data set shown in figure 2.
Figure 2: Centralised access to HDFS System
The Map Reduce algorithm contains two important tasks, namely Map and Reduce.
The Map task takes a set of data and converts it into another set of data, where individual elements are broken down into tuples (key-value pairs).
The Reduce task takes the output from the Map as an input and combines those data tuples (key-value pairs) into a smaller set of tuples. The reduce task is always performed after the map job.
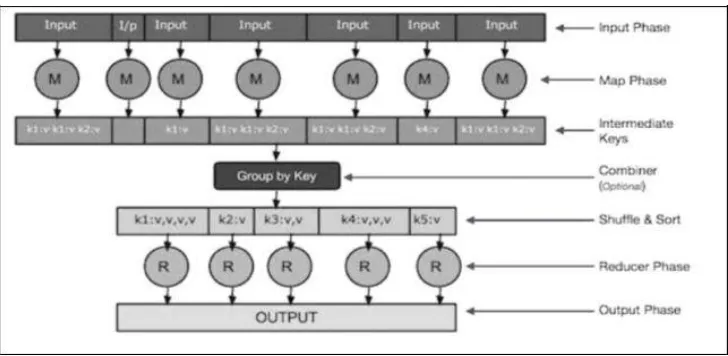
Let us now take a close look at each of the phases shown in figure 3 and try to understand their significance
Figure 3: Map reduce Paradigm
ISSN(Online): 2320-9801 ISSN (Print) : 2320-9798
I
nternational
J
ournal of
I
nnovative
R
esearch in
C
omputer
and
C
ommunication
E
ngineering
(An ISO 3297: 2007 Certified Organization)
Vol. 4, Issue 10, October 2016
ii. Map is a user-defined function, which takes a series of key-value pairs and processes each one of them to generate zero or more key-value pairs.
iii. Intermediate Keys- The key-value pairs generated by the mapper are known as intermediate keys.
iv. Combiner–A combiner is a type of local Reducer that groups similar data from the map phase into identifiable sets. It takes the intermediate keys from the mapper as input and applies a user-defined code to aggregate the values in a small scope of one mapper. It is not a part of the main MapReduce algorithm; it is optional.
v. Shuffle and Sort− The Reducer task starts with the Shuffle and Sort step. It downloads the grouped key-value pairs onto the local machine, where the Reducer is running. The individual key-value pairs are sorted by key into a larger data list. The data list groups the equivalent keys together so that their values can be iterated easily in the Reducer task. vi. Reducer− The Reducer takes the grouped key-value paired data as input and runs a Reducer function on each one of them. Here, the data can be aggregated, filtered, and combined in a number of ways, and it requires a wide range of processing. Once the execution is over, it gives zero or more key – value pairs to the final step.
vii. Output Phase− In the output phase, we have an output formatter that translates the final key-value pairs from the Reducer function and writes them onto a file using a record writer
2. HPCC
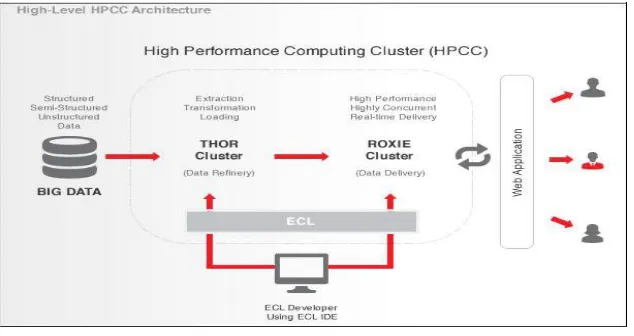
The HPCC Systems platform consists of two integrated but distinct clusters: a back-end data refinery cluster for ingesting, refining, and transforming big data called Thor and a front-end data delivery cluster supporting high-performance online querying of processed data called ROXIE. Both clusters run on commodity off-the-shelf hardware shown in figure 4.A single, powerful programming language called Enterprise Control Language (ECL) creates the applications that run on the data refinery cluster as well as those that drive the data delivery cluster. In combination these components provide a comprehensive, massively scalable solution for big data processing and analytics.
Figure 4: HPCC System architecture for Big data
A. THOR: THE DATA REFINERY CLUSTER FOR BIG DATA INGEST AND TRANSFORMATION
The HPCC Systems Data Refinery Cluster – known as “Thor”, after the hammer-wielding god of thunder – is responsible for ingesting, cleaning, transforming, linking, and indexing vast amounts of data. It functions as a distributed file system with parallel processing power spread across the nodes. A Thor cluster can scale from a single node to thousands of nodes.
Thor cluster:
i. Provides a massively parallel job execution environment for programs coded in ECL.
ISSN(Online): 2320-9801 ISSN (Print) : 2320-9798
I
nternational
J
ournal of
I
nnovative
R
esearch in
C
omputer
and
C
ommunication
E
ngineering
(An ISO 3297: 2007 Certified Organization)
Vol. 4, Issue 10, October 2016
iii. Provides a record-oriented distributed file system (DFS). A big data input file containing fixed or variable length records in standard or custom formats is partitioned across the cluster’s DFS, with each node getting approximately the same amount of record data and with no splitting of individual records.
iv. Is fault resilient, based on configurable replication of file parts within the cluster.
v. Utilizes middleware components that provide name services and other services in support of the distributed job execution environment.
B. ROXIE: THE DATA DELIVERY ENGINE SUPPORTING UP TO THOUSANDS OF REQUESTS PER SECOND
ROXIE – for Rapid Online XML Inquiry Engine – is the front-end cluster providing high-performance online query processing and data warehouse capabilities.
i. Data and indexes to support queries are pre-built on Thor and then deployed to ROXIE.
ii. ROXIE uses an index-based distributed file system, based on a custom B+ tree structure, to enable fast, efficient data retrieval.
iii. Queries may include joins and other complex transformations, and payloads can contain structured or unstructured data.
iv. Each ROXIE node runs a Server process and an Agent process. The Server process handles incoming query requests from users, allocates the processing of the queries to the appropriate Agents across the Roxy cluster, collates the results, and returns the payload to the client.
v. A ROXIE cluster is fault resilient, based on data replication within the cluster.
C. ECL: THE POWERFUL, EFFICIENT PROGRAMMING LANGUAGE BUILT FOR BIG DATA
Enterprise Control Language (ECL) is a key factor in the flexibility and capabilities of the HPCC Systems platform. This declarative programming language was designed specifically to enable the processing of massive data sets as efficiently as possible.
i. Accomplishes big data processing and analysis objectives with a minimum of coding.
ii. The sophisticated ECL compiler is cluster-aware and automatically optimizes code for parallel processing. Programmers needn’t be concerned about whether their code will be deployed on one node or hundreds of nodes. iii. An included graphical IDE for ECL simplifies development, testing, and debugging.
iv. ECL code compiles into optimized C++ and can be easily extended using C++ libraries.
v. ECL can be used both for complex data processing on a Thor cluster and for query and report processing on a ROXIE cluster.
D. ESP: A VERSATILE, STANDARDS-BASED END USER SERVICES PLATFORM
The Enterprise Services Platform (ESP) provides the means for end users to access ROXIE queries through common web services protocols.
i. Supports SOAP, XML, HTTP, and REST.
ii. Provides authentication, security, and logging functions.
3. Storm
Apache Storm is free and open source tool, easy to use and can be integrated with any programming language. It offers a reliably easy interface to perform real time processing, similar to what Hadoop does in batch processing [5]. It is a popular tool and is being used by the likes of Flipboard, Groupon, Twitter, Spotify, Yahoo(Japan), WebMD, Baidu and many more.
A. STORM FOR BIG DATA
ISSN(Online): 2320-9801 ISSN (Print) : 2320-9798
I
nternational
J
ournal of
I
nnovative
R
esearch in
C
omputer
and
C
ommunication
E
ngineering
(An ISO 3297: 2007 Certified Organization)
Vol. 4, Issue 10, October 2016
Storm has many use cases: real time analytics, online machine learning, continuous computation, distributed RPC, ETL, and more. Storm is fast: a benchmark clocked it at over a million tuples processed per second per node. It is scalable, fault-tolerant, guarantees your data will be processed, and is easy to set up and operate.
Storm integrates with the queuing and database technologies you already use. A Storm topology consumes streams of data and processes those streams in arbitrarily complex ways, repartitioning the streams between each stage (shown in figure 5) of the computation however needed.
Figure 5: STORM Architecture for Big data
In Storm, you design a graph of real-time computation called a topology, and feed it to the cluster where the master node will distribute the code among worker nodes to execute it. In a topology, data is passed around between spouts
that emit data streams as immutable sets of key-value pairs called tuples, and bolts that transform those streams (count, filter etc.). Bolts themselves can optionally emit data to other bolts down the processing pipeline.
4.GridGain
Grid Gain is Java-based middleware for in-memory processing of big data in a distributed environment[11]. It is based on high performance in-memory data platform that integrates fast Memory MapReduce implementation with In-Memory Data Grid technology delivering easy to use and easy to scale software. Using Grid Gain you can process terabytes of data, on 1000s of nodes in under a second.
Grid Gain typically resides between business, analytics, transactional or BI applications and long term data storage such as RDBMS, ERP or Hadoop HDFS, and provides in-memory data platform for high performance, low latency data storage and processing.
Both, Grid Gain and Hadoop, are designed for parallel processing of distributed data. However, both products serve very different goals and in most cases are very complementary to each other. Hadoop is mostly geared towards batch-oriented offline processing of historical and analytics payloads where latencies and transactions don't really matter, while Grid Gain is meant for real-time in-memory processing of both transactional and non-transactional live data with very low latencies. To better understand where each product really fits, let us compare some main concepts of each product.
A. GRID GAIN IN-MEMORY COMPUTE GRID VS HADOOP MAPREDUCE
ISSN(Online): 2320-9801 ISSN (Print) : 2320-9798
I
nternational
J
ournal of
I
nnovative
R
esearch in
C
omputer
and
C
ommunication
E
ngineering
(An ISO 3297: 2007 Certified Organization)
Vol. 4, Issue 10, October 2016
then reducing the results in parallel on multiple nodes as well. Because of that, standard disk-based Map Reduce is good for problem sets which require analyzing every single record in a file and does not fit for cases when direct access to a certain data record is required. Furthermore, due to offline batch orientation of Hadoop it is not suited for low-latency applications.
GridGain In-Memory Compute Grid (IMCG) on the other hand is geared towards in-memory computations and very low latencies. Grid Gain IMCG shown in figure 6 has its own implementation of MapReduce which is designed specifically for real-time in-memory processing use cases and is very different from Hadoop one. Its main goal is to split a task into multiple sub-tasks, load balance those sub-tasks among available cluster nodes, execute them in parallel, then aggregate the results from those sub-tasks and return them to user.
Splitting tasks into multiple sub-tasks and assigning them to nodes is the mapping step and aggregating of results is
reducing step. However, there is no concept of mandatory data built in into this design and it can work in the absence of any data at all which makes it a good fit for both, stateless and state-full computations, like traditional HPC. In cases when data is present, GridGain IMCG will also automatically colocate computations with the nodes where the data is to avoid redundant data movement.
Figure 6: Grid Gain In Memory Computer Gird Architecture
It is also worth mentioning, that unlike Hadoop, GridGain IMCG is very well suited for processing of computations which are very short-lived in nature, e.g. below 100 milliseconds and may not require any mapping or reducing.
5. IBM Cognos
It is the revolutionary new business intelligence release from IBM that breaks down the barriers to analytics. It is revolutionary because it expands traditional BI capabilities with planning, scenario modeling, real-time monitoring, and predictive analytics. These capabilities deliver power in an easy-to-use and unified experience that is collaboration and social networking enabled.
ISSN(Online): 2320-9801 ISSN (Print) : 2320-9798
I
nternational
J
ournal of
I
nnovative
R
esearch in
C
omputer
and
C
ommunication
E
ngineering
(An ISO 3297: 2007 Certified Organization)
Vol. 4, Issue 10, October 2016
A. FUNCTIONS
IBM Cognos Business Intelligence enables organizations to gain all the perspectives they need to increase performance by providing the following functions:
i. Analytics that everyone can use to answer key business questions—sharpening individual skills and improving
business outcomes
ii. Collective intelligence to connect people and insights to gain alignment—collapsing the time needed to align,
decide, and act
iii. Actionable insight everywhere it is needed in real-time, mobile, and business processes that enable instant
response to changing business conditions
With IBM Cognos Business Intelligence software , you can[10]
i. Equip users with what they need to explore information freely, analyze key facts, collaborate to gain alignment
with key stakeholders and make decisions with confidence for better business outcomes.
ii. Provide quick access to facts with reports, analysis, dashboards, scorecards, planning and budgets, real-time
information, statistics and the flexibility to manage information for more informed decisions.
iii. Integrate the results of “what-if” analysis modeling and predictive analytics into your unified workspace to view
possible future outcomes alongside current and historical data.
iv. Support where users need to work with business intelligence capabilities for the office and desktop, on mobile
devices, online and offline.
v. Meet different analytics needs throughout your business with solutions that are integrated and right-sized for
individuals, workgroups or midsize businesses and large organizations or enterprises.
vi. Implement a highly scalable and extensible solution that can adapt to the changing needs of IT and the business
with flexible deployment options that include the cloud, mainframes and data warehousing appliances.
vii. Start addressing your most pressing needs with the confidence that you can grow your solution over time to meet
future requirements with the integrated Cognos 10 family of products.
6. Mongo DB
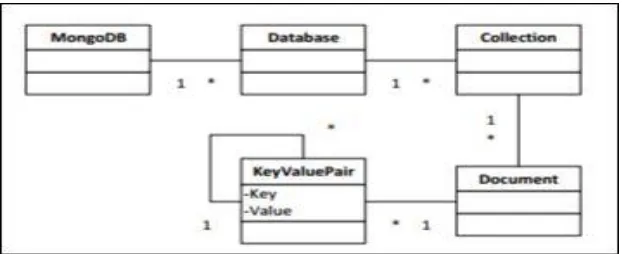
The MongoDB database consists of a set of databases in which each database contains multiple collections shown in figure 7. Because MongoDB works with dynamic schemas, every collection can contain different types of objects. Every object – also called document – is represented as a JSON structure: a list of key-value pairs. The value can be of three types: a primitive value, an array of documents or again a list of key-value-pairs.
A. MODEL OF MONGO DB SYSTEM
MongoDB supports two types of replication: master-slave and replica sets. In the master-slave replication, the master has full data access and writes every change to its slaves.
ISSN(Online): 2320-9801 ISSN (Print) : 2320-9798
I
nternational
J
ournal of
I
nnovative
R
esearch in
C
omputer
and
C
ommunication
E
ngineering
(An ISO 3297: 2007 Certified Organization)
Vol. 4, Issue 10, October 2016
The slaves can only be used to read data. Replica sets work the same as master-slave replications, but it is possible to elect a new master if the original master went down. Another feature supported by MongoDB is automatic sharding [14].
MongoDB is in the forefront of NoSQL databases, providing agility and scalability to businesses. More than thousand companies and new start-up companies have acquire and are using MongoDB to develop new applications, refine client experience, fast track marketing time and minimize costs. It’s use of mostly bigger web applications like facebook , Amazon, Google etc. Due to the need, of huge amount of data storage for big data technologies we make use of one of the boosting invented technology of NoSQL database i.e. MongoDB, Cassandra. MongoDB stores data in JSON structure, so get result in different-2 format it automatically.
B. QUERY TYPE IN MONGODB
MongoDB queries come in different form. A query issued to extract information from a collection may return a document in the form of JSON or a particular set of fields within the document. MongoDB query types are listed below.
i. Map Reduce Queries perform complex data processing expressed in JavaScript and performed all data in the database collections.
ii. Text Search Queries return results in the order of relevance using text arguments containing Boolean operators like NOT,AND,OR.
iii.Aggregation Framework Queries return groups of values returned by the query, analogous to GROUP BY in SQL statements.
iv. Key-value Queries return results using a specific field in the document, usually the primary key.
v. Range Queries return results using values defined as inequalities such as equal to, greater than, less than, less than , greater than or equal to or equal to.
vi. Geospatial Queries return results using a proximity area, inclusion and intersection as specified by a circle and point and plygon.
C. MONGODB FOR INTEGRATING ONLINE BIG DATA
With its rich document model, powerful query functionality, scalable architecture, and integration with leading BI and analytics tools, MongoDB can be deployed as a key database component both within, and as an extension of, a BI platform, including[15]:
i. A conventional data source for regular ETL processes integrating data into the EDW.
ii. A “data hub,” replicating and consolidating data from operational and EDW sources, allowing for cross-function, complete 360-degree view reporting and visualization.
iii.A data store enabling real-time analytics and dashboards to be generated against live, operational data.
7. Pentaho
Pentaho provides a complete big data analytics solution that supports the entire big data analytics process. From big data aggregation, preparation, and integration, to interactive visualization, analysis, and prediction, Pentaho allows you to harvest the meaningful patterns buried in big data stores.
A. BLENDED BIG DATA ANALYTICS
A tightly coupled data integration and business analytics platform accelerates the realization of value from blended big data.
i. Full array of analytics- data access and integration to data visualization and predictive analytics
ii. Empowers users to architect big data blends at the source and stream them directly for more complete and accurate analytics
ISSN(Online): 2320-9801 ISSN (Print) : 2320-9798
I
nternational
J
ournal of
I
nnovative
R
esearch in
C
omputer
and
C
ommunication
E
ngineering
(An ISO 3297: 2007 Certified Organization)
Vol. 4, Issue 10, October 2016
iv. Supports the broadest spectrum of big data sources, taking advantage of the specific and unique capabilities of each technology
v. Open, standards based architecture makes it easy to integrate with or extend existing infrastructure.
The value of Big Data is well recognized today, with implementations across every size and type of business today. In the combination of data with other relevant data from existing internal and external systems and
sources. This need to blend data to derive maximum value will only escalate as new types and sources of data and information continue to emerge[6] . Within a single platform, Pentaho provides big data tools to extract, prepare and blend your data, plus the visualizations and analytics that will change the way you run your business. From Hadoop and Spark to NoSQL, Pentaho allows you to turn big data into big insights.
B. BIGDATA ARCHITECTURE WITH PENTAHO
Combining the power of design via drag-and drop across all data sources, including schemas generated on read from big data sources, with knowledge of the full data semantics – the real meaning, cardinality, and match of fields and values in the data – means your business gets accurate results. Decisions become optimized and actions can be taken to significantly impact business positively and improve results. The Pentaho for Big data architecture is shown in figure 8. From the point of data origin through analysis and predictive analytics, Pentaho tightly couples data integration with business analytics in a continuous big data solution to remove complexity and reduce the time to realize value from big data.
Figure 8: Big data Architecture with Pentaho
Beyond interactive visualization and exploration of data, Pentaho provides powerful, state-of-the-art machine learning algorithms and data processing tools. Data scientists and analysts can uncover meaningful patterns and correlations otherwise hidden with standard analysis and reporting[7].
III. BIG DATA TOOLS COMPARATIVE ANALYSIS
ISSN(Online): 2320-9801 ISSN (Print) : 2320-9798
I
nternational
J
ournal of
I
nnovative
R
esearch in
C
omputer
and
C
ommunication
E
ngineering
(An ISO 3297: 2007 Certified Organization)
Vol. 4, Issue 10, October 2016
distributed environment. It is based on high performance in-memory data platform that integrates fast. Apache Storm is a free and open source distributed real time computation system. Storm makes it easy to reliably process unbounded streams of data, doing for real time processing what Hadoop did for batch processing. NoSQL(MongoDB) has the advantage of horizontal expansion, but for complex SQL requests, it cannot support them very well. For the Query based on KEY/VALUE and massive data storage requirements, NOSQL is a very worth doing choice for me and all other developers and organizations who’s developed big applications. Pentaho’s Adaptive Big Data Layer creates “future-proofed” access to all data sources including Hadoop, NoSQL and analytic databases insulating organizations from the shifting sands of the big data ecosystem.
IV. CONCLUSION
In this paper we have discussed the importance of big data tools in real-world applications managing and mining Big Data is Challenging task, As the data concern large in a volume, distributed and decentralized control and complex. There are several challenges at data, model and system level. We need computing platform to handle this Big Data.
REFERENCES
1. Mobile phone user statistics, https://www.statista.com/statistics/274774/forecast-of-mobile-phone-users-worldwide/ 2. Twitter usage statistics, http://www.internetlivestats.com/twitter-statistics
3. Judith Hurwitz, Alana Nugent, Dr. Fern Halper, Marcia Kaufman, Big Data for Dummies, John Wiley & Sons Inc, USA 2013
4. Krystian Lider, Comparison of the Grid/Cloud Computing Frameworks (Hadoop, GridGain, Hazelcast,
DAC),https://dzone.com/articles/gridgain-and-hadoop 5. apache storm documentation, http://storm.apache.org
6. Architected Blended Big Data with Pentaho,pentahohttp://pentaho.graymatter.co.in/wp-content/uploads/2016/01/21-Oct-20141138301_architected_blended_big_data_whitepaper_0.pdf
7. Pentaho Predictive Analytics, https://www.pentaho.com/sites/default/files/uploads/resources/predictive_analytics.pdf 8. Mircea Răducu TRIFU, Mihaela Laura IVAN, Big Data: present and future,http://dbjournal.ro/archive/15/15_4.pdf 9. Rick Smolan, Jennifer Erwit, The Human face of Big Data, Ed. Against all odds production, Sausalito, CA 2012
10. Paul C. Zikopoulos Dirk deRoos Krishnan Parasuraman Thomas Deutsch David Corrigan James Giles ,Harness the Power of Big Data, The IBM Big Data Platform, The McGraw-Hill Companies
11. Nikita Ivanov, GridGain & Hadoop: Differences & Synergies,https://www.gridgain.com/resources/blog/gridgain-hadoop-differences-synergies 12. Sarannia,N.Padmapriya, Survey On Big Data Processing In Geo Distributed Data Centers Vol 4, Issue 11, November 2014
13. ajat Aghi, Sumeet Mehta, Rahul Chauhan, Siddhant Chaudhary and Navdeep Bohra .A comprehensive comparison of SQL and MongoDB databases, International Journal of Scientific and Research Publications, Volume 5, Issue 2, February 2015 1 ISSN 2250-3153
14. Shading, https://docs.mongodb.com/manual/sharding/
15. A MongoDB White Paper,MongoDB: Bringing Online Big Data to Business Intelligence & Analytics,June 2016