University of Windsor University of Windsor
Scholarship at UWindsor
Scholarship at UWindsor
Electronic Theses and Dissertations Theses, Dissertations, and Major Papers
2012
Factors mediating structure and trophic interactions of estuarine
Factors mediating structure and trophic interactions of estuarine
nekton communities
nekton communities
Jill A. Olin
University of Windsor
Follow this and additional works at: https://scholar.uwindsor.ca/etd
Recommended Citation Recommended Citation
Olin, Jill A., "Factors mediating structure and trophic interactions of estuarine nekton communities" (2012). Electronic Theses and Dissertations. 5589.
https://scholar.uwindsor.ca/etd/5589
This online database contains the full-text of PhD dissertations and Masters’ theses of University of Windsor students from 1954 forward. These documents are made available for personal study and research purposes only, in accordance with the Canadian Copyright Act and the Creative Commons license—CC BY-NC-ND (Attribution, Non-Commercial, No Derivative Works). Under this license, works must always be attributed to the copyright holder (original author), cannot be used for any commercial purposes, and may not be altered. Any other use would require the permission of the copyright holder. Students may inquire about withdrawing their dissertation and/or thesis from this database. For additional inquiries, please contact the repository administrator via email
FACTORS MEDIATING STRUCTURE AND TROPHIC INTERACTIONS OF
ESTUARINE NEKTON COMMUNITIES
By
Jill A. Olin
A Dissertation
Submitted to the Faculty of Graduate Studies through Great Lakes Institute for Environmental Research
in Partial Fulfillment of the Requirements for the Degree of Doctor of Philosophy at the
University of Windsor
Windsor, Ontario, Canada
2011
iii
CO-AUTHORSHIP DECLARATION
I hereby declare that this dissertation includes original research reprinted from
co-authored, submitted and published manuscripts. In all chapters A.T. Fisk contributed
intellectually by providing consultation, and facilities and materials required for
completion of the research. For chapter 2, P.W. Stevens, S.A. Rush and N.E. Hussey
contributed to the research with sample collection, statistical guidance and manuscript
consultation. For chapter 3, N.E. Hussey, M. Fritts, M.R. Heupel, C.A. Simpfendorfer
and G. Poulakis contributed to the research with sample collection, sample preparation
and consultation on the manuscript. For chapter 4, S.A. Rush and M.A. MacNeil
contributed to the research with statistical guidance and manuscript consultation. For
chapter 5, S.A. Rush and N.E. Hussey contributed to the research with statistical
guidance and manuscript consultation, M.R. Heupel, C.A. Simpfendorfer and G.R.
Poulakis contributed to the research with sample collection. The writing of all chapters
included in this dissertation, however, was completed entirely by the author, Jill A. Olin.
I am aware of the University of Windsor Senate Policy on Authorship and I
certify that I have properly acknowledged the contribution of other researchers to my
dissertation, and have obtained written permission from each of the co-author(s) to
include the above material(s) in my dissertation.
I certify that, with the above qualification, this dissertation, and the research to
iv
DECLARATION OF PREVIOUS PUBLICATION
This dissertation includes 3 original manuscripts that have been published or
submitted for publication in peer reviewed journals, as follows:
CHAPTER 2 Olin JA, Stevens PW, Rush SA, Hussey NE, Fisk AT. Loss of seasonal variability in nekton community structure in an altered tidal river: evidence for homogenization in a flow-altered system. (Manuscript in Review: Ecological Applications 17 October 2011).
CHAPTER 3 Olin JA, Hussey NE, Fritts M, Heupel MR, Simpfendorfer CA, Poulakis GR, Fisk AT. 2011. Maternal meddling in neonatal sharks: implications for interpreting stable isotopes in young animals. Rapid Communications in Mass Spectrometry 25:1008-1016.
CHAPTER 4 Olin JA, Rush SA, MacNeil MA, Fisk AT. 2011. Isotopic ratios reveal mixed seasonal variation among fishes from two subtropical estuarine systems. Estuaries and Coasts doi: 10.1007/s12237-011-9467-6
I certify that I have obtained a written permission from the copyright owner(s) to
include the above published material(s) in my dissertation. I certify that the above
material describes work completed during my registration as graduate student at the Great
Lakes Institute for Environmental Research, University of Windsor.
I declare that, to the best of my knowledge, my dissertation does not infringe upon
anyone’s copyright nor violate any proprietary rights and that any ideas, techniques,
quotations, or any other material from the work of other people included in my
dissertation, published or otherwise, are fully acknowledged in accordance with the
standard referencing practices. Furthermore, to the extent that I have included
copyrighted material that surpasses the bounds of fair dealing within the meaning of the
Canada Copyright Act, I certify that I have obtained a written permission from the
v
I declare that this is a true copy of my dissertation, including any final revisions,
as approved by my dissertation committee and the Graduate Studies office, and that this
dissertation has not been submitted for a higher degree to any other University or
vi
ABSTRACT
Understanding how communities and species assemblages persist is among the
most fundamental objectives in ecology, particularly as human modifications to the
landscape increase. Through application of traditional community metrics with emerging
biochemical tracers in combination with community/food web ecology theory, I provide
an evaluation of the effects of anthropogenically-altered freshwater flow disturbance on
estuarine nekton community structure and trophic interactions. These two parameters are
central toward understanding the functioning of aquatic communities and ensuring their
persistence.
This dissertation provides data regarding the effects of human-altered freshwater
flow on estuarine nekton communities in tidal rivers and, in doing so, has fostered
valuable findings regarding the application of stable isotopes to estuarine fishes and large
vertebrates. Specifically, this research demonstrates that losses of estuarine nekton
community biodiversity (Chapter 2), the shift in resource availability to lower trophic
level species (Chapter 5), and changes to energy flow pathways leading to higher trophic
level consumers (Chapter 6), are all associated with high flow events. This dissertation
further demonstrates that the application of stable isotopes requires consideration of a
species life history characteristics, as interpretation of a species diet and trophic roles can
be complex (Chapters 3 and 4).
Collectively, these findings suggest that high flow events affect the structure and
trophic interactions of estuarine nekton communities and provide a greater understanding
of the impacts of such anthropogenic-mediated stressors on these complex ecosystems.
vii
persistence of estuaries remains to be established. However, in order to maintain and/or
restore the integrity of an ecosystem requires that conservation and management actions
be firmly grounded in scientific understanding. This becomes especially relevant as
worldwide changes to hydrologic connectivity continue with increasing anthropogenic
pressures.
This research demonstrates the potential for the simplification of food webs and
changes to dominant trophic assemblages that are associated with flow alteration. For the
commercially, recreationally and ecologically valuable species that define estuarine
nekton communities, these observations emphasize the necessity of research and
management programs aimed at maintaining the integrity of these highly-valued
viii
DEDICATION
GBO, NAO and TJO
ix
ACKNOWLEDGEMENTS
Many people have contributed to the completion of this dissertation, perhaps none
more than my supervisor Aaron Fisk. Aaron’s enthusiasm with the prospect of new
questions and ideas is invigorating and his patience is endless, even through my most
severe bouts of procrastination. Thank you, Aaron, for taking a chance and giving me this
opportunity.
I am extremely grateful to Nigel Hussey and Scott Rush for the many days spent
discussing ecological and stable isotope theory and ideas, no matter how absurd. Without
their guidance and support, I am certain that this dissertation would have been a lesser
version of itself. Their appetite for knowledge and desire to drink beer will remain an
inspiration to me for the rest of my career. I am grateful to Jim Peterson and Aaron
MacNeil for their guidance in helping me think more broadly, as especially outside of the
statistical box.
I thank Philip Stevens, Michelle Heupel, Colin Simpfendorfer, and Gregg
Poulakis for input and assistance with idea development and logistics of sample
collection. I thank my supervisory committee, Doug Haffner, Ken Drouillard and Daniel
Mennill, for their willingness to participate in this process and for their advice and
guidance throughout the course of this research.
I would also like to thank the staff of Mote Marine Laboratory’s Center for Shark
Research and of Florida Fish and Wildlife Conservation Commission’s, Port Charlotte
Field Station especially, Beau Yeiser, Tonya Wiley, Jack Morris, Jim Gelsleichter, John
Tyminski and Amy Timmers for keeping it light and fun on those long hot days searching
x
Much of this work would not have been completed without the efforts of Tom
Maddox, Mark Fritts, William Mark, Richard Doucette, David Qui, Nargis Ismail, Sandra
Ellis, Kristen Diemer, Amer Pasalic, Mary Lynn Mailloux, Carly Ziter and Jaclyn Brush.
Without each of you, I would still be in the lab processing samples. I thank Mary Lou
Scratch for being Mary Lou; your efforts do not go unnoticed.
I cherish my friendships with Michael Burtnyk, Bailey McMeans, Christina
Smeaton and Ryan Walter. Aside for my academic admiration for each of you, your
abilities to continually make me laugh and remind me of how important it is to do so,
made every moment of this adventure enjoyable. What stress?
I need to acknowledge my family and those that have stood behind me from the
start of this adventure. My parents have been tireless in their support for my adventures
(...and I have had many) and my success is entirely a result of their endless love and
support—and monetary subsidies from time to time. Ted deserves special credit for his
uncanny ability to make me see the bigger picture and refocus my compass- thank you
buddy. I thank my boys, Jacques and Finn for their unconditional love and snuggles. And
finally, I especially want to thank Gordon Paterson, for being that unwavering light at the
end of the tunnel. I am so blessed to have you in my life. Your passion and patience for
science is unmatched and it is contagious. Your support, even at distance, was a constant
reminder of why I embarked on this adventure. xx.
xi
TABLEOF CONTENTS
CO-AUTHORSHIP DECLARATION ... iii
DECLARATION OF PREVIOUS PUBLICATION ... iv
ABSTRACT ... vi
DEDICATION ... viii
ACKNOWLEDGEMENTS ... ix
LIST OF TABLES ... xiv
LIST OF FIGURES ... xvii
CHAPTER 1 - GENERAL INTRODUCTION ... 1
DISTURBANCE ... 2
ESTUARIES: ECOLOGY AND IMPORTANCE ... 4
STUDY SITES ... 6
DISSERTATION OBJECTIVES ... 7
OVERVIEW OF CHAPTERS ... 9
REFERENCES . ...12
CHAPTER 2 - LOSS OF SEASONAL VARIABILITY IN NEKTON COMMUNITY STRUCTURE IN A TIDAL RIVER: EVIDENCE FOR HOMOGENIZATION IN A FLOW-ALTERED SYSTEM ... 19
INTRODUCTION ... 20
MATERIALS AND METHODS ... 23
Nekton community composition ... 24
Statistical analysis ... 26
RESULTS... . 29
Environmental parameters ... 29
Nekton community: Trawl... 29
Nekton community: Seine ... 31
Comparisons of nekton communities between estuaries ... 32
DISCUSSION ... 33
Management implications ... 38
REFERENCES ... 41
SUPPLEMENTAL MATERIAL ... 55
CHAPTER 3 - MATERNAL MEDDLING IN NEONATAL SHARKS: IMPLICATIONS FOR INTERPRETING STABLE ISOTOPES IN YOUNG ANIMALS ... 59
INTRODUCTION ... 60
MATERIALS AND METHODS ... 63
xii
DISCUSSION ... 67
REFERENCES ... 74
SUPPLEMENTAL MATERIAL ... 83
CHAPTER 4 - ISOTOPIC RATIOS REVEAL MIXED SEASONAL VARIATION AMONG FISHES FROM TWO SUBTROPICAL ESTUARINE SYSTEMS ... 85
INTRODUCTION ... 86
MATERIALS AND METHODS ... 88
Sample collection ... 88
Stable isotope analysis ... 89
Data Analysis ... 91
RESULTS... 93
DISCUSSION ... 95
Body size variability ... 96
Seasonal variability ... 98
Spatial variability ... 100
Conclusions ... ...101
REFERENCES...102
SUPPLEMENTAL MATERIAL ... 111
CHAPTER 5 - GOING WITH THE FLOW: REDUCED INTER-SPECIFIC VARIABILITY IN STABLE ISOTOPE RATIOS OF NEKTON IN RESPONSE TO ALTERED HIGH FLOW ... 114
INTRODUCTION ... 115
MATERIALS AND METHODS ... 117
Study sites ... 117
Sample collection ... 119
Stable isotope analysis ... 120
Data analysis ... ...122
RESULTS... 123
DISCUSSION ... 125
Conclusions ... 132
REFERENCES ... 133
SUPPLEMENTAL MATERIAL ... 149
CHAPTER 6 – CHANGES IN RESOURCE EXPLOITATION BY ESTUARINE CONSUMERS EXPERIENCING ALTERED HIGH FLOW AS INFERRED FROM FATTY ACID BIOMARKERS ... 151
INTRODUCTION ... 152
MATERIALS AND METHODS ... 155
Study sites, species and sample collection ... 155
Lipid and fatty acid analysis ... 157
Data analysis ... 158
RESULTS... 160
Fatty acids of consumers ... 160
Variation in FA biomarkers of consumers in each trophic guild ... 161
Ratios of ω3/ω6 PUFA ... 163
xiii
Conclusions ... 168
REFERENCES ... 169
SUPPLEMENTAL MATERIAL ... 183
CHAPTER 7 – GENERAL DISCUSSION ... 185
CONTRIBUTIONS OF THE DISSERTATION ... 188
Community ecology ... 188
Food web ecology ... 189
Biochemical tracers ... 190
FUTURE DIRECTIONS ... 192
REFERENCES ... 195
APPENDIX A – REPRINT PERMISSIONS ... 197
xiv
LISTOF TABLES
CHAPTER 2
Table 2.1 Flow1 and environmental parameters2 measured from each sampling event in the Myakka and Caloosahatchee estuaries during the dry (spring—May and June) and wet (autumn—August and September) seasons of 2006, 2008 and 2009. Data are mean (± SE) and range. Bold values reflect significant differences at α = 0.05...48
Table 2.2 Community metrics estimated (mean ± SD) from all trawl and seine sampling events for the nekton community, and the ecological and trophic guilds, sampled from the Myakka and the Caloosahatchee estuaries during the dry and wet seasons.1 Bold values reflect significant differences at α = 0.05 (see Table 2.S1 Supplemental Materials for results of the analyses)...49
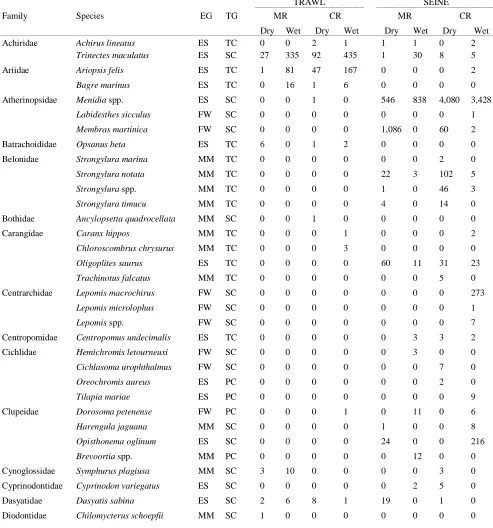
Table 2S.1 Summary of species and total abundance collected from trawl and seine surveys from the Myakka (MR; n = ~6 trawls and ~4 seines each season) and
Caloosahatchee (CR; n = ~5 trawls and ~10 seines each season) estuaries during the dry and wet seasons of 2006, 2008 and 2009. Species are categorized using ecological guild (EG) and trophic guild (TG) designations1...55
Table 2S.2 Results of the Tukey contrasts from the linear mixed-effect models.
Comparisons between seasonal estimates of nekton diversity, richness and evenness for each estuary are presented. Bold values reflect significant differences at α = 0.05...58
CHAPTER 3
Table 3S.1 Results of GLMs used to test the effect of sex, season, sampling location and year of sampling on δ13C and δ15
N of the two species of shark. Significance is denoted by bold text (α = 0.05)...84
CHAPTER 4
Table 4.1 Maximum recorded standard lengths (MSL1; cm), length (FL, mean ± SE, range; cm), sample size (n), and δ15N, δ13C and δ34S values for muscle tissue (‰ mean ± SE) of fish species sampled seasonally (i.e. spring May–June; autumn September–
October) from the Caloosahatchee and Myakka estuaries. For n < 3, all values are
presented...107
Table 4.2 Model selection results1 for top-ranked models for δ15N, δ13C and δ34S values of each fish species pooled across both estuaries...108
Table 4S.1 Model results for δ15N values of each fish species pooled across both
xv
Table 4S.2 Model results for δ13C values of each fish species pooled across both
estuaries...112
Table 4S.3 Model results for δ34S values of each fish species pooled across both
estuaries...113
CHAPTER 5
Table 5.1 Stable isotope values (n = number of individuals sampled; ‰ mean ± SE) of species collected from the estuary of the Caloosahatchee River, Florida, USA, following low (May–June) and high (September–October) freshwater flow regimes. Length
indicates standard length for fishes, disc width for stingrays and carapace width for crabs (cm)...141
Table 5.2 Trophic categories1 (primary consumer, secondary consumer, tertiary consumer, piscivore) and resource use categories (benthic, pelagic) based on dietary sources compiled from published literature, for consumer species sampled from the Caloosahatchee River Estuary...142
Table 5.3 Results of two-way ANOVA used to test the effect of (1) flow condition (low
vs. high) and (2) resource use category (benthic vs. pelagic) on δ13C, δ15N, and δ34S values of species within the designated trophic categories (α = 0.05; statistical
significance highlighted in bold)...143
Table 5S.1 Environmental parameters measured from each sampling event in the Caloosahatchee and Myakka estuaries during the dry (spring—May and June) and wet (autumn—August and September) seasons of 2008. Data are mean ± SE...149
Table 5S.2 Results of the analyses of variance (ANOVA) performed to test for differences in δ13C, δ15N, and δ34
S values among consumer species sampled following low and high flow regimes (α = 0.05; statistical significance highlighted in bold)...150
CHAPTER 6
Table 6.1 Fatty acids and fatty acid ratios used as biomarkers for potential estuarine organic matter sources compiled from published literature...174
Table 6.2 Length, lipid content (% dry weight) and fatty acid values (n = number of individuals; % mean ± SE total fatty acids) of selected biomarkers of estuarine consumers sampled from the Caloosahatchee and Myakka estuaries during dry and wet seasons. For
xvi
Table 6.4 Results of two-way ANOVAs performed on transformed factor scores from PCA used to test the effect of (1) trophic guild, (2) season (dry vs. wet) and (3)
interaction on FA biomarkers profiles (α = 0.05; statistical significance highlighted in bold)...178
Table 6S.1 Fatty acid composition of macro-invertebrate and fish consumers sampled from the Caloosahatchee estuary (mean % proportion ± SE of the total fatty acids) in 2008...183
xvii
LISTOF FIGURES
CHAPTER 2
Figure 2.1 Map of the study sites showing the estuarine reaches of the Myakka and Caloosahatchee Rivers with respect to the south western coast of Florida...50
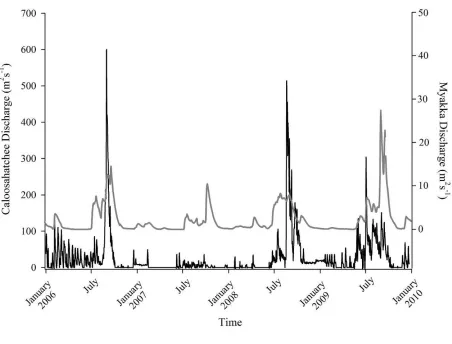
Figure 2.2 Mean daily river discharge recorded in the Caloosahatchee (black) and the Myakka (gray) from 2006 to 2010. River discharge data were obtained from the U.S. Geological Survey web site (http://water.usgs.gov/data.html) for the Myakka River at Myakka River near Sarasota (Station 02298830), and from the South Florida Water Management District web site (http://my.sfwmd.gov) for the Caloosahatchee River at the Cape Coral Bridge (Station CCORAL)...51
Figure 2.3 (A), (D) Nekton assemblage, (B), (E) ecological guild (estuarine species, black points; marine migrant species, gray points; freshwater species, white points) and (C), (F) trophic guild density from trawl sampling (primary consumers, black points; secondary consumers, gray points; tertiary consumers, white points) against season (data are mean density ± SE). Asterisks (*) indicates significant differences between dry and wet season at α = 0.05...52
Figure 2.4 (A), (D) Nekton assemblage, (B), (E) ecological guild (estuarine species, black points; marine migrant species, gray points; freshwater species, white points) and (C), (F) trophic guild density from seine sampling (primary consumers, black points; secondary consumers, gray points; tertiary consumers, white points) against season (data are mean density ± SE). Asterisks (*) indicates significant differences between dry and wet season at α = 0.05...53
Figure 2.5 Nonmetric multi-dimensional scaling (NMDS) depicting assemblage differences between the Myakka (dry: gray triangles; wet: gray circles) and
Caloosahatchee (dry: black triangles; wet: black circles) estuaries. Data are density estimates of species collected via (A) trawl (stress: 0.12) and (B) seine (stress: 0.14), fitted with 95% confidence interval ellipses to represent the season-estuary differences. Strength of the environmental parameters is indicated in bold. Dotted lines represent the dry season and solid lines represent the wet season...54
CHAPTER 3
Figure 3.1 Relationships between USS and δ13C and δ15N values (mean ± SE) for (a), (b) muscle and (c), (d) liver of the Atlantic sharpnose (Rhizoprionodon terraenovae). Letters displayed above a given USS indicate the USS(s) for which pair-wise comparisons revealed significant differences. Numbers in plot (a) and (c) represent the sample size of sharks per USS...79
xviii
a given USS indicate the USS(s) for which pair-wise comparisons revealed significant differences. Numbers in plot (a) and (c) represent the sample size of sharks sampled per USS...80
Figure 3.3 Relationships between total length (TL) and δ13C and δ15N values for (a), (b) muscle and (c), (d) for liver tissues of the Atlantic sharpnose shark (Rhizoprionodon terraenovae) and (e), (f) for muscle and (g), (h) for liver of the bull shark (Carcharhinus leucas); curves were fitted with polynomial models...81 Figure 3.4 Changes in δ13C and δ15N values in regard to date sampled for (a), (b), muscle and (c), (d) for liver tissues of the Atlantic sharpnose shark (Rhizoprionodon
terraenovae) and (e), (f) for muscle and (g), (h) for liver of the bull shark (Carcharhinus leucas); curves were fitted with polynomial models...82 CHAPTER 4
Figure 4.1 Map of the study site showing the locations of the Caloosahatchee and
Myakka Rivers with respect to the south western coast of Florida. Insets: Locations of the estuarine portions of the two rivers from which fishes were sampled (black squares represent spring sample locations; gray circles represent autumn sample locations)....109
Figure 4.2 Parameter estimate results with 95% confidence intervals for the best-fit models for (A) δ15N, (B) δ13C and (C) δ34
S values for each fish species sampled from the Caloosahatchee and Myakka estuaries. Symbols indicate species isotopic relationships were best described by season (●) or body size (□) where AICc supported such an effect. Negative parameter estimates represent enriched isotopic values in autumn and positive parameter estimates represent depleted isotopic values in autumn. Trophic position1 is indicated along the y-axis for each species.
1Trophic position (TP) was estimated for all fishes using δ15
N as follows: TP = TPbaseline + (δ15
Nconsumer - δ15Nbaseline)/Δ15N, where TPbaseline is the estimated TP of the baseline organism, δ15
Nconsumerand δ15Nbaseline are the mean δ15N of the consumer of interest and of the baseline organism, respectively, and 3.4‰ was used as the Δ15
N (Post 2002). Mean δ15
N of Mugil cephalus, designated as TP 2.0, was used as the baseline for all fishes, as this species is characterized as a primary consumer over the size range sampled here (Platell et al. 2006)...110
CHAPTER 5
Figure 5.1 Map of the study site showing the location of the Caloosahatchee River with respect to the south-western coast of Florida. Inset: Indicates the sampling locations (e.g. water quality and consumer species; spring; ▲autumn) within the estuarine portion of the river...144
xix
Figure 5.3 Mean (‰ ± 95% confidence interval) values of δ13C, δ15N and δ34S in consumer species sampled from the Myakka estuary following the dry (A), (C) and wet (B), (D) seasons...146
Figure 5.4 Mean (‰ ± 95% confidence interval) values of δ13C, δ15N and δ34S in consumer species sampled from the Caloosahatchee estuary following the dry (A), (C) and wet (B), (D) seasons...147
Figure 5.5 Mean (‰ ± SE) values of (A) δ13C, (B) δ15N and (C) δ34S depicting differences between flow regimes (● low flow; ○ high flow) in consumer species
sampled from the Caloosahatchee River estuary. Significant differences in isotopic values between regimes, based on ANOVA, are highlighted in gray (α = 0.05)...148
CHAPTER 6
Figure 6.1 Principal component analyses of the secondary consumers depicting seasonal differences using FA. Ellipses are one standard deviation around the mean of each consumer’s biomarker profile given the season (closed symbols and black lines represent dry season; open symbols and gray lines represent wet season). Only biomarkers with the strongest contribution to principal components are depicted (Table 6.3)...179
Figure 6.2 Principal component analyses of the tertiary consumers depicting seasonal differences using FA biomarkers. Ellipses are one standard deviation around the mean of each consumer’s biomarker profile given the season (closed symbols and black lines represent dry season; open symbols and gray lines represent wet season). Biomarkers with the strongest contribution to principal components are depicted (Table 6.3)...180
Figure 6.3 Seasonal mean ± SE % FA biomarkers of total lipids of Carcharhinus leucas
(black bars represents dry season; white bars represents wet season). Significant
1 CHAPTER 1
2
The food web is one of the central and unifying concepts in ecology (Lindeman
1942; Martinez 1995) representing an integration of all ecological relationships within a
community (Elton 1927). The food web concept provides the framework to test and
quantify ecosystem processes such as population dynamics, predator - prey relationships,
feeding ecology, and responses to disturbance. Food webs are modeled on the unifying
theory of energy transfer (Lindeman 1942) which provides a mechanism for
characterizing the trophic interactions and exchanges within and between communities
(Odum 1968). As such, understanding the factors regulating food web structure is critical.
This is especially relevant in aquatic food webs, where species extinction rates are
increasing as a result of multiple anthropogenic stresses (Ricciardi and Rasmussen 1999;
Jackson et al. 2001).
DISTURBANCE
Periodic disturbances are a natural component of nearly all ecosystems and are
important determinants of community structure and dynamics (Sousa 1984; Pickett and
White 1985). A disturbance as defined by Pickett and White (1985) is a relatively
discrete event in time that disrupts community or population structure, and changes
resource availability or the nature of the physical environment.
Some ecological models predict that species mortalities as imposed by occasional
natural disturbances, such as fires, are integral components of most ecosystems and can
be vital for maintaining biological diversity as well as renewing essential nutrients
(Pickett and White 1985; Webster and Halpern 2010). However, many of these same
3
of the disturbance is too great (intermediate disturbance hypothesis; Connell 1978). In
aquatic systems, this is best illustrated by drought and storm events, where reductions in
species complexity i.e., decrease in diversity, in stream (Walters and Post 2011),
estuarine (Livingston et al. 1997; Greenwood et al. 2006; Baptista et al. 2010) and coastal
marine (Byrnes et al. 2011) communities have been documented to coincide with these
events. Understanding how such reductions in diversity impact community functioning is
critical for regulating anthropogenic-mediated effects of habitat degradation (Mora et al.
2007), urbanization (Marchetti et al. 2006), species invasions (Lodge 1993) and species
overexploitation (Pauly et al. 1998). This is especially relevant as climate change models
predict increased frequency and severity of many forms of large abiotic disturbances,
such as tropical storms (Easterling et al. 2000; Meehl et al. 2000). As such, simplification
of food webs is an expected consequence.
Recently, it has been argued that some of the most fundamental aspects behind the
persistence and functioning of complex systems may be manifested in their ability to
adapt in the face of disturbance (Levin 1998). McCann and Rooney (2009) argue that
temporal and spatial variability in food web structure and the ability of species to rapidly
respond to such variation are critical to the persistence of food webs. McCann (2007)
and McCann and Rooney (2009) advocate the empirical examination of food web
variability by evaluating how communities, specifically those with relatively consistent
species assemblages, respond and/or change across resource gradients in natural and
anthropogenic altered systems. Such evaluations will enable predictions regarding the
consequences of human modifications on the structure and functioning of ecosystems
4
premise of predicting species interactions and thereby understanding predator-prey
relationships. This permits the ability to determine the magnitude of energy available to a
consumer and also facilitates an understanding of the extent of resource exploitation that
may be influenced by disturbance events. The loss of individual species and subsequent
biodiversity is known to impact the functioning of both organisms and ecosystems
(Cardinale et al. 2006). Should natural or anthropogenic-mediated disturbance events
function similarly to alter species abundance and diversity, such changes can lead to
significant impairments to ecosystem structure and functioning (McCann and Rooney
2009). Given the increasing frequency of anthropogenic-mediated disturbances such as
species invasions, habitat loss and climate change, there is a need to understand how
species and ecosystems respond to such events (McCann 2000).
ESTUARIES: ECOLOGYAND IMPORTANCE
Cowardin et al. (1979) formally defined estuaries as “deep-water tidal habitats
and adjacent tidal wetlands which are usually semi-enclosed by land, but have open,
partially obstructed, or sporadic address to the open ocean and in which water is at least
occasionally diluted by freshwater runoff from the land.” As such, estuaries are thus
viewed as transition zones between terrestrial, and freshwater and marine aquatic systems
(Dardeu et al. 1992). This confluence of freshwater and marine aquatic environments
results in a wide spectrum of abiotic and biotic characteristics that influence estuarine
physical and biological community structure (Dardeu et al. 1992; Rush et al. 2010).
Consequently, estuaries are valued as highly productive environments that provide
5
including commercial and recreational fishes during one or more of their life history
stages (Beck et al. 2001). For example, a recent estimate of U.S. fisheries indicated that
approximately 46% of the commercial and 80% of the recreational fisheries harvests are
derived from the communities of Gulf Coast estuaries (Lellis-Dibble et al. 2008).
Estuaries, however, are among the most intensely modified ecosystems as a
consequence of extensive hydrological alteration, habitat alteration and chemical and
organic pollution (Lotze et al. 2006). Globally, there are few estuarine systems that
remain unaffected by upstream manipulation of their freshwater flow (Dynesius and
Nilsson 1994; Nilsson et al. 2005). River regulation by dams has fragmented hydrological
and ecological processes (Nilsson et al. 2005) often restricting or severing connectivity to
estuaries and coastal marine systems, as well as facilitating the introduction and
establishment of invasive species which can modulate flows of energy and nutrients
(Bunn and Arthington 2002). Such anthropogenic-mediated alterations can be detrimental
to downstream communities, as freshwater inflow from riverine sources provides
nutrients, sediment and organic matter essential for primary and secondary production in
these systems (Mallin et al. 1993; Chanton and Lewis 2002).
Anthropogenic-mediated alterations to freshwater flow indirectly affect the
physicochemical characteristics of the system by shifting the salinity and dissolved
oxygen gradients, and increasing turbidity, among other impacts (Sklar and Browder
1998; Gillson 2011). Predicting the response of estuaries to changing environmental
conditions is challenging, as it necessitates understanding interactions among several
trophic levels and among multiple nutrient sources (Rush et al. 2010). Many life-history
6
and Arthington 2002; Rehage and Trexler 2006). For example, larval stages of many
estuarine fishes are reliant on freshwater flow as a cue for migration into estuaries
(Strydom et al. 2002; Gillanders et al. 2011). Thus, disruption of this natural event affects
recruitment, and thus growth and mortality of these species (Purtlebaugh and Allen
2010). Consequently, the effects of altered flow on estuarine communities are expected to
be revealed not only by the presence or absence of certain species (Hofmann and Powell
1998) but also by changes in food web interactions (Akin et al. 2005).
STUDY SITES
The Charlotte Harbor Estuary is a large (~700 km2) relatively shallow estuary on
the southwest coast of Florida that serves as a forage and/or nursery area for more than
255 species of resident, migrant, recreational and commercial fishes of the Gulf of
Mexico (Poulakis et al. 2004), as well as to federally-protected species (e.g., manatees,
sea turtles and dolphins). The Caloosahatchee and Myakka Rivers (see Figure 2.1; details
on the study areas can be found in the following chapters) are major tributaries of
Charlotte Harbor Estuary. These rivers are subject to different anthropogenic influences,
regarding land-use development, shoreline modification and freshwater flow.
Specifically, the Myakka River has been subjected to relatively minor anthropogenic
modifications and experiences relatively natural flow regimes. In contrast, the artificial
connection of Lake Okeechobee to the Caloosahatchee River represents a unique
anthropogenic manipulation of riverine hydrology (Doering and Charmberlain 1998),
whereby substantial seasonal discharge from Lake Okeechobee occurs for flood control
7
Capece 1998). Accompanying these hydrologic changes is a decrease in water quality,
marked by increases in turbidity and nutrient loading, changes in water residence time in
the estuary, and alteration in the natural salinity gradient (Barnes 2005). These flow
characteristics of the Caloosahatchee and Myakka provide a unique opportunity to test
how disturbance, in the form of altered flow regimes, affects food webs and provides the
context by which this dissertation was developed.
DISSERTATION OBJECTIVES
The objective of this dissertation was to apply the principles and foundations of
community/food web ecology to understanding estuarine community response to
anthropogenically-altered freshwater flow disturbance. Patterns of community response
to flow variability were investigated in a framework that encompassed both temporal and
spatial scales and addressed changes in community characteristics associated with a
human-driven disturbance. Specifically, this dissertation investigates the effects of altered
freshwater flow on community structure and trophic interactions of estuarine
communities by comparing the Myakka and Caloosahatchee Rivers and their contrasting
flow regimes.
To investigate the effects of altered flow disturbance on estuarine communities, I
applied a combination of traditional community metrics with biochemical tracers to
demonstrate how altered vs. natural flow affect temporal estuarine community structure and function. Traditional metrics included estimates of species density, diversity,
richness, and evenness. The biochemical tracers included stable isotopes of carbon
(δ13C), nitrogen (δ15N) and sulfur (δ34
8
Application of biochemical tracers, especially stable isotopes and fatty acids, have
become increasingly prevalent for investigations of diet, trophic interactions and foraging
habitats (Peterson and Fry 1987; Iverson et al. 1997; Post et al. 2000; Rubenstein and
Hobson 2004) which has allowed for broad evaluation and inference regarding the
changing structure and function of food webs (Vander Zanden et al. 1999; Hebert et al.
2006). The stable isotope approach is based on the fact that the ratios of the stable
isotopes of nitrogen (15N/14N), carbon (13C/12C) and sulfur (34S/32S) in consumers’ tissues
reflect (1) isotopic composition of their dietary resources and (2) isotopic fractionation
during diet assimilation (DeNiro and Epstein 1978, 1981). Enrichment of isotopes within
tissues of a consumer over that of its diet arises as a result of the greater retention of the
heavier over the lighter isotope during the process of protein amination and deamination
for 15N and 34S, and respiration for 13C (DeNiro and Epstein 1978; 1981). This produces
ratios in a consumer’s tissues, between approximately 0 and 2‰ for δ13C and δ34S, and 2
and 5‰ for δ15
N, higher than those of its diet (DeNiro and Epstein 1981; Minagawa and
Wada 1984; Post 2002; Vanderklift and Ponsard 2003). Specifically, δ15
N values have
found application in determining the relative trophic position of a consumer (Minagawa
and Wada1984; Post 2002), and δ13C and δ34
S values have found application in
determining basal organic matter sources incorporated into a consumer’s diet (Peterson
and Fry 1987), species habitat use (Herzka 2005) and dependence on marine and/or
terrestrial/freshwater energy pathways (Simenstad and Wissmar 1985; Darnaude et al.
2004; McLeod and Wing 2009).
Fatty acids are the main constituents of many types of lipid and are required for
9
fatty acids that cannot be efficiently synthesized by consumers in amounts sufficient for
optimal growth and development, instead originate in primary producers and need to be
acquired through diet (Arts et al. 2001). The utility of fatty acids as biochemical tracers
of food web pathways stems from the fact that they are highly conserved during trophic
interactions (Iverson et al. 2004) and incorporated into consumers’ tissue in largely unmodified form (Falk-Peterson et al. 2002; Hall et al. 2006), thereby allowing
inferences to be made regarding consumer diet composition (Iverson et al. 2004; Hebert
et al. 2009). For example, the ratio of ω3/ω6 polyunsaturated fatty acids (PUFA) is a
useful indicator of the relative contribution of aquatic vs. terrestrial-derived resources in a consumers’ diet (Smith et al. 1996; Hebert et al. 2009).
OVERVIEWOF CHAPTERS
In Chapter 2 (Loss of seasonal variability in nekton community structure in a tidal
river: evidence for homogenization in a flow-altered system), I evaluated seasonal trends
(i.e., the transition of dry to wet season) of estuarine nekton trawl and seine assemblages
from the Myakka and Caloosahatchee estuaries, with the prediction that the these
estuaries would exhibit contrasting responses to the onset of the wet season, i.e., the
Caloosahatchee Estuary would exhibit loss in diversity, whereas the Myakka would
exhibit an increase. By comparing, nekton density, diversity, richness, and evenness
within and between estuaries, this chapter provides unique evidence regarding nekton
community response to altered high-flow. This chapter provides a baseline by which
hypotheses in subsequent chapters regarding effects of high-flow on the nekton
10
Stable isotope analysis has proven to be a powerful tool for the study of estuarine
food webs (Peterson and Fry 1987). Despite the prevalence of stable isotope analyses in
ecological studies of diet and food webs, there are still a number of confounding factors
that can complicate interpretations of stable isotope data and studies have recommended
establishing species-specific criteria for accurate isotopic assessment of an organism
(Sweeting et al. 2007). I tested assumptions regarding (1) tissue stable isotope values of
young individuals reflecting their current diet and (2) estuarine fishes exhibiting
ontogenetic or body-size based shifts in dietary resources. In this manner, Chapter 3 and
Chapter 4 allowed me to determine whether a species, sampled over variable time periods
and over a range of sizes, would be suitable for use in subsequent community analyses,
without confounding size-based effects.
In Chapter 3 (Maternal meddling in neonatal sharks: implications for interpreting
stable isotopes in young animals), I examined the relationships between several size
metrics and stable isotope values of δ13C and δ15N measured from muscle and liver
tissues of two species of placentatrophic shark to determine the length of time tissues of
young individuals are influenced by their mothers’ isotopic signal. This chapter provides
guidance regarding estimation of trophic position and characterization of carbon sources
and diet of young sharks using stable isotopes.
In Chapter 4 (Isotopic ratios reveal mixed seasonal variation among fishes from
two subtropical estuarine systems), I examined temporal and spatial relationships
between body size and δ15N, δ13C and δ34
S values for fish species across multiple trophic
levels, with the expectation that temporal variability would be manifested in changes to
δ13C and δ34S with season, and that δ15
11
supports previous observations in estuarine fishes regarding body size and in that context
allows for inclusion of estuarine fishes in subsequent food web analyses.
In Chapter 5 (Going with the flow: reduced inter-specific variability in stable
isotope ratios of nekton in response to altered high flow), I evaluated the effect of altered
high-flow on food web structure by comparing seasonal isotopic trends (δ13C, δ15N and
δ34
S) in consumer species sampled over four trophic levels in the Caloosahatchee and
Myakka estuaries. From the community perspective, I hypothesized that extreme high
flows would be most evident among lower trophic level species (i.e., primary and
secondary consumers). Specifically, we expected species sampled following the dry
season to be enriched in 13C and 34S relative to those sampled following the wet season,
reflecting a polyhaline estuarine status (i.e., tidally influenced). In contrast, those
sampled following the wet season would be depleted in 13C and 34S reflective of an
oligohaline estuarine status (i.e., terrestrial/freshwater influenced). Additionally, the
magnitude in the seasonal isotopic shifts would be expected to be greater in the
Caloosahatchee as opposed to the Myakka. This chapter demonstrates the effect that
altered high flow has on isotopic values of consumer species and in so doing,
demonstrates the effect on the overall food web structure, regarding relative trophic
position and carbon resources of estuarine consumers.
In Chapter 6 (Changes in resource exploitation by estuarine consumers in response to
altered high flow as inferred from fatty acid biomarkers), I used fatty acid biomarkers to
evaluate the main trophic pathways and relative importance of different energy sources to
the diet of estuarine consumers under different flow regimes. I hypothesized that the
12
important during the wet season than the dry season and would be especially evident
during extreme high flow. Fatty acid biomarkers and specific fatty acid ratios (i.e.,
ω3/ω6) indicative of marine vs. terrestrial/freshwater resource use were measured in
species that constitute several trophic guilds, sampled seasonally from both estuaries.
This chapter provides a novel application of fatty acid biomarkers to track altered flow
events in estuaries and provides a compliment to Chapter 5, for determining flow-related
changes to carbon source and energy pathways of estuarine consumers.
In light of escalating human water demand, urbanization, and climate change that
will ultimately lead to increased frequency of extreme flow events, in chapter 7, I
summarize the chapters presented here and discuss their contribution to understanding of
how altered flow effects estuarine nekton communities in the context of maintaining
structure and stability of these productive systems.
REFERENCES
Akin S., Buhan E., Winemiller K.O. & Yilmaz H. 2005. Fish assemblage structure of Koycegiz Lagoon-estuary, Turkey: Spatial and temporal distribution patterns in relation to environmental variation. Estuarine, Coastal and Shelf Science 64:671–684.
Arts M.T., Ackman R.G. & Holub B.J. 2001. ‘Essential fatty acids’ in aquatic ecosystems: a crucial link between diet and human health and evolution. Canadian Journal of Fisheries and Aquatic Sciences 58:122–137.
Arts M.T. 1999. Lipids in freshwater zooplankton: selected ecological and physiological aspects. In: Lipids in Freshwater Ecosystems (M.T. Arts and B.C. Wainman, Eds.). Springer Verlag, New York.
13
Beck M.W., Heck K.L., Able K.W., Childers D.L., Eggleston D.B., Gillanders B.M., Halpern B., Hays C.G., Hoshino K., Minello T.J., Orth R.J., Sheridan P.F. & Weinstein M.P. 2001. The identification, conservation and management of estuarine and marine nurseries for fish and invertebrates. Bioscience 51:633–641.
Bunn S.E. & Arthington A.H. 2002. Basic principles and ecological consequences of altered flow regimes for aquatic biodiversity. Environmental Management 30:492–507. Byrnes J.E., Reed D.C, Cardinale B.J., Cavanaugh K.C, Holbrook S.J. & Schmitt R.L. 2011. Climate-driven increases in storm frequency simplify kelp forest food webs.
Global Change Biology 17:2513–2524.
ecosystems. Nature 443:989–92.
Chanton J. & Lewis F.G. 2002. Examination of coupling between primary and secondary production in a river-dominated estuary: Apalachicola Bay, Florida, USA. Limnology and Oceanography 47:683–697.
Connell J.H. 1978. Diversity in tropical rain forests and coral reefs - high diversity of trees and corals in maintained only in a non-equilibrium state. Science 199:1302–1310. Cowardin L.M., Carter V., Golet F.C. & LaRoe E.T. 1979. Classification of wetlands and deepwater habitats of the United States. U. S. Department of the Interior, Fish and
Wildlife Service Office of Biological Services, Jamestown, ND. Technical Report: FWS/OBS/79-31:1–103.
Dardeu M.R., Modlin R.F., Schroeder W.W. & Stout J.P. 1992. Estuaries. In:
Biodiversity of the Southeastern United States: Aquatic Communities. (C.T. Hackney, S.M. Adams, and W.H. Martin, Eds.). pp. 614−744. John Wiley and Sons, Inc. New York, NY, USA.
Darnaude A.M., Salen-Picard C., Polunin N.V.C. & Harmelin-Vivien M.L. 2004. Trophodynamic linkages between river runoff and coastal fishery yield elucidated by stable isotope data in the Gulf of Lions (NW Mediterranean). Oecologia 138:325–332. DeNiro M.J. & Epstein S. 1978. Influence of diet on the distribution of carbon isotopes in animals. Geochimica et Cosmochimica Acta 42:495–506.
DeNiro M.J. & Epstein S. 1981. Influence of diet on the distribution of nitrogen isotopes in animals. Geochimica et Cosmochimica Acta 45:341–351.
14
Conference and Technical Symposium, Technical Report No. 98-02, Charlotte Harbor National Estuary Program, Punta Gorda, FL, pp. 229–240.
Dynesius M. & Nilsson C.1994. Fragmentation and flow regulation of river systems in the northern 3rd of the world. Science 266:753–762.
2000. Climate Extremes: Observations, Modeling, and Impacts. Science 289:2068–2074. Elton C. (1927). Animal Ecology. Sidgwick & Jackson, Ltd., London.
Falk-Petersen S., Haug T., Nilssen K.T., Wold A. & Dahl T.M. 2004. Lipids and trophic linkages in harp seal (Phoca groenlandica) from the eastern Barents Sea. Polar Research 23:43–50.
Flaig E.G. & Capece J. 1998. Water use and runoff in the Caloosahatchee watershed. In: Proceedings of the Charlotte Harbor Public Conference and Technical Symposium, Technical Report No. 98-02, Charlotte Harbor National Estuary Program, Punta Gorda, FL, pp. 73–80.
Gillson J. 2011. Freshwater flow and fisheries production in estuarine and coastal systems: Where a drop of rain is not lost. Reviews in Fisheries Science 19:168–186. Gillanders B.M., Elsdon T.S., Halliday I.A., Jenkins G.P., Robins J.B. & Valesini F.J. 2011. Potential effects of climate change on Australian estuaries and fish utilizing estuaries: a review. Marine and Freshwater Research 62:1115–1131.
Greenwood M.F.D., Stevens P.W. & Matheson R.E. 2006. Effects of the 2004 Hurricanes on the fish assemblages in two proximate southwest Florida estuaries: Changes in the context of inter-annual variability. Estuaries and Coasts 29:985–996.
Hall D., Lee S.Y. & Mezaine T. 2006. Fatty acids as trophic tracers in an experimental estuarine food chain: tracer transfer. Journal of Experimental Marine Biology and Ecology 336:42–53.
tracers reveal intra-specific differences in the food webs utilized by individual seabirds.
Hebert C.E., Arts M.T. & Weseloh D.V.C. 2006. Ecological tracers can quantify food web structure and change. Environmental Science and Technology 40:5618–5623.
Herzka S.Z. 2005. Assessing connectivity of estuarine fishes based on stable isotope ratio analysis. Estuarine, Coastal and Shelf Science 64:58–69.
15
Iverson S.J., Field C., Bowen W.D. & Blanchard W. 2004. Quantitative fatty acid signature analysis: a new method of estimating predator diets. Ecological Monographs
74:211–235.
Iverson S.J., Frost K.J. & Lowry L.L. 1997. Fatty acid signatures reveal fine scale structure of foraging distribution of harbor seals and their prey in Prince William Sound, Alaska. Marine Ecology Progress Series 151:255–271.
Jackson J.B.C., Kirby M.X., Bereger K., Bjorndal K.A., Botsford L.W., Bourque B.J., Bradbury R.H., Cooke R., Erlandson J., Estes J.A., Hughes T.P., Kidwell S., Lange C.B., Lenihan H.S., Pandolfi J.M., Peterson C.H., Steneck R.S., Tegner M.J. & Warner R.R. 2001. Historical overfishing and the recent collapse of coastal ecosystems. Science 27: 629–637.
Lellis-Dibble K.A., McGlynn K.E. & Bigford T.E. 2008. Estuarine Fish and Shellfish Species in U.S. Commercial and Recreational Fisheries: Economic Value as an Incentive to Protect and Restore Estuarine Habitat. U.S. Dept. Commerce, NOAA Tech. Memo. NMFSF/SPO-90, 94 p.
Levin S.A. 1998. Ecosystems and the biosphere as complex adaptive systems.
Ecosystems 1:431–436.
Lindeman R.L. 1942. The trophic-dynamic aspect of ecology. Ecology 23:399–417. Livingston R.J., Niu X., Lewis G. & Woodsum G.C. 1997. Freshwater input to a gulf estuary: long-term control of trophic organization. Ecological Applications 7:277–299. Lodge D.M. 1993. Species invasions and deletions. In: Biotic Interactions and Global Change (P.M. Kareiva, J.G. Kingsolver and R.B. Hney, Eds.), pp. 367–387. Sunderland, Massachusetts.
S.M., Kirby M.X., Peterson C.H. & Jackson J.B.C. 2006. Depletion, degradation, and recovery potential of estuaries and coastal seas. Science 312:1806–1809.
Mallin M.A., Paerl H.W., Rudek J. & Bates P.W. 1993. Regulation of primary production by watershed rainfall and river flow. Marine Ecology Progress Series 93:199–203.
Marchetti M.P., Lockwood J.L. & Light T. 2006. Effects of urbanization on California’s fish diversity: Differentiation, homogenization and the influence of spatial scale.
Biological Conservation 127:310–318.
16
Meehl G.A., Zwiers F., Evans J., Knutson T., Mearns L. & Whetton P. 2000. Trends in extreme weather and climate events: issues related to modeling extremes in projections of future climate change. Bulletin of the American Meteorological Society 81:427–436. McCann K.S. & Rooney N. 2009. The more food webs change, the more they stay the same. Philosophical Transactions of the Royal Society B 364:1789–1801.
McCann K.S. 2007. Protecting biostructure. Nature 446:29.
McCann K.S. 2000. The diversity-stability debate. Nature 405:228–233.
McLeod R.J. & Wing S.R. 2009. Strong pathways for incorporation of terrestrially derived organic matter into benthic communities. Estuarine, Coastal and Shelf Science
82:645–653.
Minagawa M. & Wada E. 1984. Stepwise enrichment of 15N along food chains: further evidence and the relation between δ15
N and animal age Geochimica et Cosmochimica Acta 48:1135–1140.
Mora C., Metzker R., Rollo A. & Myers R.A. 2007. Experimental simulations about the effects of habitat fragmentation and overexploitation on populations facing
environmental warming. Proceedings of the Royal Society B 274:1023–1028. Nilsson C., Reidy C.A, Dynesius M. & Revenga C. 2005. Fragmentation and flow regulation of the world’s large river systems. Science 308:405–408.
Odum E.P. 1968. Energy flow in ecosystems: A historical review. American Zoologist 8: 11–18.
Pauly D., Christensen V., Dalsgaard J., Froese R. & Torres F. 1998. Fishing down marine food webs. Science 279:860–863.
Peterson B.J. & Fry B. 1987. Stable isotopes in ecosystem studies. Annual Review of Ecology, Evolution and Systematics 18:293–320.
Pickett S.T.A. & White P.S. 1985. Patch dynamics: a synthesis. In: The ecology of natural disturbance and patch dynamics (S.T.A. Pickett and P.S. White, Eds.), pp. 371– 384. Academic Press, New York.
Post D.M. 2002. Using stable isotopes to estimate trophic position: models, methods and assumptions. Ecology 83:703–718.
17
Poulakis G.R., Matheson R.E., Mitchell M.E., Blewett D.A. & Idelberger C.F. 2004. Fishes of the Charlotte Harbor estuarine system, Florida. Gulf of Mexico Science 2:117– 150.
Purtlebaugh C.H. & Allen M.S. 2010. Relative Abundance, Growth, and Mortality of Five Age-0 Estuarine Fishes in Relation to Discharge of the Suwannee River, Florida.
Transactions of the American Fisheries Society 139:1233–1246.
Rehage J.S. & Trexler J.C. 2006. Assessing the net effect of anthropogenic disturbance on aquatic communities in wetlands: community structure relative to distance from canals. Hydrobiologia 569:359–373.
Ricciardi A. & Rasmussen J.B. 1999. Extinction rates of North American freshwater fauna. Conservation Biology 13:1220–1222.
Rubenstein D.R. & Hobson K.A. 2004. From birds to butterflies: animal movement patterns and stable isotopes. Trends in Ecology and Evolution 19:256–263.
Rush S.A., Olin J.A., Fisk A.T., Woodrey M.S. & Cooper R.J. 2010. Trophic
relationships of a marsh bird differ between Gulf Coast estuaries. Estuaries and Coasts
33: 963–970.
Simenstad C.A. & Wissmar R.C. 1985. δ13
C evidence of the origins and fates of organic carbon in estuarine and nearshore food webs. Marine Ecology Progress Series 22:141– 152.
Sklar F.H. &Browder J.A. 1998. Coastal environmental impacts brought about by alterations to freshwater flow in the Gulf of Mexico. Environmental Management
22:547–562.
Smith R.J., Hobson K.A., Koopman H.N. & Lavigne D.M. 1996. Distinguishing between populations of fresh- and salt-water harbor seals (Phoca vitulina) using stable isotope ratios and fatty acids profiles. Canadian Journal of Fisheries and Aquatic Sciences
53:272–279.
Sousa W.P. 1984. The role of disturbance in natural communities. Annual Review of Ecology and Systematics 15:353–391.
Strydom N.A., Whitfield A.K. & Paterson A.W. 2002. Influence of altered freshwater flow regimes on abundance of larval and juvenile Gilchristella aestuaria (Pisces: Clupeidae) in the upper reaches of two South African estuaries. Marine and Freshwater Research 53:431–438.
18
Vanderklift M.A. & Ponsard S. 2003. Sources of variation in consumer-diet δ15N enrichment: A meta-analysis. Oecologia 136:169–182.
Vander Zanden M.J., Shuter B.J., Lester N. & Rasmussen J.B. 1999. Patterns of food chain length in lakes: a stable isotope study. The American Naturalist 154:406–416. Walters A.W. & Post D.M. 2011. How low can you go? Impacts of low-flow disturbance on aquatic insect communities. Ecological Applications 21:163–174.
19 CHAPTER 2
LOSS OF SEASONAL VARIABILITY IN NEKTON COMMUNITY STRUCTURE IN A
TIDAL RIVER: EVIDENCE FOR HOMOGENIZATION IN A FLOW-ALTERED SYSTEM*
*
Olin JA, Stevens PW, Rush SA, Hussey NE, Fisk AT. Loss of seasonal variability in nekton community structure in a tidal river: evidence for homogenization in flow-altered system.
20
INTRODUCTION
Extensive fragmentation of riverine systems by dams, and associated
modifications to fluvial processes (e.g., flux of water, nutrients and sediment) represent a
pervasive alteration of the landscape (Nilsson et al. 2005; Poff et al. 2007). These human
modifications, which alter the timing and magnitude of freshwater flow, have led to
unprecedented changes in natural seasonal and inter-annual hydrologic connectivity,
reducing the natural seasonal variability in flow regimes (Poff et al. 2007). This
disturbance to natural flow dynamics poses a significant threat to riverine and
downstream estuarine and coastal community composition and biodiversity, and as a
consequence, compromises the overall structure and function of these important
ecosystems (Rozas et al. 2005; Poff and Zimmerman 2010; Carlisle et al. 2011).
Freshwater flow is known to be an important factor structuring nekton
communities of estuarine reaches within tidal rivers (Peterson and Ross 1991; Sklar and
Browder 1998), with the nekton assemblages changing most rapidly at the
oligohaline-mesohaline boundary (Greenwood et al. 2007). Because many estuarine species have
evolved life history strategies in response to natural seasonal flow regimes (Bunn and
Arthington 2002; Lytle and Poff 2004), alterations to the magnitude and timing of flow
can be detrimental (Drinkwater and Frank 1994; Gillson 2011). For example, a reduction
in species growth rates (Edeline et al. 2005; Rypel and Layman 2008) and recruitment
dynamics (Jenkins et al. 2010), and changes to the overall structure of estuarine food
webs (Adams et al. 2009) have been documented in response to altered flow regimes.
Periodic disturbances are a natural component of nearly all ecosystems and are
21
and White 1985). However, extreme events where the frequency or severity of the
disturbance becomes too great result in a decrease in species diversity (Connell 1978).
This is best illustrated by drought and storm events in aquatic systems, where a reduction
in complexity (i.e., decreases in diversity and abundance) in stream (Walters and Post
2011), estuarine (Livingston et al. 1997; Greenwood et al. 2006; Baptista et al. 2010) and
coastal marine (Byrnes et al. 2011) communities have been documented. More
specifically in estuarine environments, a decrease in the diversity of estuarine resident,
and marine nekton and macrofaunal species, have been associated with prolonged periods
of freshwater inflow resulting from human alteration (Rutger and Wing 2006; McLeod
and Wing 2008). As well, Chamberlain and Doering (1998) indicated that seagrasses,
oyster beds, juvenile fish abundance, and richness decreased, partly in response to rapidly
changing salinities and sediment loads as a result of heavy freshwater flows. The
consequences of altered flow for the complexity of estuarine communities however, can
be unpredictable. For example, Kimmerer (2002) observed that lower trophic levels (i.e.,
plankton) negatively responded to high flow (i.e., decreased abundance), whereas higher
trophic level (i.e., fishes) responded positively to flow (i.e., increased abundance).
Nevertheless, reduced species diversity and abundance following extreme disturbance
events have the potential to destabilize food webs (McCann et al. 1998; Rooney et al.
2006).
Contention over flow regime management arises not only from competition
among water uses, but also from the difficulty of specifying flow requirements, i.e.,
management measures, that will maintain ecological integrity in aquatic systems
22
examining how changes in assemblage structure influence food web function, a study of
which can aid the development of key management and restoration strategies (Cross et al.
2011). Understanding the biotic response to altered flow regimes is required to
effectively manage aquatic ecosystems and is critical in estuarine systems, as escalating
human water demand, urbanization, and climate change will ultimately lead to increased
frequency of extreme flow events (Vörösmarty et al. 2000). To address this question, we
sampled nekton assemblages of two tidal rivers in the Charlotte Harbor Estuary, Florida;
one that has undergone major human development and experiences altered flow regimes,
and one that is relatively natural. By comparing the seasonal nekton assemblage trends in
these two systems, this study aimed to determine the response of estuarine nekton
communities to altered flows, specifically anthropogenic-induced high flows. Because
periods of moderate flow have resulted in the highest abundance of species (Idelberger
and Greenwood 2005; Cross et al. 2011), we predict the natural estuary would exhibit an
increase in nekton density and diversity with the seasonal progression of dry to wet
conditions. Additionally, we predict that species composition would reflect the conditions
of the estuary, i.e., dry and wet seasons. For example, density and diversity of freshwater
species would increase during the wet season, whereas the opposite trend would be
observed in marine species. In contrast, within the altered estuary we predicted that
extreme high flows would negatively disturb the nekton community, whereby the density
and diversity would decrease with the seasonal progression of dry to wet conditions. As
physicochemical conditions (i.e., salinity, temperature) have been demonstrated to be
important determinants of spatial and temporal fish assemblage structure (Akin et al.
23
disturbance would largely be evidenced in a decrease in marine and less tolerant estuarine
species.
MATERIALS AND METHODS
The Caloosahatchee River (26°30' N, 81°54' W) is a major tributary of Charlotte
Harbor Estuary, a large (~700 km2) relatively shallow estuary on the southwest coast of
Florida, USA (Fig. 2.1). The artificial connection of Lake Okeechobee to the
Caloosahatchee River represents a unique anthropogenic manipulation of hydrology
(Doering and Charmberlain 1998), whereby substantial seasonal discharge from Lake
Okeechobee occurs for flood control and water supply, as well as to flush algal blooms
and salt water intrusion (Flaig and Capece 1998). Major modifications to the hydrology,
along with land-use transformations and dredging for navigation (e.g., ~70% of shoreline
is hardened with seawalls and rip-rap) have resulted in large-scale alterations within the
estuary (Barnes 2005). The volume of the Caloosahatchee estuary is approximately 105 x
106 m3, while the median annual discharge is 870 x 106 m3 (Flaig and Capece 1998).
During periods of low freshwater discharge (i.e., during winter/spring months), salt water
regularly intrudes to S-79, the most downstream water control structure, often exceeding
10‰ (Fig. 2.1). High freshwater discharge (i.e., during summer/fall months) can cause
salinity to drop below 5‰ at the mouth and the transition between the two states can be
rapid, sometimes occurring in less than a week (Doering et al. 2002). These fluctuations
observed at the head and mouth of the estuary, exceed the salinity tolerances of most
oligohaline and marine species (Barnes 2005). These alterations to flow patterns of the
24
Everglades Restoration Plan, thereby creating an ideal system to document the effects of
altered flow on community dynamics (RECOVER 2008).
Trends in abundances of nekton can be influenced by myriad factors, including
recruitment and/or stochastic climactic events (Greenwood et al. 2007a). To minimize variability associated with these factors, we chose the Myakka River (82°12' W, 26°57'
N) for comparison with the Caloosahatchee, as it is proximately located (< 100 km; Fig.
2.1) and therefore is accessible to fishes of Charlotte Harbor. Additionally, the Myakka
estuary experiences relatively natural flow periods and it’s shoreline has been subjected
to relatively minor anthropogenic modification (i.e., ~40% of shoreline area is hardened;
estimated from 2007 Digital Ortho Quad County Mosaic, USDA, Geospatial Data
Gateway in ArcGIS (ESRI ArcGIS version 9)). The natural shoreline areas of the
Myakka estuary are characterized by mangroves and saltmarsh, principally R. mangle,
black mangrove Avicennia germinans, saltmarsh cordgrass Spartina alterniflora and black needlerush Juncus roemerianus. Based on similar trends in fish and macrofaunal abundance among proximate estuaries in Chesapeake Bay (Kraus and Secor 2004), and
among three river-estuaries along the Texas coast (Palmer et al. 2011), the Myakka
provides a control by which comparisons of nekton community dynamics to the
Caloosahatchee can be made.
Nekton community composition
Data on nekton assemblages in the Myakka and Caloosahatchee estuaries were
obtained from a long-term fisheries-independent monitoring (FIM) program in the
25
was conducted in the estuarine reaches of the Myakka and Caloosahatchee rivers using a
6.1-m trawl (38-mm stretch mesh, 3.2-mm stretch mesh liner) and using a 21.3 m seine
(3.2-mm stretch-mesh, center-bag). Sampling locations were chosen randomly each
month from all possible sites that contained adequate depth for trawling (1.8–7.6 m) and
seining (0.3–1.8 m). The sampling effort implemented within the areas used in this study
were 3 trawls and 4 seines/month for the Myakka and 4-5 trawls and 10-12 seines/ month
for the Caloosahatchee. The trawl was towed for 5 minutes at 0.6 m•s-1, providing a tow
length of ~180 m. Trawl width averaged ~4 m, providing an approximate area of 720 m2
sampled by a typical tow. The seine was deployed from a boat in a shallow arc parallel to
shore and hauled directly along the shoreline. The two ends of the seine were pulled
together, sampling an area of ~68 m2.
During each sampling event, environmental parameters—including temperature
(°C), salinity (ppt) and dissolved oxygen (mgl−1)—were profiled with a Hydrolab water
quality datasonde (measurements taken at 0.2 m, 1.0 m if applicable, and at the bottom).
Fishes and select invertebrates collected during each sample event were identified to the
lowest practical taxonomic level (nomenclature for fishes follows Nelson et al. 2004),
measured (standard length (SL) for fishes and carapace width (CW) for crabs), counted
and released. Representative subsamples of organisms were retained for laboratory
verification. For specific details on site selection and sampling technique refer to
Idelberger and Greenwood (2005) and Idelberger et al. (2011).
Each sampled species was categorized into an ecological guild according to Elliot