ABSTRACT
HARKEY, DAVID LEE. Effect of Intersection Angle on the Safety of Intersections. (Under the direction of Dr. Joseph E. Hummer.)
The preferred design for intersections includes adjacent legs that intersect at 90 degrees. However, there are occasions where physical constraints result in intersection angles less than 90 degrees, and thus produce skewed intersections. Such intersections create
potential safety and operational problems for both motorists and non-motorists. To date, the research on such issues has been limited, which may explain the lack of consensus among the policies and guidance that now exists in practice.
The objective of this study was to derive quantitative relationships between intersection angle and safety, where safety is defined by intersection crashes. The
relationships were used to 1) determine appropriate crash modification factors for reducing or eliminating the skew angle of an intersection, 2) determine if there is a critical minimum angle at which safety is substantially diminished, and 3) assess the need for revision of current geometric design policies and practices.
The data for this research were acquired from the Federal Highway Administration Highway Safety Information System and the Minnesota Department of Transportation. A supplemental data collection effort was undertaken to acquire additional key variables, including all measured angles at each intersection. The final database of minor leg stop-control intersections included 1,669 4-leg locations and 1,109 3-leg locations. The numbers of crashes included in the analysis over a 7-year period were 8,482 and 4,746 for 4-leg and 3-leg intersections, respectively.
Effect of Intersection Angle on the Safety of Intersections
by
David Lee Harkey
A dissertation submitted to the Graduate Faculty of North Carolina State University
in partial fulfillment of the requirements for the Degree of
Doctor of Philosophy
Civil Engineering
Raleigh, North Carolina
2013
APPROVED BY:
Dr. Nagui M. Rouphail Dr. Billy M. Williams
Dr. Joseph E. Hummer Dr. John R. Stone
DEDICATION
To my loving family – Chris, Kip, and Kendall – for your unwavering support, incredible patience, and everlasting love on this long and winding road
BIOGRAPHY
David Harkey has over 25 years of experience in the field of transportation safety research. His current research focus is on applying transportation engineering principles and research evaluation methodologies to improve highway safety for motorists, pedestrians, and bicyclists in the areas of traffic operations, geometric design, and roadside design. Mr. Harkey has conducted studies for the U.S. Department of Transportation, The National Academies, and Insurance Institute for Highway Safety, as well as several State Departments of Transportation. He has managed more than 30 major research projects and authored over 75 articles and research reports.
Mr. Harkey is a graduate of the University of North Carolina at Charlotte where he earned a Bachelor of Science in Civil Engineering and a Master of Science in Engineering. He is a member of the Tau Beta Pi engineering honor society. Mr. Harkey is a registered Professional Engineer in North Carolina.
Mr. Harkey is actively involved in several transportation research and road safety organizations. He is a member of the Transportation Research Board (TRB) of The National Academies and currently serves as chair of the Safety Section of the TRB Safety and
Systems Users Group. He is also a past chair of the TRB Committee on Safety Data, Analysis and Evaluation. He is a member of the Executive Board of the Association of Transportation Safety Information Professionals. He is also a member of the Institute of Transportation Engineers.
Mr. Harkey currently serves as director of the Highway Safety Research Center (HSRC) at The University of North Carolina at Chapel Hill. In his 20 years at HSRC, he also served as associate director for operations, manager of engineering studies, and senior
research engineer. Prior to joining HSRC, he worked for 8 years with The Scientex
ACKNOWLEDGEMENTS
I want to begin by thanking the members of my committee. I have known these gentlemen for a very long time and consider them friends and colleagues as well as great mentors. Thank you to my committee chair, Dr. Joe Hummer, for his advice, guidance, and feedback throughout this lengthy process. Thank you to Dr. Nagui Rouphail and Dr. Billy Williams for your encouragement, especially over the past couple years. Thank you to Dr. John Stone, whose willingness to step in and be part of my committee during the last year will forever be appreciated.
I also want to express my gratitude to several staff at The University of North
Carolina Highway Safety Research Center, otherwise known as my work family. Thank you to Dr. Bo Lan, Mr. Daniel Carter, Dr. Raghavan Srinivasan, and Dr. Forrest Council for your assistance and consultation on this research effort.
Special thanks also goes to several colleagues who were instrumental in the data acquisition phase of this research. Thank you to Yusuf Mohamedshah and Anushapatel Nujjetty of LENDIS Corporation for your efforts to assemble and provide the HSIS and GIS data for the research. Thank you to Nrupen Mandava and Kallem Reddy for your work on the supplemental data collection task. Thank you to Brad Estochen of the Minnesota Department of Transportation for your assistance with numerous aspects of this project.
Finally, I want to thank all of those persons who encouraged, badgered, reminded, and nagged me to complete this journey. The number of individuals in this category is long. However, there are several that deserve special credit for never missing an opportunity to remind me – Tony Waldrop, Rick Pain, Don Reinfurt, Jo Anne Earp, and Charlie Zegeer. Thank you!
TABLE OF CONTENTS
LIST OF TABLES ... vii
LIST OF FIGURES ... xii
LIST OF ABBREVIATIONS ... xvi
CHAPTER 1. INTRODUCTION ... 1
1.1 Background ...1
1.2 Magnitude of the Problem ...2
1.3 Objectives and Scope ...6
1.4 Organization of the Dissertation ...7
CHAPTER 2. LITERATURE REVIEW ... 8
2.1 Current Design Guidance ...8
2.2 Safety Research ...12
2.3 Summary ...20
CHAPTER 3. METHODOLOGY AND APPROACH ... 21
3.1 Analysis Approach ...21
3.2 Evolution of Road Safety Model Development ...22
3.3 Variable Selection via Data Mining ...33
3.4 Safety Prediction Model Development ...37
3.5 Crash Modification Factors Derivation ...38
3.6 Summary ...38
CHAPTER 4. DATA ACQUISITION AND PREPARATION ... 39
4.1 Data Source and Assessment ...39
4.2 HSIS Data Acquisition ...42
4.3 Supplemental Geometric Data Collection ...45
4.4 Data Preparation...54
4.5 Data Description ...55
CHAPTER 5. ANALYSIS AND INTERPRETATION OF RESULTS ... 64
5.2 Safety Prediction Models ...74
5.3 Development of Crash Modification Factors and Functions ...97
5.4 Critical Angle Assessment ...112
5.5 Comparison of Results to Prior Crash Modification Factors ...113
CHAPTER 6. SUMMARY AND CONCLUSIONS ... 119
6.1 Summary ...119
6.2 Research Conclusions ...121
6.3 Methodology Conclusions ...123
CHAPTER 7. FUTURE RESEARCH ... 125
REFERENCES ... 127
APPENDICES ... 137
APPENDIX A. HSIS DATA VARIABLES ... 138
APPENDIX B. SUPPLEMENTAL DATA COLLECTION ISSUES ... 146
APPENDIX C. DATA TABLES ... 152
APPENDIX D. DATA MINING RESULTS ... 165
APPENDIX E. SUPPLEMENTAL SAFETY PREDICTION MODELS ...181
LIST OF TABLES
Table 1. Number of Minnesota Intersections by Traffic Control Type and Skew
Classification (2008 Data). ... 40
Table 2. Number of Crashes by Intersection Type for the First and Last Years
(1999 and 2008) of the Potential Analysis Period. ... 41
Table 3. Number of Crashes per Intersection by Intersection Type for the First and Last Years (1999 and 2008) of the Potential Analysis Period. ... 41
Table 4. Number of Minor Leg Stop-Control Intersections without Changes in the
Skew/Non-skew Attributes over Time (1999 – 2008). ... 42
Table 5. Distribution of 4-Leg Intersections by Angle Classification and Area Type. ... 56
Table 6. Distribution of 3-Leg Intersections by Angle Classification and Area Type. ... 56
Table 7. Distribution of 4-Leg Intersections by Intersection Angle Category
and Area Type. ... 57
Table 8. Distribution of 3-Leg Intersections by Intersection Angle Category
and Area Type. ... 57
Table 9. Distribution of Skewed Intersections by Intersection Angle for 4-Leg and 3-Leg Intersections ...58
Table 10. Distribution of Total Crashes at 4-Leg Intersections by Intersection
Angle Category and Area Type. ... 59
Table 11. Distribution of Total Crashes at 3-Leg Intersections by Intersection Angle
Category and Area Type. ... 60
Table 12. Range of Intersection AADT for 4-Leg Intersections by Intersection
Angle and Area Type. ... 61
Table 13. Range of Intersection AADT for 3-Leg Intersections by Intersection
Angle and Area Type. ... 61
Table 14. Analysis Framework – Summary of Crashes by Collision Severity
and Intersection Classification in the Final Database. ... 64
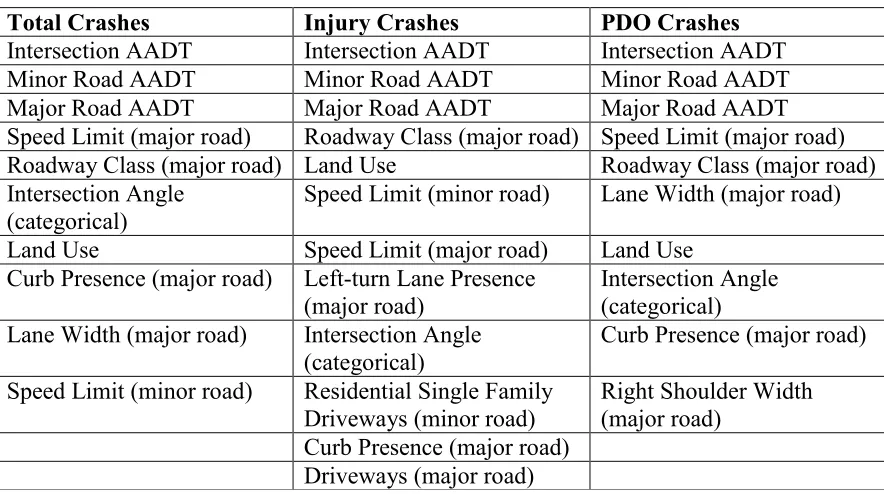
Table 15. Most Important Predictor Variables for 4-leg intersections
Table 16. Most Important Predictor Variables for 3-leg intersections
(Results from cforest Analysis). ... 71
Table 17. General Guidance for Interpretation of Models Using AIC and BIC Criteria. ... 76
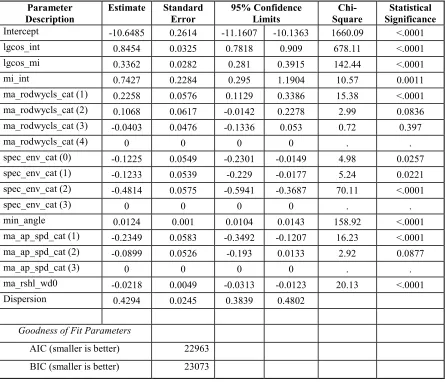
Table 18. Initial Base Model Results for Total Crashes at All 4-Leg Intersections. ... 78
Table 19. Alternative Base Model Results for Total Crashes at All 4-Leg Intersections. ... 79
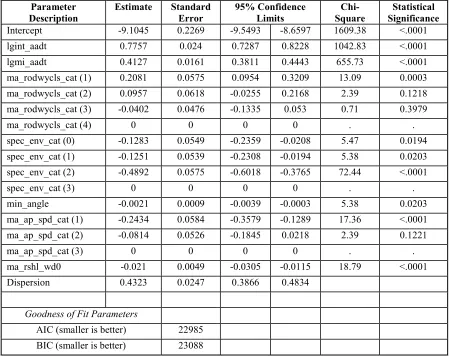
Table 20. Flexible Form Model 1 Results for Total Crashes at All 4-Leg Intersections. ... 84
Table 21. Flexible Form Model 2 Results for Total Crashes at All 4-Leg Intersections. ... 85
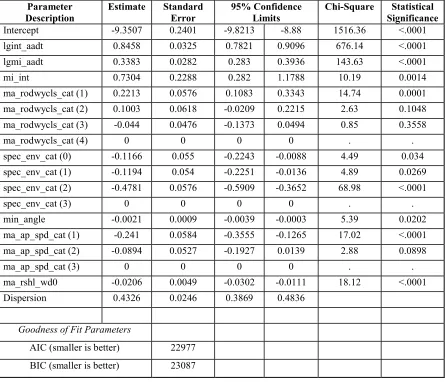
Table 22. Interaction Model Results for Total Crashes at All 4-Leg Intersections. ... 87
Table 23. Initial Base Model Results for Total Crashes at All 3-Leg Intersections. ... 90
Table 24. Alternative Base Model Results for Total Crashes at All 3-Leg Intersections. ... 91
Table 25. Flexible Form Model 1 Results for Total Crashes at All 3-Leg Intersections. ... 94
Table 26. Flexible Form Model 2 Results for Total Crashes at All 3-Leg Intersections. ... 95
Table 27. Interaction Model Results for Total Crashes at All 3-Leg Intersections. ... 96
Table 28. Crash Modification Functions Derived by NB Model Form. ... 110
Table 29. CMF Values Derived From the Flexible Form Model for 4-Leg Intersections. .. 112
Table 30. Recommended Crash Modification Functions for 4-Leg and 3-Leg Intersections (Minor Leg Stop-Control). ... 122
Table 31. List of Variables Available from the HSIS Minnesota Crash File. ... 139
Table 32. List of Variables Available from the HSIS Minnesota Roadlog File. ... 141
Table 33. List of Variables Available from the HSIS Minnesota Intersection File. ... 144
Table 34. 4-Leg Intersections by Angle Classification and Area Type. ... 153
Table 35. Total Crashes (2003-2009) at 4-Leg Intersections by Angle Classification and Area Type. ... 153
Table 37. Total Crashes (2003-2009) at 4-Leg Intersections by Intersection Angle
and Area Type. ... 154
Table 38. Injury (including Fatal) Crashes (2003-2009) at 4-Leg Intersections by
Intersection Angle and Area Type. ... 154
Table 39. Property-Damage-Only Crashes (2003-2009) at 4-Leg Intersections by
Intersection Angle and Area Type. ... 155
Table 40. Intersection AADT for 4-Leg Intersections by Intersection Angle
and Area Type. ... 155
Table 41. Minor Road AADT for 4-Leg Intersections by Intersection Angle
and Area Type. ... 156
Table 42. Major Road AADT for 4-Leg Intersections by Intersection Angle
and Area Type. ... 156
Table 43. Total Crash Rates (per 100M Entering Vehicles) for 4-Leg Intersections by
Intersection Angle and Area Type. ... 157
Table 44. Injury (including Fatal) Crash Rates (per 100M Entering Vehicles) for 4-Leg Intersections by Intersection Angle and Area Type. ... 157
Table 45. Property-Damage-Only Crash Rates (per 100M Entering Vehicles) for 4-Leg Intersections by Intersection Angle and Area Type. ... 158
Table 46. 3-Leg Intersections by Angle Classification and Area Type. ... 159
Table 47. Total Crashes (2003-2009) at 3-Leg Intersections by Angle Classification
and Area Type. ... 159
Table 48. 3-Leg Intersections by Intersection Angle and Area Type. ... 159
Table 49. Total Crashes (2003-2009) at 3-Leg Intersections by Intersection Angle
and Area Type. ... 160
Table 50. Injury (including Fatal) Crashes (2003-2009) at 3-Leg Intersections by
Intersection Angle and Area Type. ... 160
Table 51. Property-Damage-Only Crashes (2003-2009) at 3-Leg Intersections by
Intersection Angle and Area Type. ... 161
Table 52. Intersection AADT for 3-Leg Intersections by Intersection Angle
Table 53. Minor Road AADT for 3-Leg Intersections by Intersection Angle
and Area Type. ... 162
Table 54. Major Road AADT for 3-Leg Intersections by Intersection Angle and Area Type. ... 162
Table 55. Total Crash Rates (per 100M Entering Vehicles) for 3-Leg Intersections by Intersection Angle and Area Type. ... 163
Table 56. Injury (including Fatal) Crash Rates (per 100M Entering Vehicles) for 3-Leg Intersections by Intersection Angle and Area Type. ... 163
Table 57. Property-Damage-Only Crash Rates (per 100M Entering Vehicles) for 3-Leg Intersections by Intersection Angle and Area Type. ... 164
Table 58. Variable Names, Descriptors, Definitions, and Attributes. ... 166
Table 59. Summary of Models Included in Appendix E. ... 181
Table 60. Flexible Form Model Results for Injury Crashes at All 4-Leg Intersections. ... 182
Table 61. Initial Base Model Results for PDO Crashes at All 4-Leg Intersections. ... 183
Table 62 . Alternative Base Model Results for PDO Crashes at All 4-Leg Intersections. ... 184
Table 63. Flexible Form Model Results for PDO Crashes at All 4-Leg Intersections. ... 185
Table 64. Interaction Model Results for PDO Crashes at All 4-Leg Intersections... 186
Table 65. Initial Base Model Results for Total Crashes at Rural 4-Leg Intersections. ... 187
Table 66. Alternative Base Model Results for Total Crashes at Rural 4-Leg Intersections. ... 188
Table 67. Flexible Form Model Results for Total Crashes at Rural 4-Leg Intersections. ... 189
Table 68. Interaction Model Results for Total Crashes at Rural 4-Leg Intersections. ... 190
Table 69. Initial Base Model Results for PDO Crashes at Rural 4-Leg Intersections. ... 191
Table 71. Flexible Form Model Results for PDO Crashes at Rural 4-Leg
Intersections. ... 193
Table 72. Interaction Model Results for Total Crashes at Rural 3-Leg Intersections. ... 194
LIST OF FIGURES
Figure 1. Percentage of Fatal Crashes in the U.S. by Location. ... 3
Figure 2. Percentage of Total Crashes in the U.S. by Location. ... 3
Figure 3. Percentage of Minnesota Intersections by Number of Legs and
Angle Classification (2008). ... 4
Figure 4. Percentage of Minnesota Intersection Crashes by Number of Legs and Angle Classification (2008). ... 5
Figure 5. Example of a Cumulative Residual Plot (Hauer, 2004). ... 32
Figure 6. Example of a Cumulative Residual Plot with + 2 Bands (Hauer, 2004). ... 33
Figure 7. Measured Intersection Angle with the ArcGIS COGO Tool and a
50-foot radius (67 degrees). ... 49
Figure 8. Measured Intersection Angle with the ArcGIS COGO Tool and a
100-foot radius (62 degrees). ... 49
Figure 9. Google Maps High-Quality Satellite Image for a Study Intersection. ... 50
Figure 10. Google Maps Lower-Quality Satellite Image for a Study Intersection
and Use of the Distance Measurement Tool for Counting Driveways. ... 51
Figure 11. Google Maps Split Screen Format with Satellite Image and StreetView™. ... 52
Figure 12. Geographic Distribution of Skewed and Non-skewed Intersections
by the Number of Legs. ... 53
Figure 13. Annual Average Total Crash Rate by Intersection Angle Category,
Number of Legs, and Rural/Urban Classification... 62
Figure 14. Results of Conditional Random Forest (cforest) Analysis for
Total Crashes at 4-Leg Intersections... 69
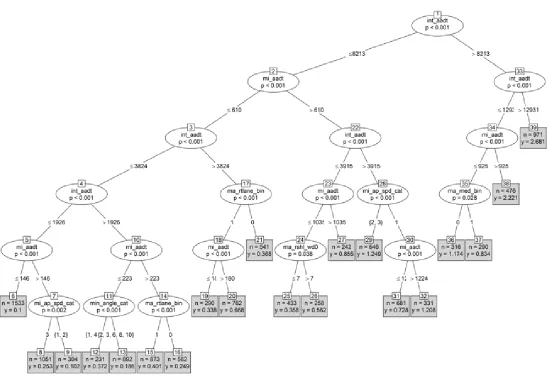
Figure 15. Results of Regression Tree (ctree) Analysis for Total Crashes at 4-leg
Intersections. ... 3
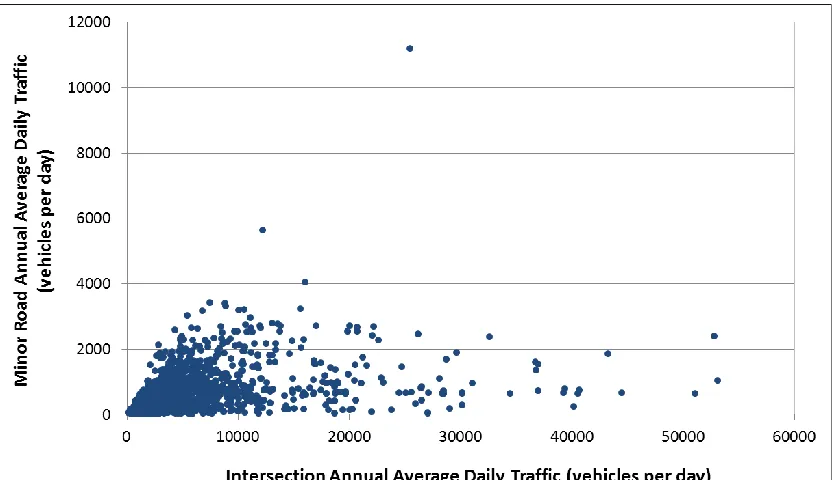
Figure 16. Scatterplot of Intersection AADT versus Major Road AADT for All 4-Leg
Figure 17. Scatterplot of Intersection AADT versus Minor Road AADT for All 4-Leg
Intersections. ... 77
Figure 18. Average Total Crashes per Intersection for All 4-Leg Intersections and Functional Form of [(1+cos(angle)) x Intersection AADT] as Distributed
Across the Range of Intersection Angles. ... 81
Figure 19. Average Total Crashes per Intersection for All 4-Leg Intersections and Functional Form of [(1+cos(angle)) x Minor Road AADT] as Distributed
Across the Range of Intersection Angles. ... 82
Figure 20. Scatterplot of Intersection AADT versus Minor Road AADT for All 3-Leg
Intersections. ... 89
Figure 21. Scatterplot of Intersection AADT versus Major Road AADT for All 3-Leg
Intersections. ... 89
Figure 22. Average Total Crashes per Intersection for All 3-Leg Intersections and Functional Form of [(1+cos(angle)) x Intersection AADT] as Distributed
Across the Range of Intersection Angles. ... 92
Figure 23. Average Total Crashes per Intersection for All 3-Leg Intersections and Functional Form of [(1+cos(angle)) x Minor Road AADT] as Distributed
Across the Range of Intersection Angles. ... 93
Figure 24. CMF Derived from the Alternative Base Model for Total Crashes
at All 4-Leg Intersections... 99
Figure 25. CMFs Derived from the Flexible Form Model 1 and Alternative Base
Model for Total Crashes at All 4-Leg Intersections. ... 101
Figure 26. CMFs Derived from the Flexible Form Models 1 and 2 and Alternative
Base Model for Total Crashes at All 4-Leg Intersections. ... 102
Figure 27. CMFs Derived from the Interaction Model, Flexible Form Models
1 and 2, and Alternative Base Model for Total Crashes at All 4-Leg Intersections. ... 104
Figure 28. CMF Values from the Interaction Model for a Range of Intersection AADTs and a Constant Minor Road AADT to Intersection AADT Ratio for
Total Crashes at All 4-Leg Intersections. ... 105
Figure 29. CMF Values from the Interaction Model for a Range of Minor Road AADT to Intersection AADT Ratios and a Constant Intersection AADT for
Figure 30. CMF Derived from the Alternative Base Model for Total Crashes
at Rural 4-Leg Intersections. ... 107
Figure 31. CMFs Derived from the Flexible Form Model 1 and Alternative Base
Model for Total Crashes at Rural 4-Leg Intersections. ... 109
Figure 32. CMFs Derived from the Flexible Form Model 1 for 4-leg Intersections. ... 111
Figure 33. CMFs from the Highway Safety Manual for Total Crashes at Rural
Two-Lane Roadway Intersections (Developed by Harwood et al., 2000). ... 114
Figure 34. CMFs for Total Crashes at 4-Leg Intersections from the HSM Function
and the Linear Function in the Current Study. ... 115
Figure 35. CMFs for Total Crashes at 4-Leg Intersections from the HSM Function
and the Linear and Flexible Functions in the Current Study. ... 116
Figure 36. Comparison of the Predictive Estimates from the Recommended
CMF(flex1) Compared to the Linear CMF(base) ... 118
Figure 37. Intersection Shown as Skewed 4-Leg Location in the GIS Roadway
Network and as Two 3-Leg Intersections in the Aerial Image. ... 147
Figure 38. Intersection Shown with a Single Minor Leg Approach in the GIS Roadway Network but with Two Minor Leg Approaches and a Median
Connector in the Aerial Image. ... 148
Figure 39. Intersection Shown as a Full Access 4-Leg Location in the
GIS Roadway Network but as Two 3-Leg Intersections (No Median Connector)
in the Aerial Image... 149
Figure 40. Grade-Separated Intersection That Should Not Have Been Included
in the Original HSIS Data Received. ... 150
Figure 41. Intersection That Was Classified as Skewed in the HSIS Database but is Obviously a Right-Angle Intersection in Both the GIS Roadway Network
and the Aerial Imagery... 151
Figure 42. Conditional Random Forest (cforest) Results for Total Crashes at 4-Leg
Intersections. ... 169
Figure 43. Conditional Random Forest (cforest) Results for Injury Crashes at 4-Leg
Figure 44. Conditional Random Forest (cforest) Results for PDO crashes at 4-Leg
Intersections. ... 171
Figure 45. Conditional Random Forest (cforest) Results for Total Crashes at 3-Leg
Intersections. ... 172
Figure 46. Conditional Random Forest (cforest) Results for Injury Crashes at 3-Leg
Intersections. ... 173
Figure 47. Conditional Random Forest (cforest) Results for PDO crashes at 3-Leg
Intersections ... 174
Figure 48. Regression Tree for Total Crashes at 4-leg Intersections (Results from ctree Analysis). ... 175
Figure 49. Regression Tree for Injury Crashes at 4-leg Intersections (Results from ctree Analysis). ... 176
Figure 50. Regression Tree for PDO Crashes at 4-leg Intersections (Results from ctree Analysis). ... 177
Figure 51. Regression Tree for Total Crashes at 3-leg Intersections (Results from ctree Analysis). ... 178
Figure 52. Regression Tree for Injury Crashes at 3-leg Intersections (Results from ctree Analysis). ... 179
Figure 53. Regression Tree for PDO Crashes at 3-leg Intersections (Results from ctree Analysis). ... 180
Figure 54. Crash Modification Factors Derived from the Flexible Form Model for Injury Crashes at 4-Leg Intersections. ... 197
Figure 55. Crash Modification Factors Derived from the Alternative Base Model and the Flexible Form Model for PDO Crashes at All 4-Leg Intersections. ... 198
LIST OF ABBREVIATIONS
AADT – annual average daily traffic
AASHTO – American Association of State Highway and Transportation Officials AIC – Akaike information criterion
APS – accessible pedestrian signal(s) BIC – Bayesian information criterion CA – California
CalTrans – California Department of Transportation CART – classification and regression tree
CMF – crash modification factor or crash modification function CRF – conditional random forest
CURE – cumulative residual
DOT – Department of Transportation
FARS – Fatality Analysis Reporting System FHWA – Federal Highway Administration ft – feet
GEE – generalized estimating equations GIS – geographic information system HSIS – Highway Safety Information System HSM – Highway Safety Manual
IHSDM – Interactive Highway Safety Design Model ILDOT – Illinois Department of Transportation ITE – Institute of Transportation Engineers MARS – multivariate adaptive regression splines MDOT – Montana Department of Transportation MLE – maximum likelihood estimation
MN – Minnesota
NB – negative binomial
NCHRP – National Cooperative Highway Research Program NHTSA – National Highway Traffic Safety Administration NM – negative multinomial
PDO – property-damage-only QP – quasi-Poisson
RENB – random-effects negative binominal RF – random forest
sec – second
U.S. – United States vpd – vehicles per day
CHAPTER 1. INTRODUCTION
1.1 Background
The preferred design for intersections includes adjacent legs that intersect at 90 degrees. However, there are occasions where physical constraints result in intersection angles less than 90 degrees, and thus produce skewed intersections. Such intersections create
potential safety and operational problems for both motorists and non-motorists.
Skewed intersections generally result in larger intersections. This additional space introduces several potential problems for drivers. First, they have a longer distance to travel when crossing the intersection or making certain turning maneuvers, which results in increased exposure within the intersection. Second, the increased surface area may result in driver confusion in terms of alignment on the approach to the intersection or while turning or crossing. Both of these issues may also apply to bicyclists.
The angles introduced at a skewed intersection create additional issues. First, the orientation of crossing traffic to the waiting driver, bicyclist, or pedestrian may make it more difficult to detect and judge the speed of approaching vehicles on conflicting paths. Second, the intersecting legs with acute angles between them can adversely affect the turning radius, making it more difficult to accommodate large trucks. Third, the acute angles may introduce additional sight obstructions, including possible obstructions from the body of the driver’s vehicle. For older drivers, the acute angles introduce the problem of being able to physically turn their head, neck, or upper body to create the necessary sight lines for seeing crossing traffic.
pedestrians, creating an environment in which it is difficult to align themselves for the crossing, properly ascertain the direction of traffic from sounds, and maintain alignment when crossing the street.
Properly addressing the operational and safety problems that result from skewed intersections requires sound design policies and practices. The AASHTO Policy on
Geometric Design of Streets and Highways – the Green Book (AASHTO, 2011) recommends that “intersecting roads should generally meet at or nearly at right angles.” The Green Book also states that some deviation from a 90-degree angle is permissible, but that an angle of at least 60 degrees provides most of the same benefits. The ITE Traffic Engineering Handbook (ITE, 2009) provides similar guidance. However, prior ITE guidance documents
recommended a minimum intersection angle of 70 to 75 degrees (ITE, 2003; ITE, 1999; ITE, 1984). The FHWA Highway Design Handbook for Older Drivers and Pedestrians also recommends right-angle intersections where right-of-way is not constrained and minimum intersection angles of 75 degrees where right-of-way is restricted (Staplin et al., 2001). There are also differences among state departments of transportation with respect to the minimum desired intersection angle.
To date, crash-based research on the safety and operational implications of intersection angle has been limited. This may explain the lack of consensus among the policies and guidance that now exists. There is a need to better understand the effects of intersection angle on crashes and to enhance the current design guidance.
1.2 Magnitude of the Problem
Figure 1. Percentage of Fatal Crashes in the U.S. by Location.
72.36% 17.94%
4.04% 5.65%
Non-Junction
Intersection
Intersection-Related
Other/Unknown
Source: NHTSA Traffic Safety Facts 2009
Figure 2. Percentage of Total Crashes in the U.S. by Location.
45.56%
19.51% 20.64%
14.29%
Non-Junction
Intersection
Intersection-Related
Other/Unknown
that intersections account for more than 50 percent of the total crashes in urban areas, while intersections account for just over 30 percent of the total crashes in rural areas. A study of California crashes found similar results, showing that, on average, 1.5 crashes per year occur at rural unsignalized intersections, and 2.5 crashes per year occur at urban unsignalized intersections (Bauer and Harwood, 1996).
The number of these crashes that occur at skewed intersections is more difficult to determine. There is no national database that includes geometric data on intersections. Similarly, there are very few states that have this information readily available. The Minnesota Department of Transportation (MNDOT) is one state that has this information available for most of their state-maintained intersections. An analysis of their 2008
intersection inventory data revealed that more than 16 percent of the intersections are skewed (see Figure 3). This percentage includes signalized and unsignalized locations. A review of the MNDOT crash data indicated that almost 18 percent of the intersection crashes occurred at these skewed locations (see Figure 4), indicating that such locations may be slightly
Figure 3. Percentage of Minnesota Intersections by Number of Legs and Angle Classification (2008).
36.55%
5.54% 47.22%
10.69%
3-Leg Right Angle
3-Leg Skewed
4-Leg Right Angle
4-Leg Skewed
overrepresented in terms of the crash problem (HSIS, 2012). However, it should be noted that these statistics do not account for traffic volume, area type, or other factors that may contribute to the crash problem.
In summary, intersections account for approximately 40 percent of the crashes on the U.S. road system. From the limited data available from the single State of Minnesota, more than 16 percent of the intersections may be classified as skewed, and these locations may be overrepresented in terms of total crash occurrence. Note that Minnesota may be considered a representative state with respect to intersection safety in the U.S. In 2010, an analysis of intersection-related fatalities was completed using three years (2007 to 2009) of data from the Fatality Analysis Reporting System (FARS). Minnesota’s fatality rates were 2.73 fatalities per 100,000 population and 0.92 fatalities per 100 million vehicle miles travelled. The national median rates for these same years were 2.72 fatalities per 100,000 population and 0.93 fatalities per 100 million vehicle miles travelled. (FHWA, 2010)
Figure 4. Percentage of Minnesota Intersection Crashes by Number of Legs and Angle Classification (2008).
36.41%
6.55% 45.83%
11.21%
3-Leg Right Angle
3-Leg Skewed
4-Leg Right Angle
4-Leg Skewed
Given these facts, careful consideration should be given to mitigation measures for skewed intersections when designing new roadways or retrofitting existing roadways. Such measures from the AASHTO Green Book, state highway design manuals, and other
resources range in terms of complexity. Examples include 1) complete realignment of an intersection to generate a right-angle location, 2) addition of traffic signals or signs to prohibit or more closely control certain movements, 3) addition of auxiliary turning and acceleration lanes to lessen the severity of the angles and allow drivers to use their mirrors to detect conflicting traffic, 4) addition of channelization to provide better guidance through the intersection and accommodate pedestrians, and 5) installation of accessible pedestrian signals to meet the needs of the visually impaired. (AASHTO, 2011; Antonucci et al., 2004; Neuman et al., 2003; Neuman, 1985; Harkey et al., 2007)
1.3 Objectives and Scope
The objective of this study was to derive quantitative relationships between intersection angle and safety, where safety is defined by intersection crashes. The relationships were used to:
determine appropriate crash modification factors for reducing or eliminating the skew angle of an intersection,
determine if there is a critical minimum angle at which safety is substantially diminished (75 degrees, 60 degrees, or other), and
The statistics on the magnitude of the problem in the prior section did not fully differentiate among characteristics that may be used to further define and scope the problem, such as area type (rural vs. urban), number of legs, type of traffic control present, and other features. Many of these features were used to limit the scope of this study for both practical reasons related to supplemental data collection efforts and methodological reasons related to adequate sample size. Chapter 4 of the report discusses the scope of this research effort in more detail.
As noted in the last objective bullet above, one of the anticipated outcomes of this study is possible new guidance for design policies and practices. This may include
recommended changes to the AASHTO Green Book (AASHTO, 2011). The current policy, which includes the critical minimum angle of 60 degrees, has been in place for decades. The 1965 AASHTO policy on geometric design notes that angles above 60 degrees produce only a small reduction in visibility, thus realignment may not be warranted (AASHTO, 1966). Other agencies and organizations, including ITE and FHWA, have recommended critical minimum angles of 70 to 75 degrees in recent years on the basis of behavioral and
observational research. AASHTO policy makers have reviewed that same research, but have resisted changing the Green Book to date. In part, this may be a function of desiring
definitive safety results on this issue. This study aims to fill this void.
1.4 Organization of the Dissertation
The report is structured as follows. Chapter 2 includes a review of the literature related to the topic of intersection angle. Studies are included that have attempted to quantify the crash effects of intersection angle as well as those that have addressed visibility (sight distance) and physiological issues of drivers and pedestrians. Chapter 3 includes a
description of the methodology and analysis approach. Chapter 4 includes a detailed
CHAPTER 2. LITERATURE REVIEW
As noted in the introduction, addressing the potential safety and operational problems of skewed intersections requires sound design policies and practices. Provided in Section 2.1 is a description of the design policies and guidance that currently exist in the U.S. These policies should be informed by or based upon research that has been conducted on the topic. The second part (Section 2.2) of the literature review discusses the limited research that has addressed intersection angle and its effect on safety.
2.1 Current Design Guidance
The AASHTO Policy on Geometric Design of Streets and Highways – the Green Book (AASHTO, 2011) – addresses the issue of intersection alignment and skew angle in several chapters. In the chapter on intersections, the recommendation is that “intersecting roads should generally meet at or nearly at right angles.” This chapter also includes
recommendations related to the realignment of a skewed intersection, noting that “the angle of the realigned intersection should be as close to 90 degrees as practical.” However, the policy goes on to read that some deviation from a right angle is permissible, and that providing “an angle of 60 degrees provides most of the benefits of a 90-degree intersection while reducing the right-of-way takings and construction costs often associated with providing a right-angle intersection.” The foundation for this later statement regarding benefits is unclear.
The intersection chapter of the Green Book also addresses the effect of skew angle on intersection sight distance, noting that the sight triangles at a skewed intersection will be larger or smaller, depending on the quadrant, than what is present at a right-angle
defining the control radius and point of tangency that should be used in the development of design alternatives for channelization at skewed intersections.
In the chapter of the Green Book related to the design of intersections on local roads and streets, the recommended policy is for intersecting streets to “meet at approximately a 90-degree angle” and for the alignment design to “avoid an angle of intersection of less than 60 degrees.” For collector roads and streets, the recommendation specifically addresses stop-controlled intersections. The policy reads that the intersecting legs “should intersect at right angles, wherever practical, and should not intersect at an angle less than 60 degrees.”
The Green Book is a product of state transportation engineers, designers, and
policymakers. Hence, state departments of transportation use the Green Book as the starting point for their own internal design policies. The policies of several states were examined with respect to intersection design and skew angle. Iowa’s design manual addresses the
intersection of crossroads with rural, two-lane or multilane primary highways. The policy establishes an intersecting angle of 90 degrees as “ideal,” between 90 and 75 degrees as “desirable,” and between 75 and 60 degrees as “acceptable.” Any intersections with angles less than 60 degrees “will be realigned to provide a desirable intersection angle” (Iowa DOT).
The Montana Department of Transportation (MDOT) policy reads that “roadways should intersect at or as close to 90 degrees as practical” and provides several reasons why skewed intersections are undesirable. The policy notes that the intersection angle should not exceed 30 degrees from perpendicular. With respect to realignment, the MDOT policy reads that “it will rarely be warranted to realign the intersection if its skew is within 30 degrees of perpendicular.” If the skew angle is greater than 30 degrees, the policy notes that “the intersection may require geometric improvements (realignment, auxiliary lanes, greater corner sight distance)” (MDOT, 2004).
The policy for the Illinois Department of Transportation reads that, “Highways should intersect at right angles” and also provides several reasons why acute angles are undesirable. However, the policy goes on to note that the angle should be within 15 degrees of
sight lines and turning movements is not significant.” The policy further notes that an intersection angle up to 30 degrees from perpendicular may be used under restricted conditions. For a skew angle in excess of 30 degrees, it is noted that geometric
improvements or more positive traffic control (e.g., all stop, traffic signals) may be warranted (ILDOT, 2005).
Within the California Department of Transportation (CalTrans), the recommendation for 90-degree intersecting angles is also present. However, the minimum angle recommended when a right angle cannot be achieved is 75 degrees. The justification includes the following statement – “A 75 degree angle does not unreasonably increase the crossing distance or generally decrease visibility.” For intersecting legs that are less than 75 degrees, it is recommended that a series of retrofit improvement strategies be considered, including realignment, provision of acceleration lanes, and turning movement restrictions (CalTrans, 2009).
One of the references cited in the Iowa DOT design manual is the Intersection Channelization Design Guide (Neuman, 1985). This publication of the National Cooperative Highway Research Program (NCHRP) includes recommended guidance regarding
intersection angle for both new construction and reconstruction/rehabilitation. The
recommendation for new construction is to maintain angles of between 75 and 90 degrees unless there are “costly or severe constraints.” If such constraints exist, it is recommended that angles as low as 60 degrees are acceptable. For reconstruction/rehabilitation projects, the recommendation is to examine crash rates and patterns that may be the attributable to the skew of the intersection.
The Traffic Engineering Handbook (ITE, 2009) provides similar guidance to what is found in the Green Book and other resources with respect to the desire for right-angle intersections. The Handbook also acknowledges the safety and operational problems that may persist at intersecting angles less than 60 degrees. However, the document stops short of making a recommendation for minimum desirable angle. On the other hand, prior ITE
The Neighborhood Street Design Guidelines (ITE, 2003) recommends a minimum angle of 70 degrees. A recommended practice for subdivision streets reads “…in no case should the angle be less than 75 degrees”(ITE, 1984).
The Federal Highway Administration (FHWA) has published a couple guidance documents in recent years that include recommendations related to skewed intersections. The Highway Design Handbook for Older Drivers and Pedestrians (FHWA, 2001) recommends right-angle intersections where right-of-way is not constrained. For those intersections where right-of-way is restricted, the recommendation is for a minimum intersection angle of 75 degrees (Staplin et al., 2001). The Handbook also recommends the prohibition of right-turn-on-red (RTOR) on approach legs where the intersecting angle to the driver’s left is less than 75 degrees. In the publication titled Signalized Intersections: Informational Guide (FHWA, 2004), the authors discuss several of the operational and safety issues associated with skewed intersections. A brief synopsis is also provided of the range of minimum intersection angles recommended in different sources, from 60 degrees to 75 degrees. However, the Guide stops short of making a recommendation on a minimum angle value.
The AASHTO Guide for the Planning, Design, and Operation of Pedestrian Facilities (AASHTO, 2004) discusses the implications of skewed intersections on
pedestrians. Concerns include longer crossing distances, increased exposure to traffic and possible conflicts, and proper location of the crosswalk. There is also a discussion of the navigational issues for the visually-impaired pedestrian including the ability to properly align for crossing the intersection and maintaining alignment while crossing. The Guide, however, does not make any recommendations regarding desirable or minimum intersection angles. The difficulties of visually-impaired pedestrians at skewed intersections are also addressed in a best practices guide on accessible pedestrian signals (APS) (Harkey, Carter, Barlow, and Bentzen, 2007). The guide includes a prioritization tool for rating intersections with respect to needing APS to help pedestrians cross the street. A skewed crossing receives the second highest number of points (more points equates to greater crossing difficulty) of any
2.2 Safety Research
The research available on the safety effects of intersection angle is limited and by no means definitive. The work that has been conducted can be divided into three distinct types of studies – crash-based, visibility-based, and physiology-based. The crash-based research explored the relationships between the intersection skew angle and crash frequencies or rates. The visibility-based research focused on the sight lines and sight distance requirements using observational inputs from drivers. The physiology-based research primarily addresses the diminished physical skills of older persons and how this impacts their ability to negotiate skewed intersections. A summary of the studies discovered in each of these areas is provided below.
2.2.1 Crash Research
The Highway Safety Manual (HSM) includes the following crash modification factors (CMFs) as part of the predictive method for rural two-lane, two-way roads (AASHTO, 2010):
CMF (3-leg intersection) = EXP(0.0040 x skew) (1)
CMF (4-leg intersection) = EXP(0.0054 x skew) (2)
where:
CMF = crash modification factor for total crashes
skew = intersection skew angle in degrees; the absolute value of the difference between 90 degrees and the actual intersection angle
As an example of application, consider an intersection (either 3- or 4-leg) where the smallest angle between any two legs is 70 degrees; hence the skew angle is 20 degrees. The CMFs would be calculated using the above equations as follows:
Thus, a 3-leg rural stop-control intersection with a 70-degree intersection angle would be expected to have 8 percent more total crashes than a right-angle intersection. Similarly, a 4-leg rural stop-control intersection would be expected to experience 11 percent more total crashes.
These CMFs were developed as part of an FHWA study to develop an algorithm for predicting safety performance of a rural two-lane highway (Harwood et al., 2000). This algorithm became the initial crash prediction module within FHWA’s Interactive Highway Safety Design Model (IHSDM). The CMFs were derived from negative binomial regression models, which were developed using data from 382 3-leg and 324 4-leg stop-control
intersections in Minnesota. The models took the following forms:
N3-leg = EXP(-12.82 + 1.01lnADTmaj + 0.406lnADTmin + RHRI + 0.33RT + 0.0040SKEW3) (5)
N4-leg = EXP(-9.34 + 0.60lnADTmaj + 0.61lnADTmin + 0.13NDmaj + 0.0054SKEW4) (6)
where:
N3-leg = predicted number of total crashes per year at a particular 3-leg
intersection and within 250 ft in either direction along the major road N4-leg = predicted number of total crashes per year at a particular 4-leg
intersection and within 250 ft in either direction along the major road ADTmaj = average daily traffic volume (vpd) on the major road
ADTmin = average daily traffic volume (vpd) on the minor road
NDmaj = number of driveways on the major road within 250 ft of the intersection
RHRI = roadside hazard rating within 250 ft of the intersection on the major road RT = presence of right-turn lane on the major road (0 = no turn lane; 1 = turn
lane present)
SKEW3 = intersection angle (degrees) minus 90 for the angle between the
SKEW4 = intersection angle (degrees) expressed as one-half of the angle to the right
minus one-half of the angle to the left for the angles between the major-road leg in the direction of increasing stations and the right and left legs, respectively
The 4-leg model included all crash types and only variables that were significant at a significance level of 0.15 or less; skew angle was significant at a p-value equal to 0.108. The 3-leg model included only those crash types generally related to intersection operations; the significance level (p-value) for skew angle in this model was 0.17. As part of this same study, a panel of road safety research experts evaluated these models and made the
determination that the coefficients for skew angle were appropriate to be used for CMFs to ascertain the safety effect of intersection angle. However, the panel also recommended further research on this geometric characteristic.
A study designed to develop guidelines for the realignment of intersections in Nebraska (McCoy, Tripi, and Bonneson, 1994) used crash data from 3-leg and 4-leg rural two-lane roadway intersections. Three years of crash data for 29 skewed intersections and 39 comparable non-skewed intersections were used to develop the following Poisson regression model:
( )
(
) (7)
where:
N = number of crashes per year
ADTmaj = annual average daily traffic (vpd) on major roadway
ADTmin = annual average daily traffic (vpd) on minor roadway
= intersection type factor = 0.129 + 0.260F F = 0 for 3-leg intersection; 1 for 4-leg intersection
The model produces an increase in crashes as the traffic volume and skew angle increases, with 4-leg intersections having more crashes than 3-leg intersections for the same volumes and skew angle.
Another study (Hanna et al., 1976) of 3-leg intersections found that wye (skewed) intersections had crash rates approximately 50 percent higher than tee (right-angle)
intersections, suggesting an effect of intersection angle. A study of intersections in Finland found that acute and obtuse skew angles affected safety differently (Kulmala, 1995). This phenomenon was discussed by the expert panel in the Harwood et al. (2000) study noted above, but it was decided that this study alone “did not provide a sufficient basis for challenging the widely accepted view that any intersection skew that departs from a 90-degree angle, whether positive or negative, is detrimental to safety.”
2.2.2 Visibility Research
Gattis and Low (1997; 1998) conducted a field study and measured the angles at which drivers’ lines of sight were obstructed by the body of their vehicles when looking to the right. Two driver positions (“sit back” and “lean forward”) were used. A 13.5-degree vision angle (with respect to a line perpendicular to the vehicle path) was selected to
represent an intermediate posture, between the sit back and the lean forward positions. The authors concluded that a 60-degree left-skewed intersection may result in an obstructed line of sight to the right for a driver for certain types of vehicles. Thus, the minimum angle present in the AASHTO Green Book may not be appropriate. Instead, a minimum
intersection angle of 70 to 75 degrees is recommended to offer an improved line of sight. Son, Kim, and Lee (2002) also analyzed the right lateral visibility of drivers in both passenger cars and heavy trucks at left-skewed intersections. They calculated the available sight distance using driver positions similar to what Gattis and Low had used. They
concluded that intersection angles below 70 degrees should not be used when the design vehicle is a large vehicle or semitrailer.
microsimulation results of the drivers’ behavior. They concluded that an intersection angle of no less than 70 degrees should be used at intersections and no less than 7 degrees for merging areas.
2.2.3 Physiology Research
Angles between the legs of an intersection can impact one’s ability to make decisions at and maneuever through intersections. These impacts are most negative for those that have diminished physical capabilities. Older persons are one demographic who may experience problems at skewed intersections. The following discussion in this section is taken from the Draft FHWA 2011 Handbook for Designing Roadways for the Older Population (Harkey et al., 2011) and denotes some of the problems that older persons may experience.
Many older drivers experience a decline in head and neck mobility, which
accompanies advancing age and may contribute to the slowing of psychomotor responses. Joint flexibility, an essential component of driving skill, has been estimated to decline by approximately 25 percent in older adults due to arthritis, calcification of cartilage, and joint deterioration (Smith and Sethi, 1975). A restricted range of motion reduces an older driver’s ability to effectively scan to the rear and sides of his or her vehicle to observe blind spots, and similarly may be expected to hinder the timely recognition of conflicts during turning and merging maneuvers at intersections (Ostrow, Shaffron, and McPherson, 1992). For older drivers, diminished physical capabilities may affect their performance at intersections
designed with acute angles by requiring them to turn their heads further than would be required at a right-angle intersection. This obviously creates more of a problem in determining appropriate gaps.
ages 60 to 69, and 59 degrees for drivers age 70 and older. In addition, the percentage of drivers with less than 30 degrees of horizontal peripheral vision increased with increases in age, from 15 percent of the younger driver sample to 65 percent of the drivers age 70 and older. Three of the oldest drivers had less than 50 degrees of head movement and two of these drivers also had less than 20 degrees of horizontal peripheral vision.
In a survey of older drivers conducted by Yee (1985), 35 percent of the respondents reported problems with arthritis and 21 percent indicated difficulty in turning their heads to scan rearward while driving. Excluding vision/visibility problems associated with nighttime operations, difficulty with head turning placed first among all concerns mentioned by older drivers participating in a focus group conducted by Staplin, Harkey, Lococo, and Tarawneh (1997) to examine problems in the use of intersections where the approach leg meets the main road at a skewed angle, and/or where channelized right-turn lanes require an exaggerated degree of head/neck rotation to check for traffic conflicts before merging. Comments about this geometry centered on the difficulty older drivers experience turning their heads to view traffic on the crossing roadway at locations with intersection angles less than 90 degrees. Several participants reported an increasing reliance on outside rearview mirrors when negotiating highly skewed intersections. However, they reported that the outside mirror is of no help when the roads meet at the mid-range of angles (e.g., 40 to 55 degrees), and the driver is not flexible enough to physically turn to look for traffic.
In an observational field study conducted as a part of the same project, Staplin et al. (1997) found that approximately 30 percent of young/middle-aged drivers (ages 25 to 45) and young-old drivers (ages 65 to 74) used their mirrors in addition to making head checks before performing a right-turn-on-red (RTOR) maneuver at a skewed intersection (a
channelized right-turn lane at a 65-degree skew). By comparison, none of the drivers age 75 and older used their mirrors; instead, they relied solely on information obtained from
The practical consequences of restricted head and neck movement on driving
performance at tee (3-leg) intersections were investigated by Hunter-Zaworski (1990), using a simulator to present video-recorded scenes of intersections with various levels of traffic volume and sight distance in a 180-degree field of view from the driver’s perspective. Drivers in two subject groups, ages 30 to 50 and 60 to 80, depressed a brake pedal to watch a video presentation (on three screens), then released the pedal when it was judged safe to make a left turn; half of each age group had a restricted range of neck movement as determined by goniometric measures of maximum (static) head-turn angle. Aside from demonstrating that skewed intersections are hazardous for any driver with impairment in neck movement, this study found that maneuver decision time increased with both age and level of impairment. Thus, the younger drivers in this study were able to compensate for their impairments, but older drivers both with and without impairments were unable to make compensations in their (simulated) intersection response selections.
Older and younger driver performance was compared at 10 intersections (5 improved and 5 unimproved) to test the effectiveness of the FHWA recommendations for intersection design to accommodate older road users (Classen et al., 2007). Thirty-nine drivers ages 25 to 45 and 32 drivers ages 65 to 85 drove an instrumented vehicle on urban and residential streets in Gainesville, Florida, accompanied by a front-seat driving evaluator who recorded behavioral errors. The course took approximately one hour to complete, and included driving through five sets of improved and unimproved intersections. One set of intersections
from the idealized curved path during the turn, indicating greater vehicle control. There were no significant differences between age groups for either the kinematics measures or the behavioral measures.
Age-related diminished capabilities, which may make it more difficult for older pedestrians to negotiate intersections, include decreased contrast sensitivity and visual acuity, reduced peripheral vision and “useful field of view,” decreased ability to judge safe gaps, slowed walking speed, and physical limitations resulting from arthritis and other health problems. Older pedestrian problem behaviors include a greater likelihood to delay before crossing, to spend more time at the curb, to take longer to cross the road, and to make more head movements before and during crossing (Wilson and Grayson, 1980).
2.3 Summary
In summary, there is consensus among the policy and design guidance in the highway design field that intersecting roadways should be aligned to meet at 90 degrees. There is also a common recognition of the safety and operational problems that are introduced for different modes of travel once an intersection becomes skewed. However, there are differences among these documents regarding the critical minimum angle – the angle at which consideration should be given to realigning the intersection or implementing additional traffic control measures. That angle currently ranges from 60 degrees to 75 degrees, depending on the reference.
There have very few studies that have attempted to define the safety implications of intersection angle using crash data. An expert panel of road safety researchers reviewed several of these studies as part of an effort for FHWA to quantify crash effects of specific design elements that could be used in the Interactive Highway Safety Design Model. The panel made the decision that the results from the Harwood et al. (2000) analysis were the most credible at the time. However, the panel also noted that more work was needed to better quantify the effects of intersection angle.
Finally, there is evidence that intersection angle can impact those drivers and pedestrians whose physical capabilities have diminished. Older persons who have reduced flexibility may have difficulty turning their heads and necks to judge gaps in traffic at skewed intersections. Older or disabled pedestrians who walk at slower speeds will be
exposed to traffic for a longer period of time at crossings that are lengthened as a result of the intersection angle. These research findings led to the 75-degree critical minimum angle recommendation in the FHWA Handbook (Harkey et al., 2011) as a practice to accommodate age-related performance deficits.
CHAPTER 3. METHODOLOGY AND APPROACH
3.1 Analysis Approach
The approach for this evaluation was to develop a series of cross-sectional models using the latest state-of-the-practice statistical method for developing crash prediction models in the road safety field. Currently, the favored modeling choice is negative binomial (NB) regression. However, prior to model development, random forest (RF) and classification and regression tree analyses were used to help identify the most appropriate variables for the models (Breiman et al., 1984; Breiman and Cutler, 2001; Strobl et al., 2009; Loh, 2011). This data mining approach offers some unique advantages over the traditional iterative approach to variable selection when building predictive models. Finally, crash modification factors (CMFs) for intersection angle were derived from the NB models. The CMFs developed were then used to make recommendations for policy and design guidance documents, such as the AASHTO Green Book.
This approach to the analysis required a large sample of intersections that are skewed and not skewed. To determine if there is a “minimum critical safety angle,” it was also desirable that the sample of intersections range in terms of skew severity. The next chapter on data acquisition and preparation discusses the data collected, including key data elements acquired through a supplemental data collection effort.
3.2 Evolution of Road Safety Model Development
As this research effort included the development of road safety models, it is important to understand how these models have evolved over time within the highway safety field. This section of the dissertation provides a summary of this evolution.
Much of the research exploring relationships between crashes and roadway characteristics has relied on the development and interpretation of cross-sectional or regression models. More than 20 years ago, the approach often selected was conventional linear regression taking the form (Jorgensen, 1978; Abess et al., 1981; Zegeer et al., 1987):
(8)
where:
Yi= response variable (e.g., crash frequency or crash rate occurring at location i during the specified time period)
= constant (i.e., intercept)
n)= estimated regression coefficients
X(1…n)i= observed values of covariates or explanatory variables (e.g., lane width,
shoulder type, curvature, etc. at location i)
i= unexplained variation in the response variable (i.e., error term)
The method most commonly used to develop the estimated parameters for such linear models is ordinary least squares (OLS) estimation. However, it has been documented that conventional linear regression is not appropriate for modeling crash frequencies for the following reasons (Jovanis and Chang, 1986; Joshua and Garber, 1986; Miaou and Lum, 1993):
normal distribution allows for the prediction of negative crashes, which can bias the estimated coefficients.
2) The variance is not constant throughout the distribution (i.e., homoscedastic). This problem does not affect the estimated parameters, but does affect the confidence intervals of the estimates that are used for significance testing.
To overcome the problems with conventional linear regression models, Poisson regression models came into favor for modeling the relationship between crashes and roadway geometrics. The underlying assumed distribution is Poisson, which is a discrete probability distribution that is very appropriate for representing “infrequent event” data (e.g., crashes) that may occur over a large number of trials (e.g., number of vehicles traveling through any given location). The Poisson distribution takes the following form:
( ) ( ) (9)
where:
P(yi) = probability of yi crashes occurring at location i during the specified time period
i = Poisson parameter (expected number of crashes at location i during the specified time period)
The Poisson parameter is defined as a function of the explanatory variables as follows:
( ) {∑
where:
= constant (i.e., intercept)
j= estimated regression coefficients
Xj= observed values of covariates or explanatory variables (e.g., lane width, shoulder type, curvature, etc.)
Maximum likelihood estimation (MLE) is used to produce the estimated regression
coefficients. The likelihood function is of the form (Washington et al., 2003):
( ) ∏ [ ( )][ ( )] (11)
Two research efforts applied both linear regression and Poisson regression models to study the relationship between truck crashes and roadway geometrics (Joshua and Garber, 1986; Miaou and Lum, 1993). In both efforts, it was found that the linear regression models did not define the relationships very well. In the latter study, two types of Poisson regression models were developed: 1) multiplicative with an exponential rate function, and 2)
multiplicative with non-exponential rate function. The use of an exponential rate function ensures that the crash rate is always non-negative, and was the preferred model. The authors also concluded that linear models may seriously overestimate or underestimate the number of crashes.
For Poisson regression to be considered an appropriate approach, it is also required that the mean and variance of the distribution are equal. In some of the research literature, this requirement may be met or was simply assumed (Griebe, 2003; Hubacher and
Overdispersion can be handled by choosing a different model form or by making a statistical correction within the Poisson regression model. The latter is referred to as the quasi-Poisson (QP) model and makes an adjustment to the variance term to create equality with the mean (Wedderburn, 1974). Two studies were found that examined the use of this method and compared it to the results from other models (Maher and Summersgill, 1996; Berhanu, 2004). The earlier effort examined a number of historical data sets to assess the quality of validity of QP vs. negative binomial (NB) models. While both models produced similar parameter estimates, the NB model was the preferred choice for estimating the uncertainty associated with the model. The latter study was a safety evaluation of roadways in Addis Ababa, Ethiopia. In this effort, the NB models were also preferred over the QP models for the vehicle crash data that was shown to be overdispersed. For the pedestrian crash model however, the QP model was preferred choice as the overdispersion was less significant.
NB models are indeed the next generation of regression models to account for overdispersion. The NB distribution is also a discrete probability distribution, but is more general than the Poisson distribution and allows the variance to exceed the mean. The NB distribution is represented as a gamma function [(.)] and takes the form:
( ) [( ⁄ ) ] ( ⁄ ) (
⁄ ( )⁄ )
⁄
(
( ⁄ ) ) (12)
where:
P(yi) = probability of yi crashes occurring at location i during the specified time period
i = expected number of crashes at location i during the specified time period
The expected number of crashes is similar to the Poisson parameter (i), but now includes a gamma-distributed error term, i, as follows:
( ) {∑
} (13)
where:
= constant (i.e., intercept)
j= estimated regression coefficients
Xj= observed values of covariates or explanatory variables
i = gamma-distributed error term with mean equal to 1 and variance = 2
The error term allows the variance, Var(yi), to differ from the mean, E(yi), as follows:
( ) ( ) ( ) (14)
The likelihood function is of the form (Washington et al., 2003):
( ) ∏ [( ⁄ ) ] ( ⁄ ) (
⁄ ( )⁄ )
⁄
(
( ⁄ ) ) (15)
a range of crash frequencies on the road sections in which it performed best. The NB models were best for estimating the number of road sections with 0 crashes; ZIP models were best for those with 1 to 3 truck crashes; and the Poisson model was best for those with 4 or more crashes. In conclusion, the author recommended starting with the Poisson model. If
overdispersion is present and greater than 1.3, the NB and ZIP models should be considered (Miaou, 1994).
In the past decade, more research studies have applied zero-inflated models, either ZIP models or zero-inflated negative binomial (ZINB) models (Shankar et al., 1997; Lee and Mannering, 2002; Kumara and Chin, 2003; Qin et al., 2004). The appeal of these models is the improved statistical fit that can be produced because of the manner in which excess zero counts are handled within the modeling framework. However, the validity of such models has been questioned as it applies to crash data. The underlying theory behind zero-inflated models requires a dual state. For crashes, the states are either 1) unsafe – those locations with crashes, or 2) safe – those locations without crashes. It has been argued that the latter state does not exist, i.e., no road section can be considered inherently safe. The presence of road sections with a large number of zero crashes is more likely to be a function of low exposure, high heterogeneity in crash counts, and the selection of spatial and temporal scales (Lord et al., 2005; Lord et al., 2007).
On occasion, it is possible for the crash data to be underdispersed. This condition was discovered in a recent analysis of rail-highway crossings in Korea (Oh et al., 2006). The authors applied a gamma model that can be used for count data that are either overdispersed or underdispersed. The expected mean function can be written as follows (Winkelman and Zimmerman, 1995):
( | ) ∑ ( )
where:
E[yi|Xi] = expected number of crashes y at location i, given explanatory conditions represented by X
= dispersion parameter
j = crash count (0, 1, 2, …)
i = EXP(Xi), where are the estimated coefficients
The authors originally produced Poission, NB, and ZIP models. Once underdispersion was discovered, they opted for the gamma model. It was noted that the model offered a good statistical fit, while accounting for the underdispersion. The function of this model is such that it may also be used to account for overdispersion. However, no studies were discovered that used the model to account for this phenomenon.
While the standard NB model takes care of the overdispersion problem, it does not address another problem that has come to light in recent years – serial or temporal
correlation. In other words, crash counts from the same sections of roadway over multiple years may produce temporal correlation that is not accounted for in the model estimates. Several modeling approaches have been explored to account for both overdispersion and serial correlation. A study of Washington State median crashes used a random-effects NB (RENB) model in an examination of median-crossover collisions (Shankar et al.; 1998). The RENB model assumes that the crashes are randomly distributed across locations and that any location-specific effect deviates over time. Both NB and RENB models were produced for several scenarios to account for spatial and temporal effects. The authors concluded that the RENB model did improve the statistical fit to the data over the NB model. However, if spatial and temporal effects are accounted for within the NB model, the RENB model does not offer any advantages.


![Figure 18. Average Total Crashes per Intersection for All 4-Leg Intersections and Functional Form of [(1+cos(angle)) x Intersection AADT] as Distributed Across the Range of Intersection Angles](https://thumb-us.123doks.com/thumbv2/123dok_us/1380777.1170766/99.612.101.533.76.330/average-crashes-intersection-intersections-functional-intersection-distributed-intersection.webp)
![Figure 19. Average Total Crashes per Intersection for All 4-Leg Intersections and Functional Form of [(1+cos(angle)) x Minor Road AADT] as Distributed Across the Range of Intersection Angles](https://thumb-us.123doks.com/thumbv2/123dok_us/1380777.1170766/100.612.101.532.76.330/figure-average-crashes-intersection-intersections-functional-distributed-intersection.webp)