20th International Conference on Structural Mechanics in Reactor Technology (SMiRT 20) Espoo, Finland, August 9-14, 2009 SMiRT 20-Division 5, Paper 1713
Experimental Study on Seismic Reduction Effectiveness of
Main Control Room in N.P.P using 3-Directional Isolation System
Kyung-Won Hahm
a, Kyung-Jin Lee
a, and Yong-Pyo Suh
aa
Korea Electric Power Research Institute, KEPCO, KOREA, [email protected]
Keywords: seismic, main control room, floor isolation, FPS, LRB, shaking table test
1
ABSTRACT
The main control room of a nuclear power plant operates many important NPP facilities such as NSSS, so it is highly recommended to secure seismic safety of main control room during and after earthquakes. A number of isolation systems installed between equipment and foundation have been widely studied. In this study, 3-Directional isolation systems was used which are consist of a FPS(Friction Pendulum System), an air spring and a viscous damper. A FPS is resistant to horizontal motion and an air spring is resistant to vertical motion and a viscous damper is resistant to rocking motion and excessive displacement. In this study, two types of main control floor systems were taken into account and a number of shaking table tests with or without isolation system were conducted to evaluate 3D isolation reduction effectiveness.
2
INTRODUCTION
The floor isolation system can be largely divided into 2-dimensional floor isolation systems and 3-dimensional floor isolation system. In the case of 2D isolation system, the Lead-Rubber Bearing (LRB) and the Friction Pendulum System (FPS) are generally used. Recently, 3-dimensional floor isolation system was developed in Japan. This system is consisted of a FPS, a viscous damper and an air spring and reduces simultaneously horizontal and vertical direction vibration.
As a way of developing various methods for improving seismic stability of the main control room of NPP, the floor isolation of the main control room has been widely studied. The access floor of the main control room was designed to actual size and shape, which is referred to as a type I. Type II is a simplified modification of Type I. For each test model, several shaking table tests were conducted for each test model to analyze and assess horizontal and vertical earthquake response. As an input motion, OBE(Operating Basis Earthquake) and SSE(Safe Shutdown Earthquake), which are used in the design of NPP, were considered to verify seismic reduction effectiveness of main control room of NPP.
3
APPLICATION OF ISOLATION SYSTEM
In the case of a computer access floor isolation, Lambrou and Constantinou have conducted a research to reduce the earthquake response of the main control room for generally used computers[1]. Lambrou and Constantinou installed an H-shaped steel frame in the lower part of the access floor of the main control room and separately attached a sliding bearing, a friction pendulum system and a fluid viscous damper to the frame and conducted a comparative experimental test.
At the Japan Nuclear Energy Safety organization (JNES), a shaking table test was carried out by applying the floor isolation system with the real size access floor. The purpose of this study was to assess the structural integrity of the structures as well as functionality of the computer system and to verify the seismic margin of the computer system during an earthquake[2]. The frame, structure, etc. of the specimen used in the actual proof-generating tests were made on the scale of 1:1, so as to be identical to the actual equipments.
In terms of the research on the mechanical features of FPS, Kim Young Jung[4], Lee Kyung Jin[5], and others have performed horizontal dynamic tests while vertical load was applied to the isolator. The dynamic characteristics, which was changed by horizontal displacement, has been tested. Kim Woo Beom[6] and others have used a FPS of the control room to assess the reduction characteristics depending on the friction coefficient.
4
SHAKING TABLE TEST PROCEDURE
4.1 Structural and Geometric Features
When designing the test specimen, the size of unit access floor was considered to be same of the shaking table base size (2.5m x 2.5m). Two kind of unit access floor model was fabricated. First is the Type I which is made according to the existing design of the access floor of the main control room. The size of the Type I is 2.5m x 2.5m x 0.8m(W x D x H ). The H-200 x 200 x 8 x 12 H beams were used as a floor frame. The total weight of the specimen is 2.0 tonf (Fig. 1 (a)). The second is the type II, which is a simplified adaptation of Type I. In the case of Type II, vertical support of Type I was removed. The size is 2.5m x 2.5m x 0.2m and Type II was made of same materials of Type I. The total weight is 1.0 tonf. Fig. 1(b) shows the entire view of Type II.
(a) Type I (b) Type II Fig 2. PCS Cabinet
Fig 1. Test Specimen of main control room of NPP
4.2 The Characteristics of Control Cabinet
The PCS cabinet, which is installed in the main control room of the #1, #2 of Uljin Nuclear Power Plant, is assembled on the top of Types I & II (Fig 2).
4.3 The Dynamic Characteristic of 3D Isolation Systems
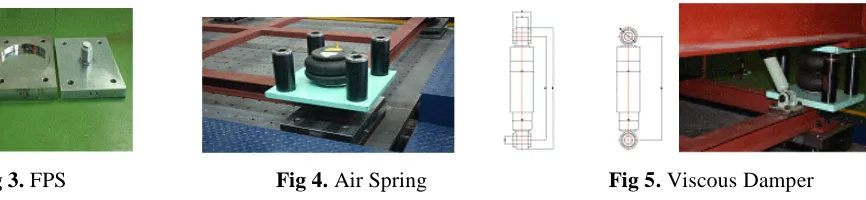
Fig 3. FPS Fig 4. Air Spring Fig 5. Viscous Damper
4.3.1 A FPS
A friction pendulum system was selected to reduce and control the horizontal motion. Horizontal natural frequency of a FPS was set to 0.5Hz to consider avoiding amplification with an earthquake input motion. The friction material component of the curvature surface is the unfilled PTFE, the radius of the friction material is 40mm, and the pressure surface area is 12.566cm2. Fig. 3 shows a FPS isolator.
4.3.2 An Air spring
An air spring was used to reduce the vertical movement. The vertical frequency of the air spring is 2Hz. The weight of the test specimen was chosen, so as to set the vertical strength 700kgf/ea when 52psi air pressure was inflated. In order to reduce the rocking that occurs after attaching the air spring onto the frame and in order to move only vertical direction, four safety steel guides (Fig. 4) was installed at the four corner of each air spring.
4.3.3 A Viscous damper
One of the major problems associated with the 3-dimensional floor isolation system is that when the horizontal and vertical earthquake motion occurs simultaneously, the isolators have a tendency to move orthogonal to force direction, which is also known as a rocking motion. As a result of this, an excessive vertical displacement takes place. To avoid rocking, a viscous damper was installed. The vertical capacity of the damper is 2 tonf/ea., the maximum displacement of damper is 135mm, the damping coefficient is 15,000 N•sec/m and the damping ratio is 15% (Fig. 5).
4.4 Test Procedure
In order to assess horizontal and vertical reduction efficiency of the 3-dimensional isolation system, 4 identical 3D isolation systems were installed beneath the test specimen. Also in order to obtain acceleration of the specimen, a number of sensors were attached on the specimen (Fig. 6). To measure the horizontal response of the cabinet, the accelerometers were attached on the top, middle and bottom of the cabinet. Also several LVDTs were attached on the top, middle and bottom of the cabinet and on the shaking table base frame to acquire horizontal displacement.
As a way of measuring the vertical response of the cabinet, the acceleration sensors were attached on the right and left side of the lower part of the cabinet. Vertical oriented LVDTs were attached to the frame and the 3-dimensional floor isolation systems were set up on the four corners of the access floor. The tests were carried out in the sequence of Table 1 below.
Table 1. Test Summary
(a) Type I (b) Type II
Fig 6. Sensor Position
Tyep Isolation Input
Motion
Test
Sequence
Isolated OBE
SSE
1
2 Type I
Non-Isolated
OBE
SSE
3
4
Isolated OBE
SSE
5
6 Type II
Non-Isolated
OBE
SSE
7
4.5 Input Motion
Fig. 7 shows floor response spectrum of OBE, SSE at the elevation of 144ft where main control room of NPP is located. Note that the peak acceleration responses of horizontal earthquake motion are distributed about 6-8 Hz frequency range, whereas vertical design ones are in higher frequency one(15-16Hz).
Fig 7. The Floor Response Spectra of Main Control Room of NPP at EL.144ft (OBE, SSE)
5
TESTS RESULTS AND DISCUSSION
5.1 Acceleration Comparison
The measured maximum floor accelerations for bare frame and isolated model under strong ground motions are presented in Table 2 & 3. With the provision of 3-D Isolation system, a significant reduction effect was seen under OBE & SSE. However there was a little difference between OBE and SSE reduction ratio, whereas Type II shows 10% more acceleration reduction effect compared to Type I.
Reduction ratio =
isolation on without accelerati max isolation on with accelerati max 1!
Table 2. The Maximum Response Acceleration according to Height of the Cabinet (Horizontal Direction)
Top Acc (g) Mid Acc (g) Bottom Acc (g)
Input
Motion Type Isolated
Non-isolated Reduction ratio (%) Isolate d Non- isolated Reduction
ratio (%) Isolated Non-isolated
Reduction ratio (%)
Type I 1.055 0.240 7 7 1.035 0.175 8 3 0.785 0.111 8 6
OBE
(0.554g) Type II 0.977 0.184 8 1 1.357 0.162 8 8 0.560 0.140 7 5
Type I 1.887 0.242 8 7 1.626 0.210 8 7 0.841 0.114 8 6
SSE
(0.753g) Type II 1.859 0.165 9 1 1.804 0.134 9 2 0.732 0.104 8 6
Table 3. The Maximum Response Acceleration (Vertical Direction)
Left side Acc (g) Right side Acc (g)
Input
Motion Type Isolated Non-isolated Reduction ratio
(%) Isolated Non-isolated Reduction ratio (%)
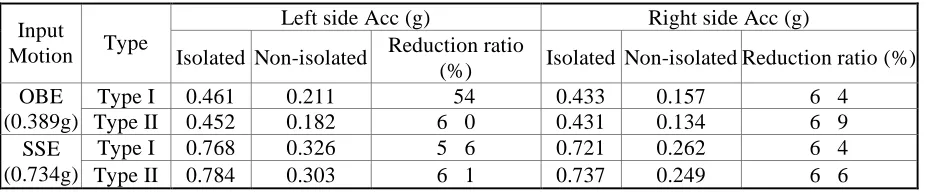
Type I 0.461 0.211 54 0.433 0.157 6 4
OBE
(0.389g) Type II 0.452 0.182 6 0 0.431 0.134 6 9
Type I 0.768 0.326 5 6 0.721 0.262 6 4
SSE
0.1 1 10
0.0 0.5 1.0 1.5 2.0 2.5 3.0 3.5 SSE-Vertical SSE-Horizontal S pe ct ra l A cc el er at io n ( g) Frequency (Hz)
0.1 1 10
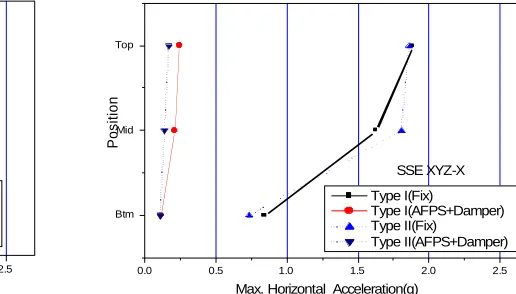
Fig. 8 shows maximum horizontal acceleration response of the cabinet with respect to the height. As the position goes high, more acceleration amplification was seen.
(a) OBE (b) SSE
Fig. 8 Max. Acceleration with respect to Cabinet Height (Horizontal Direction)
5.2 Response Spectra Comparison
Fig. 9 ~ 12 show horizontal and vertical response spectra of Type I and Type II when SSE earthquake input motion was applied. By comparison with response spectra, predominant frequency range shifted to the low frequency range and maximum acceleration response was decreased when 3D isolation system was installed.
5.2.1 Type I
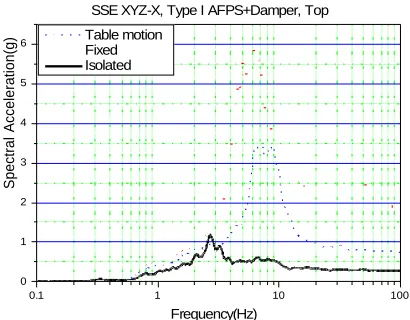
Fig. 9 shows the response spectrum with or without 3D isolation system at the top of the cabinet during SSE input motion.
At the upper part of the cabinet, the response is greatly amplified in the case of non-isolation. The predominant frequency is near the 7~8Hz range, and the maximum spectral acceleration was 6.1g, showing an amplification of 79% in comparison to the input earthquake.
With 3D isolation system, the predominant frequency was decreased to 3 Hz. The max acceleration was 1.1g, which shows 81% reduction when compared to non-isolation.
The vertical response spectrum which was measured at the bottom part of the cabinet is shown in Fig 10. The vertical response spectrum is derived from calculating the average of the two values obtained by measuring the lower left and lower right side of the cabinet. The maximum response acceleration in the case of non-base isolation is 3.0g (predominant frequency at 10.8 Hz), and in the case of 3D isolation system, the acceleration was 1.26g (predominant frequency at 3.1 Hz) which shows 58% reduction effectiveness.
The vertical isolation is controlled by the air springs. It showed its max response acceleration at the predominant frequency (3.1 Hz) which is very close to the natural frequency of an air spring.
Btm Mid Top
0.0 0.5 1.0 1.5 2.0 2.5
OBE XYZ-X
Max. Horizontal Acceleration(g)
P
o
s
it
io
n
Type I(Fix)
Type I(AFPS+Damper) Type II(Fix)
Type II(AFPS+Damper)
Btm Mid Top
0.0 0.5 1.0 1.5 2.0 2.5
SSE XYZ-X
Max. Horizontal Acceleration(g)
P
o
s
it
io
n
Type I(Fix)
Type I(AFPS+Damper) Type II(Fix)
0.1 1 10 100 0 1 2 3 4 5 6
SSE XYZ-X, Type I AFPS+Damper, Top
S p e c tr a l A c c e le ra ti o n (g ) Frequency(Hz) Table motion Fixed Isolated
0.1 1 10 100
0 1 2 3 4 5 6
SSE XYZ-Z, Type I AFPS+Damper, Vertical
S p e c tr a l A c c e le ra ti o n (g ) Frequency(Hz) Table motion Fixed Isolated
Fig. 9 Horizontal Response Spectra (Type I, SSE) Fig. 10 Vertical Response Spectra (Type I, SSE)
5.2.2 Type II
Fig. 11 shows the response spectrum with or without 3D isolation system at the top of the cabinet during SSE input motion.
At the upper part of the cabinet, the response is greatly amplified in the case of non-isolation. The predominant frequency is near the 7~8Hz range, and the maximum spectral acceleration was 6.4g.
With 3D isolation system, the predominant frequency was decreased to 2.8 Hz. The max acceleration was 0.65g, which shows 89% reduction effectiveness when compared to non-isolation. Comparison with Type I, Type II showed 4% increased acceleration at the top of the cabinet without isolation, 40% decreased with 3D isolation system.
The vertical response spectra which was measured at the bottom part of the cabinet is shown in Fig. 12. The maximum response acceleration in the case of non-base isolation is 2.8g (predominant frequency at 10.8 Hz) and in the case of base 3D isolation system, the acceleration was 1.30g (predominant frequency at 3.3 Hz) which shows 53% reduction effectiveness. In vertical direction, There was a little difference between Type I and Type II.
0.1 1 10 100
0 1 2 3 4 5 6
SSE XYZ-X, Type II AFPS+Damper, Top
S p e c tr a l A c c e le ra ti o n (g ) Frequency(Hz) Table motion Fixed Isolated
0.1 1 10 100
0 1 2 3 4 5 6
SSE XYZ-Z, Type II AFPS+Damper, Vertical
S p e c tr a l A c c e le ra ti o n (g ) Frequency(Hz) Table motion Fixed Isolated
6
CONCLUSION AND SUMMARY
To evaluate floor isolation effectiveness of 3-D isolation system, several seismic shaking table tests with or without isolation system were conducted. As a result of tests, both types have showed large reduction effect according to input earthquake signals, but Type II showed larger acceleration reduction effect compared to Type I. And it showed large seismic reduction effect when subjected to long periodic earthquake motions. In vertical direction, there was an obvious predominant frequency drift phenomenon to the natural frequency of an air spring whereas there was no clear frequency drift effect in horizontal one.
REFERRENCE
[1] V. Lambrou and M.C. Constantinou, “Study of Seismic Isolation Systems for Computer Floors” Technical Report NCEER-94-0020, National Center for Earthquake Engineering Research, State University of New York at Buffalo, NY, July, 1994.
[2] Japan Nuclear Power Engineering Testing Center, “The Present Status of the Testing of the Reliability of the Nuclear Power Plant Facility,” 1989.
[3] Kim, M.K., Jeon, Y.S., Choi, I.G. and Seo, J.M., “An Analysis of the Earthquake Resistance of the Nuclear Power Plant Facilities using the Base Isolation Device,” KAERI/TR-2765/2004, Korea Atomic Energy Research Institute, May 2004.
[4] Kim, Young Joong, Geo, Young Cheol, Kim, Byung Heon, “A Study of the Characteristics of the FPS,” Earthquake Engineering Society of Korea Autumn Conference Journal, 2002, pp. 407~414, 2000.
[5] Lee, K.J., Kim, G.S. and Suh, Y.P, “An Experimental Assessment of the Mechanical Characteristics of the Base Isolation of the FPS,” Earthquake Engineering Society of Korea Autumn Conference Journal, 2003.