ISSN(Online): 2320-9801 ISSN (Print): 2320-9798
I
nternational
J
ournal of
I
nnovative
R
esearch in
C
omputer
and
C
ommunication
E
ngineering
(A High Impact Factor, Monthly, Peer Reviewed Journal) Website: www.ijircce.com
Vol. 7, Issue 8, August 2019
Performance Analysis of Maximum Eigen
Value and Energy Detection Techniques
Aayushee kasera
1, Aparna singh kushwah
2M.E. Scholar, UIT-RGPV, Bhopal, India1
Assistant Professor, UIT-RGPV, Bhopal, India2
ABSTRACT: The main motive to design this implementation to analysis Cognitive Radio technology (CR) is spectrum sensing. The characteristic of this spectrum sensing the electromagnetic atmosphere to settle in their operation for better radio operating parameters. One of the challenges for CR is to detect the primary users present over the spectrum. That presents the Maximum Eigen value Based energy detection and .Also highlighted the effect of different parameters like number of samples, signal to noise ratio in addition apply comparison between the two methods using the simulation technique. In this paper describe spectrums sensing technique but the main work is carried for energy detection methods. Energy detection technique is implemented using MATLAB simulation and the obtained results are plotted using MATLAB simulation The performance of these two methods is evaluated in terms of their Receiver Operating Characteristics (ROC curves) and their detection probability for different values of Signal to Noise Ratio (SNR) and of smoothing factor L. OR rule and rule majority rule also discussed.
KEYWORDS: Energy Detection. Maximum Eigen Value , CR, OR Rule, AND Rule, Majority Rule
I. INTRODUCTION
ISSN(Online): 2320-9801 ISSN (Print): 2320-9798
I
nternational
J
ournal of
I
nnovative
R
esearch in
C
omputer
and
C
ommunication
E
ngineering
(A High Impact Factor, Monthly, Peer Reviewed Journal) Website: www.ijircce.com
Vol. 7, Issue 8, August 2019
x (t) = w(t), H0 (Primary User absent)
x (t) = h * n(t) + w(t), H1 (Primary User present)
Figure 1. Illustrates a spectrum sensing scenario with a secondary cognitive radio
II. RELATED WORK
The Energy Detection (ED) technique is a popular narrow band detection method that is widely employed in the literature. ED compares the signal energy received in a certain frequency band to a properly set decision threshold. If the signal energy lies above the threshold, the band is declared to be occupied. Otherwise, the band is assumed to be idle and could be accessed by secondary users. Owing to the generality of its operating principle, the performance of energy detection would not be expected to depend on the type of primary signal being detected, thus it is known as non-coherent spectrum sensing [9, 21, 26]. The major drawback of this method is that it has poor detection performance under low SNR scenarios and cannot differentiate between the signals from PUs and the interference from other cognitive radios. In following section, we will focus on a brief background of the ED, but we will elaborate more on those recent research activities and their associated problems and solutions.
Eigen value Detection Covariance Based Detection (CBD) is a group of narrowband spectrum sensing techniques that exploit aspects of statistical covariance matrixes; a received signal and noise can have different characteristics [36, 34, 37]. The distinguishing properties can be used to detect whether a primary user‟s signal exists or not. From the CBD a new detection technique was born known as Eigen value Based Detection (EBD). EBD is based on the analysis of eigenvalues of the covariance matrix and its key aspect that it can reduce the computational complexity, as compared to other blind algorithms Different EBD schemes use different characteristics of the covariance matrix eigenvalues. EBD techniques are blind because they do not require any a priori information of PU signals and/or the transmission channel. Thus, it overcomes problematic noise uncertainty encountered by other detectors. The different detection methods are: 1. Max-min eigenvalue detection in which the test statistic is defined as ratio of maximum to minimum eigenvalues of the received signal covariance matrix.
2. Energy with min eigenvalue, in which the test statistic is defined as ratio of average power of received signal to the minimum eigenvalue of the covariance matrix.
ISSN(Online): 2320-9801 ISSN (Print): 2320-9798
I
nternational
J
ournal of
I
nnovative
R
esearch in
C
omputer
and
C
ommunication
E
ngineering
(A High Impact Factor, Monthly, Peer Reviewed Journal) Website: www.ijircce.com
Vol. 7, Issue 8, August 2019
its transmission or reception parameters based on the interaction with the environment to communicate effectively without interfering with the licensed users
III. PROPOSED METHOD
In communication theory it is often assumed that the transmitted signals are distorted by some noise. The most common noise is Additive Gaussian noise, i.e. the so called Additive White Gaussian Noise channel, AWGN. Even though the noise in reality is more complex, this model is very efficient when simulating for example background noise or amplifier noise. Then the model can be complemented by e.g. impulse noise or other typical noise models that are out there. In this chapter we will have a closer look at AWGN channels and see how the previous theory applies here. We will derive a fundamental limit of the signal to noise ration (SNR) specifying when it is not possible to achieve reliable communication. Spectrum Sensing Model The algorithm of spectrum sensing depends on many parameters like number of samples, signal to noise ratio and noise uncertainty. It aims to make decision between two hypotheses (choose H0 or H1) based on the received signal.
H0: X (N) = W (N)...1 H1: X (N) = S (N) + W (N) ..2
Where N is number of samples, X(N) is the received signal , S(N) is the primary users signal, W(N) is the noise , H0 Gaussian noise (AWGN) with zero mean [4]. The key metric in spectrum sensing are the probability of correct detection probability of alarm (occurs when the channel is empty (H0) but spectrum sensor decides that the channel is occupied and probability of misdetection occurs when the channel is occupied (H1) but spectrum sensor decides that the channel
Unoccupied [5] A signal in a digital communication system can be represented as by a continuous random variable. This value can be decomposed in two parts added together
Y = X + Z
Where X is the information carrier component and Z noise component. The average power allocated by the variable X is defined as the second moment,
P = E[ X2]
A Gaussian channel is a time-discrete channel with input X and output Y = X + Z, where Z models the noise and is Normal distributed,
The communication signalling is limited by a power constraint on the transmitter side,
E[ X2] ≤ P
Without the power constraint in the definition we would be able to choose as many signal alternatives as far apart as we like. Then we would be able to transmit as much information as we like in a single channel use. With the power constraint we get a more realistic system where we need to find other means that increasing the power to get a higher information throughput over the channel.1 To see how much information is possible to transmit over the channel we again maximizes the mutual information between the transmitted variable X and the received variable Y, with the side condition that the power is limited by P
ISSN(Online): 2320-9801 ISSN (Print): 2320-9798
I
nternational
J
ournal of
I
nnovative
R
esearch in
C
omputer
and
C
ommunication
E
ngineering
(A High Impact Factor, Monthly, Peer Reviewed Journal) Website: www.ijircce.com
Vol. 7, Issue 8, August 2019
γ=∫0tsx2(t)dt
For sampled-time real signals, the equation transforms into:
γ=∑n=0Ns-1xn2
The largest disadvantage of energy detection is the fact that the test statistic is as sensitive to noise power as to the signal power. In practice the noise power varies. Internal receiver noise changes with production tolerances, temperature and other environmental factors. Environment noise changes with time and location. This leads to a SNR wall [31], where a detector is incapable of reliably detecting a signal, regardless of the choice of Ns, when signal power is small compared to noise power.
B-MATCHED FILTER DETECTION: The best sensing technique in AWGN environment without ant prior information about the signal is ED technique. If we considered the signal structure, then we can get best performance by using matched filter method. Matched filter is a linear filter which used to maximize signal to noise ratio in presence of additive noise. It provides coherent detection. A coherent detector uses the knowledge of the phase of the carrier wave to demodulate the signal. However, if there is noise uncertainty, the detection probability of the energy detection is much worse than that of the proposed method. The Pfa for the proposed method and the energy detection without noise uncertainty meet the requirement (Pfa 6 0.1), but the Pfa for the energy detection with noise uncertainty far exceeds the limit. This means that the energy detection is very unreliable in practical situations with noise uncertainty
C-EIGENVALUE-BASED DETECTION: Eigen value-based detection methods are closely related to covariance-based detection. These methods attempt to trade off some of the simplicity for better signal detection performance [4]. Here, the test statistic is based on eigenvalues λl of the covariance matrix R, ordered by their absolute value:
|λ0| ≥ |λ1| ≥ … ≥ |λL-1|
Eigen value calculation requires on the order of L3 operations, however since L is typically small compared to Ns,
IV. SIMULATION RESULTS
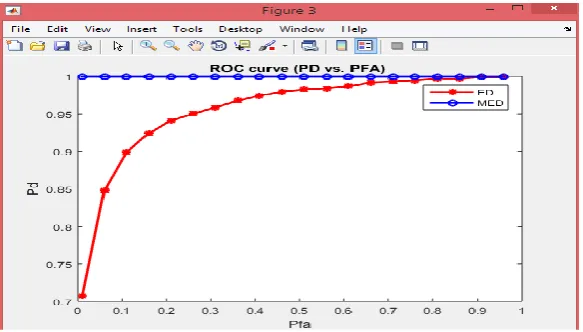
With a view to verify the hypothesis simulation was made. In the simulation study input random bit stream is multiplied by 1 MHz sinusoidal carrier signal to get 1 MHz BPSK modulated signal, which is transmitted in AWGN channel. The detection performance can be performed by varying the probability of false alarm from 0 to 1 and finding the probability of detection by using Monte Carlo simulation for each case, theoretically as shown in Figure 3.3. Here the number of sample points taken is N=2000(N=2TW) and SNR is -30Db
PERFORMANCE CRITERIA: The performance of spectrum sensing techniques can differ in different scenarios. Hence, it is imperative to evaluate and chose the most adequate scheme for a given scenario. Different characteristics that can be used to evaluate the sensing algorithms are discussed in this section.
PROBABILITY OF FALSE ALARM: It is the probability that the detector declares the presence of the PU, when the PU is absent. Considering a binary hypothesis test. There are two types of errors that can be made, type I and type II errors, respectively. A type I error is made if H1 is accepted when H0 is true. The probability of making a type I error is often called the probability of false alarm (Pfa= Prob {Decision= (H1/ H0)}), which is a significant design parameter since false alarms lead to missing spectral opportunities. Therefore, controlling the probability false alarm is crucial for efficient spectrum usage.
ISSN(Online): 2320-9801 ISSN (Print): 2320-9798
I
nternational
J
ournal of
I
nnovative
R
esearch in
C
omputer
and
C
ommunication
E
ngineering
(A High Impact Factor, Monthly, Peer Reviewed Journal) Website: www.ijircce.com
Vol. 7, Issue 8, August 2019
can lead to collisions with the PU transmission and hence, reduced rate for both the PU and SU, respectively. Establishing distributions of decision statistics helps in controlling the probabilities of missed detection and false alarm. Based on the previous stated two points, it worth mention that on the whole, a CR system ought to satisfy constraints on both the false alarm and missed detection probability
SIGNAL-TO-NOISE-RATIO (SNR): Type I and type II errors are linked to each other through sensing time, SNR, and detection threshold. The SNR at the SUs depends on the PU transmit power and the spectrum environment. The detection performance improves with an increase in the SNR.
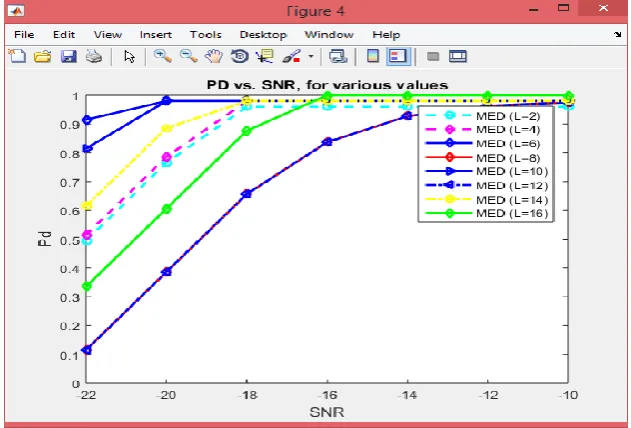
Fig. 1. PD vs. SNR, for various values of smoothing fact
ISSN(Online): 2320-9801 ISSN (Print): 2320-9798
I
nternational
J
ournal of
I
nnovative
R
esearch in
C
omputer
and
C
ommunication
E
ngineering
(A High Impact Factor, Monthly, Peer Reviewed Journal) Website: www.ijircce.com
Vol. 7, Issue 8, August 2019
Fig. .2 PD vs. SNR, for various values of energy detection
The results are taken for = 0.1 , and SNRs varying from -22dB to -14dB. It is shown that the detection performance becomes better when increases However, when turns to 48, the performance detection declines. Therefore, should be relatively small while using this technique for a given number of samples. Therefore, choosing a proper temporal smoothing factor for a given number of samples is important. Figure 3 shows the performance comparison of the optimal-detection technique, the MED detection and energy detection. In MED detection, 4 receiving antennas are used for sensing in the radio environment while the optimal detector has a temporal smoothing factor of 16.
Fig. 3 PD vs. SNR, for various values of energy detection and MED
ISSN(Online): 2320-9801 ISSN (Print): 2320-9798
I
nternational
J
ournal of
I
nnovative
R
esearch in
C
omputer
and
C
ommunication
E
ngineering
(A High Impact Factor, Monthly, Peer Reviewed Journal) Website: www.ijircce.com
Vol. 7, Issue 8, August 2019
Fig.4 PD vs. PMD, for various values of energy detection and MED
Next energy detection mechanism was analyzed. The graph of Pmd values on X-axis and probability of false alarm on Y-axis shown in the Figure 4.The graph shows that simulation and theoretically values of probability of detection for different values of SNR curves. Here we have taken probability of false alarm is 0.1 missed detection and number of sample points N=10.from the figure it is observed that performance is better at higher SNR the ROC curves of the „AND‟ and the „OR‟ rule and majority rule ,. Each user has a SNR of -2db. As shown in Fig.7, the OR rule has better detection performance than the AND rule,
Fig.5 The ROC curves of the „AND‟ and the „OR‟ rule and majority rule
V. CONCLUSIONS
ISSN(Online): 2320-9801 ISSN (Print): 2320-9798
I
nternational
J
ournal of
I
nnovative
R
esearch in
C
omputer
and
C
ommunication
E
ngineering
(A High Impact Factor, Monthly, Peer Reviewed Journal) Website: www.ijircce.com
Vol. 7, Issue 8, August 2019
Discussed. The future of wireless communications will be characterized by highly varying environments with multiple available radio access technologies exhibiting diverse features. So cognitive radio is a paradigm for new wireless communications to meet their standards.
The energy detector performance can be improved by increasing the SNR values and by increasing the number of sample points the detection performance is much better even at lower SNR values. The detection performance can be improved by using dynamic threshold based spectrum detection algorithm in cognitive radio systems. Energy detection based on fixed threshold are sensitive to noise uncertainty, a fractional change of average noise power causes decreasing the performance quickly. Matched filter which not sensitive to noise uncertainty, by using dynamic threshold the performance can be improved as compared with the fixed threshold.
REFERENCES
1. Roshdy Abdelrassoul, SM IEEE et.al.Comparative Study of Spectrum Sensing for Cognitive Radio System Using Energy Detection over Different Channels 2016 World Symposium on Computer 978-0-7695-5832-5/16 $31.00 © 2016 IEEE DOI 10.1109/WSCAR.2016.13 2. Mesut Do÷an, Gönül Turhan-Sayan Target Detection by Energy Features Extracted from Simulated Ultra Wideband Radar Signals
978-1-5090-6494-6/17/$31.00 ©2017 IEEE
3. Cheng Jiang The Face Detection Algorithm Based on Local Elastic Potential Energy Feature- 978-1-5386-2062-5/17/$31.00 ©2017 IEEE 4. Haykin S., Thomson DJ., Reed J.H.,"Spectrum Sensing for CognitiveRadio", Proceedings of the IEEE, Vol 97, pp.849-877, 12 May 2009. 5. Herath S.P., Rajatheva N., Tellambura C., "Energy Detection of Unknown Signals in Fading and Diversity Reception", IEEE Transaction on
Communication Vol. 59, No. 9, September 2011, pp. 2443 – 2453.
6. Shahzad A. Malik, Madad Ali Shah, Amir H. Dar, Anam Haq, Asad Ullah Khan, Tahir Javed, Shahid A. Khan, „„comparative Analysis of Primary Transmitter Detection Based Spectrum Sensing Techniques in Cognitive Radio Systems”Australian Journal of Basic and Applied Sciences, 4(9): 4522-4531, 2010
7. Kyouwoong Kim; Akbar, I.A.; Bae, K.K.; Jung-Sun Um; SpoonerC.M.; Reed, J.H. "Cyclostationary Approaches to Signal Detection and Classification in Cognitive Radio", New Frontiers in DynamicSpectrum Access Networks, 2007. DySPAN, 2nd IEEE International Symposium, pp. 212- 215, 17-2- April 2007.
8. H.Urkowitz, “Energy detection of unknown deterministic signals,” Proceedings of the IEEE, vol.55 no. 4, pp. 523-531, 1967.
9. F. F. Digham et al., “On the Energy Detection of Unknown Signals over Fading Channels,” in Proceedings of the IEEE International Conference on Communication, Seattle, Washington, USA, 2003, pp3575-357
10. .Ying Loong Lee ,Wasan Kadhim Saad, Ayman Abd ElSaleh,Mahamod Ismail," Improved Detection Performance of Cognitive Radio Networks in AWGN and Rayleigh Fading Environments", Journal of Applied Research and Technology
11. .H.Semlali, A.Maali, N.Boumaaz, A.Soulmani, A.Ghammaz, J.F.Diouris,“Spectrum Sensing Operation based on a Real Signal of FM Radio: Feasibility Study using a Random;‟‟ International Conference on Information Technology for Organizations Development, IT4OD 2016, Mar 2016, Fez, Morocco.
12. Sahai and D. Cabric, “Spectrum sensing: fundamental limits anpractical challenges,” in IEEE International Symposium on New Frontiersin Dynamic Spectrum Access Networks (DySPAN ‟05), Baltimore, Md, USA, November 2005.
13. R. Tandra and A. Sahai, “Fundamental limits on detection in low SNR under noise uncertainty,” in Proceedings of the International Conference on Wireless Networks, Communications and Mobile Computing (WirelessCom ‟05), vol. 1, pp. 464–469, Maui, Hawaii, USA, June 2005. 14. T.Yucek and H.Arslan,‟‟ A survey of spectrum sensing algorithms for cognitive radio applications,‟‟ IEEE Communications Survey &
Tutorials,Volume 11, Number 1, 116-130, First Quarter 2009