Article
1
Information usage behavior and importance:
2
Korean scientist and engineer users of a personalized
3
recommendation service
4
Jung-Hoon Park 1, Seong Eun Park 2,Hee-Seok Choi 3, Yun-Young Hwang 4*
5
1 Korea Institute of Science and Technology Information; [email protected]
6
2 Korea Institute of Science and Technology Information; [email protected]
7
3 Korea Institute of Science and Technology Information; [email protected]
8
* Correspondence: [email protected] Tel.: +82-42-869-1744 (Republic of Korea)
9
10
Abstract: Background: We conducted research on the newly developed personalized
11
recommendation service (PRS) of the global network of Korean scientists and engineers (KOSEN)
12
in order to explore the information usage behavior and importance of the PRS used by Korean
13
scientists and engineers. Methods: In order to understand information usage behavior, we gathered
14
data from 513 survey results and analyzed them in terms of information usage behavior and the
15
corresponding importance in each of the service quality areas. Results: We analyzed the 321
16
outcomes that indicated non-use of the PRS in order to understand the underlying reason(s); we
17
employed 192 results that demonstrated the use of functionality to examine information usage
18
behavior and importance. They found that the predominant motive for non-use of the service
19
resulted from the respondents not knowing how to use it. According to demographic characteristics,
20
the usage behavior of the PRS showed a difference regarding the purpose of using the service in the
21
categories of gender and major field of study. Furthermore, users were concerned with various
22
components of the PRS such as ease of use, design, relevance of content, user support, and
23
interactivity. Conclusions: We suggest reinforcing user education degree and promotion to enhance
24
the PRS. Since users were concerned with ease of use, design, relevance, user support, and
25
interactivity, we recommend these as major points for improvement.
26
Keywords: personalized recommendation service; usage behavior; KOSEN
27
28
1. Introduction
29
1.1. Background and purpose of the research
30
As information is produced, reproduced and expanded exponentially, users are able to obtain it
31
through a variety of routes, but their exposure to an excessive amount of material poses a challenge
32
to acquiring the knowledge they desire, and they waste a lot of time accessing content that does not
33
meet their needs. Korean online service providers of academic, scientific information offer limited
34
functions that categorize research results in various forms and aggregate them from different fields
35
of study, but only in terms of the date published. This technological hindrance demands time and
36
effort from users when acquiring the facts they want, since they have to use approaches (such as
37
filtering) to extract the appropriate information from the vast amount of data available. This problem
38
also causes past research that a user in a specific field might find relevant to be buried under more
39
recent knowledge. The authors of this study researched a personalized recommendation service
40
(PRS), which overcomes the abovementioned obstacles and provides users with sufficient
41
information. Since March of 2017, the Global Network of Korean Scientists and Engineers (KOSEN,
42
www.kosen21.org), an academic science information platform that is the focus of this study, has
43
operated a PRS based on big data; it automatically provides users with appropriate service menus
44
and content based on their individual characteristics. The authors investigated the information usage
45
behavior of people who use KOSEN’s PRS and analyzed the outcomes based on quality of service,
46
thereby proposing a method to improve the system.
47
This study allows the system to be enhanced in a way that boosts the quality of service and
48
reduces the time users need to acquire pertinent knowledge. Furthermore, it helps to prolong the
49
lifecycle of valuable information by identifying older data that could apply to users in their respective
50
fields, but which do not appear at the top of the search results. Chapter 2 examines the theoretical
51
background of the PRS and the existing literature. Chapter 3 introduces the research on and analysis
52
of user information behavior, while Chapter 4 deduces the implications and points of improvement,
53
based on the outcomes of Chapter 3. The conclusion reviews the significance of this study and
54
suggests directions for future research.
55
1.2. Objective of the research
56
This study analyzes the current state of use, as well as the usage trends of, Korean scientists and
57
engineers who access the PRS, the goal being to understand their information usage behavior and
58
satisfaction rate. In terms of usage trends, the authors examined the effects of users’ demographic
59
traits (age, gender, education level, major, and occupation) on such trends in addition to awareness,
60
satisfaction rate, expectations, and the correlations among these components.
61
RQ1. Do the usage behaviors of PRS users show variance according to their demographic
62
characteristics?
63
RQ2. Does the satisfaction rate for the service’s three areas of quality (system, content, and
64
service support) show variance according to users’ demographic features?
65
RQ3. What are some priorities and key concerns of users regarding the service, and is there a
66
significant correlation among the three areas of quality pertaining to them?
67
68
2. Theoretical framework
69
2.1. Existing literature
70
The research on the PRS in the field of library and information science is scarce, both in Korea and
71
abroad. This may be due to a lack of research on the PRS (for academic information) in this field of
72
study. Existing pieces of literature relevant to the present study include those pertaining to science and
73
technology researchers’ information usage behavior, the PRS, and users’ satisfaction rate with it.
74
2.1.1. The information behavior of scientists and engineers
75
The research on the information behavior of scientists and engineers can be classified broadly into
76
that of scientists and engineers, undergraduate students, and graduate-students.
77
Brown (1999)[6] used a survey to analyze the information search behavior of astronomers,
78
chemists, mathematicians, and physicists at Oklahoma University. The results revealed that scientists
79
and engineers rely heavily on academic journals to support their investigations and creative activities.
80
An interesting observation was that despite the demand for more information services, most of the
81
researchers preferred to approach them via published – rather than electronic – media. Majid et al.
82
(2000) [9] asserted that the information knowledge and seeking behavior of scientists and engineers
83
plays an important role in efficiently satisfying information requests, and suggested that libraries could
84
use this knowledge to re-arrange their collections and facilities according to the requests of the scientific
85
community. Furthermore, their findings illustrate that scientists and engineers prefer major information
86
sources, especially journals and review articles.
87
To develop and assess a medical information system that reflects the information seeking behavior
88
of doctors, Kim (2016)[43] carried out in-depth interviews with doctors on their information usage
89
behavior in order to develop a knowledgeable source that could adequately fulfill their information
90
requests; the results were reflected in a search system called MediSearching. The interview outcomes
91
showed a difference in information usage behavior according to type of hospital or area of
92
research and used academic journals as their predominant means of obtaining data, doctors at private
94
and special hospitals mostly received requests in terms of medical treatment, and satisfied their needs
95
by having conversations with their fellow physicians.
96
In his research on the information usage behavior of science and engineering students at the
97
undergraduate and graduate levels, Fidzani (1998)[8] studied the information seeking behavior and
98
usage of information resources by graduate students at the University of Botswana. His overall
99
objective was to identify requests and understand students’ degree of awareness regarding library
100
services. He collected the experiential date on the graduate students’ information requests, and
101
observed that a guideline for utilizing library resources and services was necessary in order to meet
102
some of the requests.
103
Lee (2016)[44] studied the entire processes of an information service with the actual users as the
104
subjects in order to acquire the basic data to develop a service based on the users’ traits and requests,
105
the goal being to revitalize university library information services. The outcomes indicated that critical
106
components of an effective service include the user’s information and an analysis of the themes,
107
successful consultation, communication techniques, and the information provider’s awareness and
108
ability.
109
2.1.2. The PRS and relevant studies
110
Yoo (2017)[45] defined a recommendation system as a service that utilizes a user’s information or
111
the content to select and present content that may be relevant to him/her, thereby reducing the user’s
112
effort in looking for pertinent data from the vast amount of material available. The R&D of the PRS
113
began in the late 1990s, starting with the filtering technique, which was used for news and webpages.
114
Recommendation techniques have become increasingly refined and sophisticated since the 2016
115
competition hosted by the American company Netflix. Research on increasing the relevance of
116
recommendations and the efficacy of services is ongoing.
117
Research on recommendation techniques has a relatively long history. The most prominent
118
methods include demographic recommendations, content-based filtering, collaborative filtering, and
119
hybrid filtering (which combines two approaches that complement the other’s limitations) (Jung and
120
Lee, 2005).[14] Content recommendation systems primarily use content-based recommendation
121
algorithms, as well as collaborative filtering algorithms. Since recommendation techniques that employ
122
collaborative filtering showed significantly superior outcomes in terms of accuracy compared to those
123
with content-based filtering in the Netflix competition, the most recent studies have focused on the
124
former.
125
Personalization is a broad concept used to signify providing data that corresponds to information
126
requested by the user. Personalization can be classified as passive and active. The former offers the user
127
relevant information or products based on his/her profile during the process of the information search
128
that he/she has designated. It is primarily explored in information searches on word ambiguity and
129
similar topics. Regarding the latter type, the service provider offers the user pertinent information based
130
on his/her profile, which reflects his/her preferences as new data becomes available, before the user
131
makes a request. It can be categorized as a PRS and is mainly studied in data mining (Kim, 2002). [12]
132
In his investigation of computer science, Kim, B.M. et al. (2004)[11] stated that information filtering
133
can be classified into content-based and collaborate filtering techniques, and that the former uses
134
information from content, whereas the latter employs the opinions of other users. He focused on the
135
organic integration of both approaches in order to overcome the constraints of collaborative filtering,
136
and proposed a method that uses its framework and enforces it with an improved usage of user profiles.
137
Koh et al. (2017)[46] designed a smart mirror that uses IoT for a user personalization service. The smart
138
mirror harnesses information on the Internet to provide users with real-time traffic data, news,
139
schedules, and weather updates. It can also offer recommendation services by employing a user’s usage
140
history.
141
In the field of library and information science, Kim (2006)[47] investigated a hybrid
142
recommendation system for multimedia content based on frequency of use, and proposed a system that
143
information centers). He analyzed the pros and cons of conventional recommendation techniques. To
145
solve their shortcomings, he put forward a hybrid recommendation system that employs the user’s
146
frequency of use of content in a high-volume content environment. Park (2016)[48] suggested book
147
curation as an information service that a school library webpage could offer, and derived the criteria
148
for the curation, which are needed to design the system. In order to derive twelve criteria for
149
recommendations, he examined a list of suggested books in a pre-existing system, and analyzed
150
properties in the user information, as well as book information that could be used for the
151
recommendation service. A survey that looked at users’ preferences for each of the criteria showed that
152
most students believed that libraries need book curation services.
153
2.1.3. The satisfaction rate of information service users
154
Investigations pertaining to user satisfaction comprise an active field in terms of academic
155
research, which is dealt with in various fields of study. The following is a survey of relevant studies to
156
this paper’s theme and pertains to user satisfaction in the field of the library information provision or
157
academic information service.
158
Martensen and Gronholdt (2003)[28] described the development and application of a model that
159
enables librarians to quantitatively measure quality, satisfaction rate, and user loyalty, and examined
160
the degree to which collection, service, and environment affect the aforementioned elements.
161
Khan and Shafique (2011)[27] examined the role and importance of departmental libraries in
162
satisfying students’ information requests. They assessed the satisfaction rate of users of departmental
163
library services; the outcomes showed that most of the surveyees were satisfied with virtually all of the
164
services provided by the departmental libraries. Furthermore, most of the surveyees requested more
165
computers, digital collections, magazines, and newspapers from departmental libraries.
166
Seeholzer and Salem (2011)[26] examined expectations and satisfaction rates at Kent State
167
University’s library website by focusing on both groups and individuals. The participants interacted
168
with the library’s resources and services using a mobile website to a degree that surpassed expectations.
169
The results revealed that the participants were employing the mobile website to use the research-related
170
database, library catalogues, and reference system; they were also interested in contacting the library
171
using text messages.
172
An analysis of the relevant research on the information behavior of scientists and engineers, the
173
PRS, and user satisfaction with information services indicates a need to periodically investigate users’
174
information requests, as well as to evaluate the collection and service usability of the science technology
175
information service. This study examines the information usage behavior of users of KOSEN’s PRS in
176
order, and proposes improvements to the system based on the findings.
177
2.2. Overview of KOSEN and PRS
178
2.2.1. Overview of the KOSEN (The global network of Korean scientists and engineers)
179
KOSEN, an academic science information platform that is the subject of this study, was created as
180
part of the Internationalization Foundation Construction Project by the Ministry of Science and
181
Technology in order to connect Korean scientists and engineers dispersed throughout the globe in
182
cyberspace. Korean scientists and engineers abroad can obtain news from science and engineering
183
circles in Korea through KOSEN, and can contribute to their development by providing advanced
184
information from overseas. Moreover, scientists and engineers in Korea can acquire such data promptly
185
and establish a network that enables multi-dimensional exchanges, such as meeting prospective
186
partners for international joint research. Individual scientists and engineers can use the information
187
they find in KOSEN to enhance their own competence, the accumulation of which contributes to the
188
capacity of Korea’s national science and engineering society. With these goals in mind, KOSEN
189
launched its website in July 1999. As of December 2017, it has 130,000 active members. Since March of
190
2017, KOSEN has operated a PRS in-house based on big data that automatically provides users with
191
2.2.2. PRS of KOSEN
193
Since March of 2017, KOSEN has developed and operated a PRS based on big data that
194
automatically provides users with relevant service menus and content based on their individual
195
characteristics.
196
2.2.3. Item overview
197
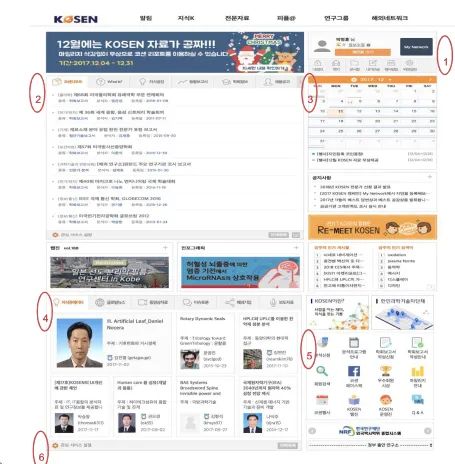
198
Figure 1. Item of KOSEN web Page.
199
200
1. Widget Service: A total of 14 service menus including messages, document folder, “My articles,”
201
and “My café.” The information pertaining to each service is provided at the time of login, and the user
202
is notified of new articles and related information at the time of posting.
203
2. Recommendation List Service: Provided after personalization is applied and after logging in.
204
Information from nine menus (laboratory information, academy information, business announcements,
205
KOSEN reports, trend reports, knowledge and sentiments forum, What is?, career opportunities,
206
analysis requests) is provided based on the most frequently accessed services in the user group to which
207
the user belongs.
208
1
2 3
4
5
3. Scheduler: Associates users with similar characteristics to derive preferred services of user
209
groups to announce academy information, business announcements, career opportunities, and KOSEN
210
timetables and events.
211
4. Card Service: Provided after personalization is applied and after logging in. Information from
212
11 menus (global news, knowledge curator, videos, overseas business trip support, overseas
213
enterprises, KOSEN webzine, current affairs and discussions, infographics, Korean community events,
214
activities, press releases), selected based on the services accessed most frequently in the user group to
215
which the user belongs, are provided in card format.
216
5. Image Service: This service constitutes 17 service menus that the administrator recommends in
217
order to encourage users to utilize the services. The services recommended to login and non-login
218
members are differentiated by the administrator settings.
219
6. Personalization Service Settings: User login activates the function to add a service in which the
220
user is interested to the PRS tab. Users can add or change services in which they are interested by
221
adjusting the settings.
222
223
3. Research and analysis of user’s information usage behavior
224
3.1. Design of the research instrument
225
Measured areas Measured indicators No. of
questions Remarks
User characteristics
1. Demographic
characteristics
1) Age
2) Sex
3) Educational attainment
4) Major
5) Occupation
5
Kang (2008),
Nam (2010)
2. Usage behavior
of personalized
recommendatio
n service
1) Whether to use personalized
recommendation service
2) Reason for non-use
3) Primary purpose of using it
4) Number of visits
5) Service usage time
5 Kang (2008), Nam (2010)
Personalized recommendation
service quality
1. System (website)
1) Design
2) Ease of use
3) Accessibility
3 Kang (2008)
2. Content
1) Adequacy
2) Sufficiency
3) Utility
3
Nam (2010),
Lee (2017)
3. Service support
1) User support
2) Interactivity 2
Kang (2008),
Nam (2010)
Personalized recommendation
service importance
1. Importance for each personalized recommendation
service area 1 Nam (2010)
Table 1. Composition of the questionnaire
226
227
As shown in Table 1, the survey questions – which were designed to assess the information
228
(2) PRS quality, and (3) PRS importance. The first dimension consists of ten questions under two
230
categories designed to assess users’ traits and PRS usage behavior. The second area comprises nine
231
questions under three categories designed to assess the system (homepage), content, and service
232
support. Third, PRS importance consists of one question designed to understand the elements of the
233
PRS that the user deems to be important. The questionnaire for evaluating PRS quality and PRS
234
Importance used a five-point assessment system.
235
3.2. Research subjects and methodology
236
KOSEN users were selected as the research subjects. Although some KOSEN users do not use
237
the PRS, the reasons for non-use are accounted for in Chapter 4, which discusses methods for
238
improving the service.
239
To investigate the information usage behavior of KOSEN’s PRS, the authors sent online surveys
240
to KOSEN users who consented to receiving e-mail communication. The authors gathered data for
241
two weeks from March 6th to March 14th, 2018 utilizing Google Docs. A total of 513 users responded;
242
the authors analyzed the data from the 321 users who do not use the service as well as the 192 users
243
who do.
244
The authors employed SPSS 23.0 to analyze the data. The steps of analysis were as follows: (1)
245
The authors performed factor analysis and reliability tests on the survey questions, which served as
246
the instrument of measurement. Secondly, the authors analyzed user behavior, overall satisfaction
247
rate, the basic statistical data from the assessment of the quality of service, and basic statistical data
248
on importance. Thirdly, the authors conducted a t-test and ANOVA to examine the overall
249
satisfaction rate per different categories such as gender, education level, and major field of study.
250
Lastly, the authors conducted correlation analysis to investigate the correlation between system,
251
content, service support, and overall satisfaction rate. They also performed multicenter retrospective
252
analysis to explore the degree of influence.
253
3.2. Research subjects and methodology
254
3.2.1. Factorial and reliability analysis of the measurement instrument
255
In order to assess the reliability of the collected data, the authors used Cronbach’s alpha
256
coefficient to analyze the internal consistency reliability of the survey questions. Table 2 shows the
257
results of the reliability assessment.
258
259
Area and number of items Factor Cronbach’s alpha
System (3)
Ease of use .750
Design .863
Content (3)
Sufficiency .794
Adequacy .744
Service support (2)
User support .861
Interactivity .810
Table 2. Internal consistency reliability analysis of the independent variables
260
261
Using the factor analysis, the authors grouped the three system components, the three content
262
components, and the two service support components in order to simplify the variables. They
263
conducted factor rotation using Verimax rotation (which is an orthogonal rotation), as well as the
264
outcome was adequate. Since the KMO value was 0.839, the authors deemed the research request to
266
be adequate. Next, in the test to verify whether Bartlett’s factor analysis would be sufficient, the value
267
obtained was significantly smaller than 0.95, which indicates that the use of factorial analysis was
268
appropriate. The results of the factor analysis showed that there were two service support
269
components: user support and interactivity.
270
Cronbach’s alpha tests reliability by testing the probability of obtaining the same value when
271
the measurement is conducted again for the same concept. In academic papers, a value greater than
272
0.6 conventionally guarantees reliability. Thus, the internal consistency reliability has been
273
guaranteed. In terms of the system components, ease of use has a reliability value of 0.750,
274
demonstrating a normal level of reliability. Design has a reliability value of 0.863, indicating a high
275
level of reliability. Lastly, accessibility has a reliability value of 0.765, which signals a normal level of
276
reliability. In terms of the content components, sufficiency has a reliability value of 0.794, revealing a
277
normal level of reliability. Adequacy has a reliability value of 0.744, which reflects a normal level of
278
reliability. Lastly, utility has a reliability value of 1.000, displaying a very high level of reliability.
279
Third, for service support components, user support has a reliability value of 0.861, indicating a high
280
level of reliability. Lastly, interactivity has a reliability value of 0.810, which suggests a high level of
281
reliability.
282
Furthermore, the authors conducted descriptive statistical analysis to obtain the descriptive
283
statistical values of the variables.
284
285
N Min Max Mean Standard
deviation Skewness Kurtosis
Ease of use 192 1 5 3.72 .786 -.378 .675
Design 192 1 5 3.58 .828 -.252 .155
Accessibility 192 1 5 3.54 .734 .157 .319
Sufficiency 192 1 5 3.71 .768 -.366 .705
Adequacy 192 1 5 3.85 .739 -.471 .518
Utility 192 1 5 3.51 1.008 -.309 -.313
User support 192 1 5 3.41 .818 .028 -.190
Interactivity 192 1 5 3.60 .766 -.196 .244
Importance 192 1 5 3.92 .712 -.203 -.627
Table 3. Result of the descriptive statistics
286
287
3.2.2. Basic statistical analysis
288
The authors employed basic statistical analysis to investigate the characteristics of the surveyees,
289
their usage behavior of the PRS, and reason(s) for non-use in order to understand the overall usage
290
trends of the service users. The investigation of the characteristics included demographic components
291
such as age, gender, education level, major field of study, and occupation. The outcomes are shown
292
in Table 4.
293
294
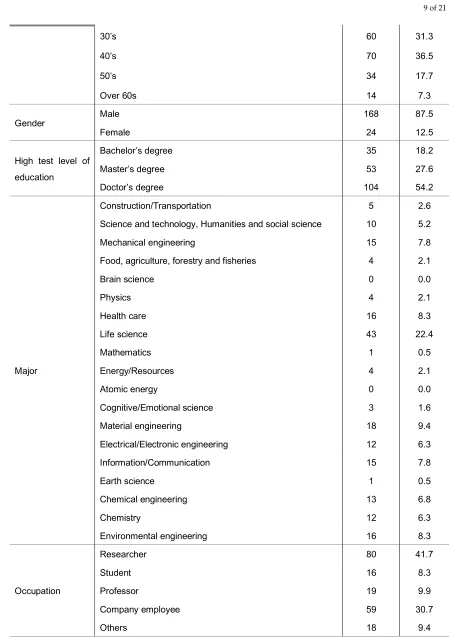
295
variables Items frequency %
30’s 60 31.3
40’s 70 36.5
50’s 34 17.7
Over 60s 14 7.3
Gender
Male 168 87.5
Female 24 12.5
High test level of
education
Bachelor’s degree 35 18.2
Master’s degree 53 27.6
Doctor’s degree 104 54.2
Major
Construction/Transportation 5 2.6
Science and technology, Humanities and social science 10 5.2
Mechanical engineering 15 7.8
Food, agriculture, forestry and fisheries 4 2.1
Brain science 0 0.0
Physics 4 2.1
Health care 16 8.3
Life science 43 22.4
Mathematics 1 0.5
Energy/Resources 4 2.1
Atomic energy 0 0.0
Cognitive/Emotional science 3 1.6
Material engineering 18 9.4
Electrical/Electronic engineering 12 6.3
Information/Communication 15 7.8
Earth science 1 0.5
Chemical engineering 13 6.8
Chemistry 12 6.3
Environmental engineering 16 8.3
Occupation
Researcher 80 41.7
Student 16 8.3
Professor 19 9.9
Company employee 59 30.7
Others 18 9.4
Table 4. Demographic characteristics
296
297
According to Table 4, in terms of age, 7.3% of (or 14) users were in their 20s, 31.3% (60) were in
298
their 30s, 36.5% (70) were in their 40s, and 17.7% (14) were in their 60s. In terms of gender, 87.5% were
299
male (168) and 12.5% were female (24). Regarding education level, undergraduates comprised 18.2%
300
2.6% of (or 5) users majored in construction/transportation; 5.2% (10) in science and technology and
302
humanities and the social sciences; 7.8% (15) in mechanical engineering; 2.1% (4) in food, agriculture,
303
forestry and fisheries sciences; 0.0% (0) in brain science; 2.1% (4) in physics; 8.3% (16) in healthcare;
304
22.4% (43) in life science; 0.5% (1) in mathematics; 2.1% (4) in energy and resources; 0.0% (0) in atomic
305
energy; 1.6% (3) in cognitive-emotional science; 9.4% (18) in materials engineering; 6.3% (12) in
306
electrical and electronic engineering; 7.8% (15) in information and communication; 0.5% (1) in earth
307
science; and 6.8% (13) in chemical engineering. In terms of occupation, 41.7% of (or 80) users were
308
researchers, 8.3% (16) were students, 9.9% (19) were professors, 30.7% (59) were company employees,
309
while 9.4% (18) marked other.
310
3.2.3. Analysis of PRS usage behavior according to demographic characteristics
311
The authors studied the following aspects of the surveyees’ PRS usage behavior: use or non-use
312
of the service, reason(s) for non-use, primary purpose of using the service, number of visits, and
313
service use time. The results are shown in Table 5.
314
315
Variable Item Frequency %
Whether the user uses KOSEN’s
personalized recommendation service
Yes 192 37.4
No 321 62.6
The reason for non-use of
personalized recommendation service
Do not know how to use it 258 80.6
Difficult to use 8 2.5
Unnecessary 35 10.9
Recommendation result is not adequate 5 1.6
Others 14 4.4
The primary reason for using
personalized recommendation service
Information accessibility 98 51.0
Adequate information 46 24.0
Useful information 18 9.4
Variety of information provided 28 14.6
Others 2 1.0
Number of visits to KOSEN service
1-7 times a week 123 64.1
1-7 times a month 50 26.0
1-10 times a year 19 9.9
Service usage time
No less than 1hour 158 82.3
1-2 hours 31 16.1
3 hours or longer 3 1.6
Table 5. Usage behavior of the PRS
316
317
As for the question on whether the user is accessing KOSEN’s PRS, 192 users answered “Yes”
318
(37.4%) and 321 users said “No” (62.6%).
319
Regarding reason(s) for non-use, 258 users said that they “Do not know how to use it” (80.6%),
320
8 marked “Difficult to use” (2.5%), 35 stated “Unnecessary” (10.9%), 5 claimed the “Recommendation
321
results are not adequate” (1.6%) and 14 chose “Other” (4.4%). The fact that the predominant reason
322
for non-use is “Do not know how to use it” suggests that company management needs to make
323
Regarding the primary purpose of using the service, 51.0% of (or 98) users answered
325
“Information accessibility,” 24.0% (46) chose “Adequate information,” 9.4% (18) stated “Useful
326
information,” 14.6% (28) selected “Variety of information provided,” and 1.0% (2) chose “Other.”
327
In terms of the number of visits, 64.1% (123) answered “1–7 times a week,” 26.0% (50) chose “1–
328
7 times a month”, and 9.9% (19) selected “1–10 times a year.” For service use time, 82.3% (158) marked
329
“Less than 1 hour,” 16.1% (31) stated “1–2 hours,” and 1.6% chose “3 hours or more” (1.6%). The
330
primary purpose of using the service was information accessibility, which enables users to access the
331
information they desire rapidly. The second most chosen reason was to obtain relevant knowledge.
332
The authors conducted a cross-examination (chi-square) test to examine the variance in service
333
usage behavior according to demographic characteristics. They investigated the differences in the
334
primary purpose of using the service, the number of visits, and service use time.
335
First, regarding whether the purpose of using the service varies according to demographic traits,
336
gender and major field of study showed a statistically significant difference. Looking at gender, 54.2%
337
of males (91 users) selected “Information accessibility,” 20.2% (34 users) chose “Adequate
338
information,” 9.5% (16 users) marked “Useful information,” 15.5% (26 users) answered “Variety of
339
information provided,” and 0.6% (1 user) stated “Other.” As for females, 29.2% (7 users) chose
340
“Information accessibility,” 50.0% (12 users) selected “Adequate information,” 8.3% (2 users) chose
341
“Useful information,” 8.3% (2 users) answered “Variety of information provided,” and 4.2% (1 user)
342
marked “Other.” Looking at the verification statistics, x2 is 11.700 and the probability of significance
343
was 0.020, which indicates a statistically significant difference. Regarding field of study, by
344
examining the verification statistics, x2 is 86.887 and the probability of significance was 0.030, which
345
demonstrates a statistically significant difference. Age, education level, and occupation did not show
346
statistically significant differences.
347
Second, as for whether the number of visits varied according to demographic features, education
348
level showed a statistically significant difference. Among users with Bachelor’s degrees, 48.6% (17
349
users) marked “1–7 times a week,” 40.0% (14 users) chose “1–7 times a month,” and 11.4% (4 users)
350
selected “1–10 times a year.” Among users with Master’s degrees, 54.7% (29) marked “1–7 times a
351
week,” 24.5% (13) stated “1–7 times a month,” and 20.8% (11) chose “1–10 times a year.” Among
352
doctors, 74.0% (77) selected “1–7 times a week,” 22.1% (23) chose “1–7 times a month,” and 3.8% (4
353
users) answered “1–10 times a year.” Looking at the verification statistics, x2 is 17.175 and the
354
probability of significance was 0.002, which suggests a statistically significant difference. Age,
355
gender, major field of study, and occupation did not show statistically significant differences.
356
Third, regarding whether service use time varied according to demographic elements, gender,
357
age, education level, major field of study, and occupation all showed no statistically significant
358
differences.
359
3.2.4. Demographic analysis of the satisfaction rate for system, content and service support
360
The three areas of PRS quality can be divided into system, content, and service support. Service
361
can be classified under ease of use, design, and accessibility. Content can be categorized as
362
sufficiency, adequacy, and utility. Service support can be broken down into user support and
363
interactivity.
364
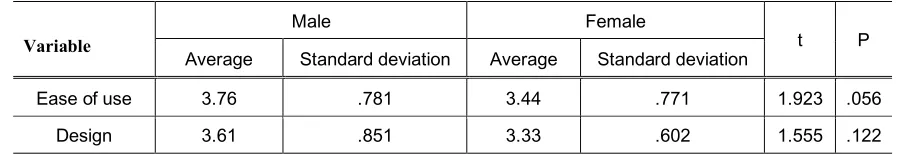
Table 6 shows the variance in the overall satisfaction rate for the areas of quality according to
365
gender. The authors used a t-test to compare the genders, with the results showing that variance in
366
the overall satisfaction rate according to gender was marginal and therefore statistically insignificant.
367
368
Variable
Male Female
t P
Average Standard deviation Average Standard deviation
Ease of use 3.76 .781 3.44 .771 1.923 .056
Accessibility 3.58 .755 3.29 .509 1.813 .071
Sufficiency 3.74 .787 3.50 .590 1.407 .161
Adequacy 3.88 .751 3.63 .612 1.575 .117
Utility 3.54 .996 3.29 1.083 1.110 .268
User support 3.45 .832 3.15 .667 1.693 .092
Interactivity 3.62 .780 3.46 .658 .944 .346
Importance 3.95 .697 3.75 .800 1.267 .207
Table 6. Comparison of satisfaction by gender (t-test)
369
*p<0.05, **p<0.01
370
371
As with gender, the variance in the overall satisfaction rate according to age, education level,
372
and occupation were also marginal and thus statistically insignificant. However, the ANOVA used
373
to measure variance according to occupation produced a statistically significant variance, as shown
374
in Table 7.
375
376
1. Regarding ease of use, the average for researchers (a) was 3.59; for students (b), 3.38; for
377
professors (c), 3.79; for company employees (d), 3.97; and for others (e), 3.78. The verification statistics
378
show the F value to be 2.966 and the significance probability to be 0.021. Hence, there is a statistically
379
significant variance in terms of ease of use.
380
2. Regarding design, the average for researchers (a) was 3.41; for students (b), 3.16; for professors
381
(c), 3.82; for company employees (d), 3.79; and for others (e), 3.75. The verification statistics show the
382
F value to be 3.557 and the significance probability to be 0.008. Therefore, there is a statistically
383
significant variance in terms of design.
384
3. Regarding accessibility, the average for researchers (a) was 3.44; for students (b), 3.06; for
385
professors (c), 3.58; for company employees (d), 3.81; and for others (e), 3.53. The verification statistics
386
show the F value to be 4.245 and the significance probability to be 0.003. Therefore, there is a
387
statistically significant variance in terms of accessibility.
388
4. Regarding sufficiency, the average for researchers (a) was 3.50; for students (b); 3.41, for
389
professors (c), 3.71; for company employees (d), 4.02; and for others (e), 3.86. The verification statistics
390
show the F value to be and the significance probability to be 0.001. Therefore, there is a statistically
391
significant variance in terms of sufficiency.
392
5. Regarding adequacy, the average for researchers (a) was 3.71; for students (b), 3.53; for
393
professors (c), 3.87; for company employees (d), 4.08; and for others (e), 3.94. The verification statistics
394
show the F value to be 3.209 and the significance probability to be 0.014. Hence, there is a statistically
395
significant variance in terms of adequacy.
396
6. Regarding utility, the average for researchers (a) was 3.35; for students (b), 3.50; for professors
397
(c), 3.21; for company employees (d), 3.76; and for others (e), 3.67. The verification statistics show the
398
F value to be 2.000 and the significance probability to be 0.096. Therefore, there is a statistically
399
significant variance in terms of utility.
400
7. Regarding user support, the average for researchers (a) was 3.23; for students (b), 3.28; for
401
professors (c), 3.55; for company employees (d), 3.64; and for others (e), 3.44. The verification statistics
402
show the F value to be 2.473 and the significance probability to be 0.046. Thus, there is a statistically
403
significant variance in terms of user support.
404
405
Variable Items Average Standard
deviation F p
Post
verification
Ease of use Researcher(a) 3.59 .856 2.966 .021* d>b
Professor(c) 3.79 .652
Company employee(d) 3.97 .662
Others(e) 3.78 .712
Design
Researcher(a) 3.41 .860
3.557 .008** c>b
Student(b) 3.16 .908
Professor(c) 3.82 .671
Company employee(d) 3.79 .794
Others(e) 3.75 .600
Accessibility
Researcher(a) 3.44 .694
4.245 .003** d>b
Student(b) 3.06 .727
Professor(c) 3.58 .534
Company employee(d) 3.81 .799
Others(e) 3.53 .606
Sufficiency
Researcher(a) 3.50 .868
5.045 .001** d>b
Student(b) 3.41 .664
Professor(c) 3.71 .384
Company employee(d) 4.02 .707
Others(e) 3.86 .479
Adequacy
Researcher(a) 3.71 .814
3.209 .014* d>b
Student(b) 3.53 .826
Professor(c) 3.87 .574
Company employee(d) 4.08 .651
Others(e) 3.94 .511
Utility
Researcher(a) 3.35 .995
2.000 .096 n/a
Student(b) 3.50 1.033
Professor(c) 3.21 .918
Company employee(d) 3.76 1.088
Others(e) 3.67 .686
User
Support
Researcher(a) 3.23 .811
2.473 .046* d>b
Student(b) 3.28 .547
Professor(c) 3.55 .911
Company employee(d) 3.64 .824
Others(e) 3.44 .784
Interactivity
Researcher(a) 3.44 .813
2.434 .049* d>b
Student(b) 3.47 .694
Professor(c) 3.63 .742
Company employee(d) 3.83 .717
Others(e) 3.61 .654
Table 7. Comparison of satisfaction by occupation (ANOVA)
406
8. Regarding interactivity, the average for researchers (a) was 3.44; for students (b), 3.47; for
407
professors (c), 3.63; for company employees (d), 3.83; and for others (e), 3.61. The verification statistics
408
show the F value to be 2.434 and the significance probability to be 0.049. Hence, there is a statistically
409
3.2.5. Analysis of the importance in determining factors in the three quality areas of the PRS and the
411
interactivity of its components
412
The authors conducted multiple regression analysis to determine the effect of system, one of the
413
three quality areas, on the importance of the recommendation service. Table 8 shows the results
414
415
Importance
Independent variable B SE Beta t p VIF DW F
(Constant) 1.963 .236 1 8.313 .000
2.232 .314
28.725**
(.000) Ease of use .322 .076 .356 4.249 .000** 1.924
Design .247 .074 .288 3.341 .001** 2.031
Accessibility -.036 .079 -.037 -.451 .653 1.837
Table 8. The effect of system on the importance of the recommendation service
416
*p<0.05, **p<0.01 ad
417
418
Model F has a value of 28.725 and can be considered a statistically significant regression model.
419
The R-squared of the regression analysis is the equivalent of the coefficient of determination, and
420
signifies the proportion of variance in the dependent variable, which can be explained by the variable
421
element. The R-squared, at 31.4%, indicates a high degree of explanation. The variance inflation factor
422
(VIF) value can range from 1 to infinity, and the values between 1 and 10 indicate no problem of
423
multi-collinearity. Since the VIF is below 10, there is no problem of multi-collinearity. Since the
424
outcome of the Durbin-Watson statistic is close to 2, there is no autocorrelation, and the residuals are
425
independent of each other. Therefore, there is no problem with the variables. The standard
426
significance level is 0.05 (95%). Results lower than 0.05 are statistically significant, while those higher
427
than 0.05 are not.
428
Looking at ease of use in the regression analysis, the B value is 0.322. In terms of verification
429
statistics, the t value is 4.249, and the probability of significance is 0.000, indicating a statistically
430
significant amount of effect. Since the value of the standardized beta is 0.356, increasing 1 unit of ease
431
of use expands the importance by 0.356 (35.6%). In terms of design, the B value is 0.247. Regarding
432
verification statistics, the t value is 3.341 and the probability of significance is 0.001, demonstrating a
433
statistically significant amount of effect. As the value of the standardized beta is 0.288, increasing 1
434
unit of ease of use augments importance by 0.288 (28.8%). Looking at accessibility, the B value is
-435
.036. For verification statistics, the t value is -.451 and the probability of significance is 0.653,
436
suggesting no statistically significant amount of effect.
437
Next, the authors conducted multiple regression analysis to determine the effect of
438
recommended content on the importance of the recommendation service. Table 9 displays the
439
outcomes.
440
Model F has a value of 23.886 and can be considered a statistically significant regression model.
441
The R-squared of regression analysis is the equivalent of the coefficient of determination and signifies
442
the proportion of the variance in the dependent variable, which can be explained by the variable
443
element. The R-squared, at 27.6%, indicates a high degree of explanation. The VIF value can range
444
from 1 to infinity, and the values between 1 and 10 indicate no problem of multi-collinearity. As the
445
VIF is below 10, there is no problem of multi-collinearity. Since the result of Durbin-Watson is close
446
to 2, there is no autocorrelation, and the residuals are independent of each other. Hence, there is no
447
problem with the variables. The standard significance level is 0.05 (95%). Results higher than 0.05 are
448
not statistically significant, while those lower than 0.05 are.
449
450
Independent variable B SE Beta t p VIF DW F
(Constant) 1.855 .249 7.446 .000
2.296 .276
23.886**
(.000) Sufficiency .137 .080 .148 1.714 .088 1.936
Adequacy .357 .084 .371 4.257 .000** 1.969
Utility .053 .051 .075 1.036 .302 1.360
Table 9. The effect of content on the importance of the recommendation service
451
452
Looking at sufficiency in the regression analysis, the B value is 0.137. In terms of verification
453
statistics, the t value is 1.714 and the probability of significance is 0.088, indicating no statistically
454
significant amount of effect. Looking at adequacy, the B value is 0.357. In terms of verification
455
statistics, the t value is 4.257 and the probability of significance is 0.000, suggesting a statistically
456
significant amount of effect. Since the value of the standardized beta is 0.371, increasing 1 unit of ease
457
of use boosts importance by 0.371 (37.1%). Looking at utility, the B value is 0.053. In terms of
458
verification statistics, the t value is 1.037 and the probability of significance is 0.302, signaling no
459
statistically significant amount of effect.
460
Lastly, the authors conducted multiple regression analysis to determine the effect of service
461
support on the importance of the recommendation service. Table 10 shows the outcomes.
462
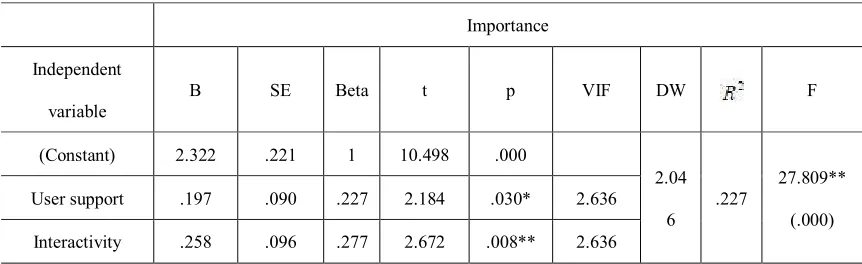
463
Importance
Independent
variable
B SE Beta t p VIF DW F
(Constant) 2.322 .221 1 10.498 .000
2.04
6
.227
27.809**
(.000) User support .197 .090 .227 2.184 .030* 2.636
Interactivity .258 .096 .277 2.672 .008** 2.636
Table 10. The effect of service support among three quality areas on the importance of the recommendation
464
service
465
*p<0.05, **p<0.01 ad
466
467
Model F has a value of 27.809 and can be considered a statistically significant regression model.
468
The R-squared of regression analysis is the equivalent of the coefficient of determination, and
469
signifies the proportion of variance in the dependent variable, which can be explained by the variable
470
element. The R-squared, at 22.7%, signals a high degree of explanation. The VIF value can range from
471
1 to infinity, and the values between 1 and 10 indicate no problem of multi-collinearity. Since the VIF
472
is below 10, there is no problem of multi-collinearity. Given that the outcome of the Durbin-Watson
473
statistic is close to 2, there is no autocorrelation, and the residuals are independent of each other.
474
Hence, there is no issue with the variables. The standard significance level is 0.05 (95%). Results lower
475
than 0.05 are statistically significant, while those higher than 0.05 are not.
476
In terms of user support in the regression analysis, the B value is 0.197. Regarding verification
477
statistics, the t value is 2.184 and the probability of significance is 0.030, suggesting a statistically
478
significant amount of effect. Since the value of the standardized beta is 0.227, increasing 1 unit of ease
479
of use extends importance by 0.227 (22.7%). Looking at interactivity, the B value is 0.258. For
480
verification statistics, the t value is 2.672 and the probability of significance is 0.008, implying a
481
statistically significant amount of effect. Since the value of the standardized beta is 0.227, increasing
482
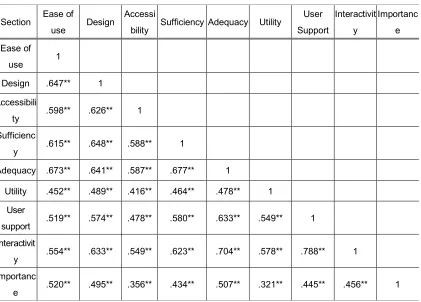
3.2.6. Pearson’s correlation analysis for examining the correlation among the PRS components
484
In order to examine whether there is a significant correlation among the components of the
485
service’s three areas of quality, the authors employed a Pearson correlation analysis, as shown in
486
Table 10.
487
Section Ease of
use Design
Accessi
bility Sufficiency Adequacy Utility
User
Support
Interactivit
y
Importanc
e
Ease of
use 1
Design .647** 1
Accessibili
ty .598** .626** 1
Sufficienc
y .615** .648** .588** 1
Adequacy .673** .641** .587** .677** 1
Utility .452** .489** .416** .464** .478** 1
User
support .519** .574** .478** .580** .633** .549** 1
Interactivit
y .554** .633** .549** .623** .704** .578** .788** 1
Importanc
e .520** .495** .356** .434** .507** .321** .445** .456** 1
Table 11. Person correlation analysis among the three major variables of quality
488
*p<0.05, **p<0.01
489
1. Ease of use and:
490
• design show a statistically significant correlation, with a correlation coefficient of 0.647.
491
• accessibility present a statistically significant correlation, with a correlation coefficient of
492
0.598.
493
• sufficiency display a statistically significant correlation, with a correlation coefficient of
494
0.615.
495
• adequacy show a statistically significant correlation, with a correlation coefficient of 0.673.
496
2. Design and:
497
• accessibility present a statistically significant correlation, with a correlation coefficient of
498
0.626.
499
• sufficiency suggest a statistically significant correlation, with a correlation coefficient of
500
0.648.
501
• adequacy show a statistically significant correlation, with a correlation coefficient of 0.641.
502
• interactivity show a statistically significant correlation, with a correlation coefficient of
503
0.633.
504
3. Sufficiency and:
505
• adequacy show a statistically significant correlation, with a correlation coefficient of 0.677.
506
• interactivity suggest a statistically significant correlation, with a correlation coefficient of
507
0.623.
508
4. Adequacy and:
509
• user support show a statistically significant correlation, with a correlation coefficient of
510
• interactivity display a statistically significant correlation, with a correlation coefficient of
512
0.704.
513
5. User support and:
514
• interactivity suggest a statistically significant correlation, with a correlation coefficient of
515
0.788
516
517
4. Implications
518
This authors conducted a user survey on KOSEN’s PRS to examine the information usage
519
behavior of Korean scientists and engineers who access the PRS. In order to investigate the usage
520
status of the service, the authors analyzed usage behavior by employing statistically significant data.
521
They also explored the importance of the components of service quality, as well as the correlations
522
among them.
523
The analysis yielded the following outcomes in regard to the three research questions. The
524
results enabled the understanding of the information usage behavior of Korean scientists and
525
engineers in relation to the PRS, as well as the effects of the three areas of quality (system, content,
526
and service support) on the perceived importance of the service. A method for improving the system
527
will be proposed in the following chapter.
528
First, regarding the answer to whether PRS usage behavior varies based on users’ demographic
529
traits, in terms of gender, the primary purpose of using the service for males was information
530
accessibility, whereas for females, it was the adequacy of the suggested information. The differences
531
according to gender as well as major field of study were statistically significant. There was no
532
statistically significant difference based on age, education level, or occupation.
533
Secondly, the answer to whether the satisfaction rate of the service’s three areas of quality
534
(system, contents, and service support) shows variance according to users’ demographic attributes
535
was that the variance in the overall satisfaction rate according to gender was marginal. As with
536
gender, the variance in the overall satisfaction rate based on age, education level, and occupation was
537
also marginal and therefore statistically insignificant. However, the ANOVA used to measure the
538
variance according to occupation revealed a statistically significant variance in seven out of eight
539
components (ease of use, design, accessibility, sufficiency, adequacy, user support, and interactivity)
540
of the three areas of quality, excluding utility. Regarding the number of visits, there was only a
541
statistically significant difference in terms of education level. For the difference in the service use time
542
according to demographic traits, neither age, gender, education level, major field of study, or
543
occupation showed a statistically significant difference in information usage behavior.
544
Third, the answer to what some of users’ key concerns are, and if there is a significant correlation
545
among the three areas of quality that pertain to them, was as follows:
546
The authors conducted multiple regression analysis in order to determine the effect of system
547
(one of the three areas of quality) on the importance of the recommendation service. Looking at ease
548
of use, the B value is 0.322 and the probability of significance is 0.000, indicating a statistically
549
significant amount of effect. For design, the B value is 0.247 and the probability of significance is
550
0.001, suggesting a statistically significant amount of effect. However, in terms of accessibility, the B
551
value is -.326 and the probability of significance is 0.653, demonstrating no statistically significant
552
amount of effect.
553
In the analysis of the effect of system on the importance of the recommendation service,
554
sufficiency has a B value of 0.137 and a probability of significance of 0.088, implying no statistically
555
significant amount of effect. Looking at adequacy, the B value is 0.357 and the probability of
556
significance is 0.000, pointing to a statistically significant amount of effect. For utility, the B value is
557
0.053 and the probability of significance is 0.302, reflecting no statistically significant amount of effect.
558
Lastly, in the analysis of the effect of service support on the importance of the recommendation
559
service, user support has a B value of 0.197 and a probability of significance of 0.030, signaling a
560
statistically significant amount of effect. Interactivity has a B value of 0.258 and a probability of
561
To summarize the outcomes, of the eight components of the three areas of quality, ease of use,
563
design, adequacy, user support, and interactivity had a statistically significant amount of effect on
564
the importance of the PRS. This means that users of the recommendation service valued ease of use
565
and efficient design (the system components), as well as adequacy of information (the content
566
component). Users considered user support and interactivity (the service components) to be as
567
important as the recommendation service itself.
568
The answer to whether there was a significant correlation among the components of the three
569
areas of quality was that all eight components reveal importance and a statistically significant degree
570
of correlation. For system quality, ease of use and importance had a correlation coefficient of 0.520,
571
design and importance had a correlation coefficient of 0.495, and accessibility and importance had a
572
correlation coefficient of 0.356, all demonstrating a statistically significant correlation. For content
573
quality, sufficiency and importance had a correlation coefficient of 0.434, adequacy and importance
574
had a correlation coefficient of 0.507, and utility and importance had a correlation coefficient of 0.321,
575
all suggesting a statistically significant correlation. For service support quality, user support and
576
importance had a correlation coefficient of 0.445, while interactivity and importance had a correlation
577
coefficient of 0.456.
578
Moreover, a significant correlation with a correlation coefficient of 0.6 and above was present
579
between ease of use and design, ease of use and sufficiency, ease of use and adequacy, design and
580
accessibility, design and sufficiency, design and adequacy, design and interactivity, sufficiency and
581
adequacy, sufficiency and interactivity, adequacy and user support, and user support and
582
interactivity.
583
584
5. Conclusion
585
The authors derived the following conclusions based on an examination of pre-existing studies
586
and the analysis of the user survey.
587
1. The predominant reason for non-use of the PRS was that users did not know how to use it;
588
80.6% of surveyees marked this reason for their non-use.
589
2. In terms of the difference in the information usage behavior of PRS users according to
590
demographic characteristics, gender and major field of study revealed a statistically significant
591
difference in the purpose of using the service, and education level presented a statistically significant
592
difference in the number of visits. No other significant differences were observed.
593
3. In the three areas of quality (system, content, and service support), the variance in the
594
satisfaction rate for each according to demographic traits (gender, age, education level, and major
595
field of study) was marginal. However, regarding the service satisfaction rate per occupation, there
596
was a statistically significant variance in seven out of the eight components of the three areas of
597
quality (ease of use, design, accessibility, sufficiency, adequacy, user support, and interactivity),
598
excluding utility.
599
4. Of the eight components, five (ease of use, design, adequacy, user support, and interactivity)
600
demonstrated a statistically significant amount of effect on the importance of the PRS, meaning that
601
they are the components users were most concerned with.
602
5. Regarding the components that users deemed important in the PRS, five out of the eight (ease
603
of use, design, adequacy, user support, and interactivity) had a statistically significant effect on
604
determining the importance of the service.
605
606
5.1. Proposals to improve the PRS
607
The authors derived the following conclusions based on an examination of pre-existing studies
608
and the analysis of the user survey.
609
1. The predominant reason for non-use of the PRS was that users did not know how to use it;