The Activation Detector Activity Calculations Using the
Effective Source Method and Measurement
Vladimir Smutný1, Alena Konená1, Daniel Sprinzl1, Vít Klupák2, and Miroslav Vinš2
1
SKODA JS a.s., Calculation Department, Orlík 266/15, 316 00 Plze, Czech Republic
2Research Centre Rez, Hlavní 130, 250 68 Husinec-Rez, Czech Republic
Abstract. In the paper the application of effective source to the solution of activation detector activities in the reactor pressure vessel cavity of the VVER-1000 reactor is presented. The effective source method applies the Boltzmann transport operator to time integrated source data to obtain detector activities. Weighting the source data by time dependent depletion of the detector activity, the result of the calculation is the detector activity. The approach works because of the inherent linearity of radiation transport in non-multiplying time-invariant media. Integrated in this way, the source data are referred to as the ‘effective source’. The effective source method thereby enables the analyst to replace numerous intensive transport calculations with a single transport calculation in which the time dependence and magnitude of the source are correctly represented. Detailed description of the effective source method is presented in previous works. First, there were performed neutron-physical calculations of few real VVER-1000 cycles using MOBY-DICK macrocode. Second, there follows 3-D transport calculation using the deterministic code TORT and the cross section library BUGLE-B7 and obtained results are presented. These calculation results of activation detector activities in the reactor cavity are compared with relevant activation detectors results of the ex-vessel measurement. The comparison between calculation and measurement of activation detectors activity in the reactor cavity is necessary to the calculation quality verifying for further fast neutron fluence onto the reactor pressure vessel credible calculation. The activation detectors positions are evident from Figs 1, 2, 3.
1 Introduction
The fast neutron fluence onto the reactor pressure vessel (RPV) is necessary quantity for radiation impact onto the RPV determination in general and particularly for the RPV material embrittlement analyses. There is usually requested the fast neutron fluence increment within 1 cycle for thresholds 0,5 MeV or 1,0 MeV. Values of the fast neutron fluence are obtained either by calculation or by deriving from activity measurement. In principle there are 2 main activity measurement positions towards the RPV: surveillance samples position before the RPV and activation detectors position behind the RPV. The activity is still uniquely assessed for cladding material taken directly from the RPV inner surface. The fast neutron fluence calculationaly derived from mentioned types of measurement is valuable especially in the points of measurement, while the calculation provides the neutron fluence in the whole RPV and particularly in unaccessible points for measurement – RPV inner surface and inner surface of RPV basic material. The approach to the neutron fluence determining is then following: the neutron fluence is prepared by calculation and measurement in certain points, and if the agreement is achieved then for other points of interest on the RPV the neutron fluence obtained by calculation is used.
In the paper the results of the activation detectors activity measurement are presented and compared with transport calculation using the effective source method.
2 The effective source method and
application
The activities of the activation detectors in the reactor cavity were calculated with 3-D discrete ordinates deterministic transport code TORT [1] applying the effective source method. The effective source method used in forward transport calculations is based on following assumptions: the space and material arrangement of the RPV and its surrounding is unchangeable in time, the space and energy neutron distribution in the active core is known – fixed source problem. The assumption about time independent material composition holds because there are investigated quantities related only to the fast neutrons escaping from the active core.
Let’s call the time integral of the neutron source as the effective source for neutron fluence and the time integral of the time-weighted neutron source as the effective source for detector activity [2-5].
The advantage of the effective source method is the demand of only one forward transport calculation for the time dependent neutron source (time-weighted neutron source) through the whole cycle.
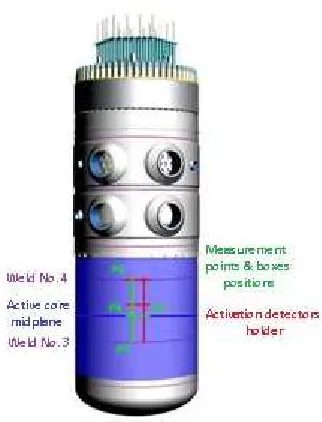
The effective source method was applied to detectors activity calculation in the reactor cavity (detectors positions: Fig. 1, Fig. 2, Fig. 3).
The neutron source distribution on the pin by pin level in 360° was calculated using MOBY-DICK code [6] (3-D diffusion standard Czech code for the VVER-440 and VVER-1000 reactor core calculation) for the VVER-1000 reactor, NPP Temelin, Unit 1 cycle 12 and Unit 2 cycle 11. The effective sources were prepared for the activation detectors 46Ti, 54Fe, 55Mn, 58Ni, 63Cu. The transport calculations with the effective sources for determination of the detectors activity in the reactor cavity were performed by the code TORT [1] in 120° symmetry, the angle approximation S16 and the
anisotropic scattering P3, using the broad group cross
section library BUGLE-B7 [7] with 47 neutron groups. The activation cross sections taken from mentioned library were produced by groups collapsing using 1/4 RPV thickness weighting. As concerns the 46Ti(n,p) reaction, our experience leads to taking the activation cross section from previous library version BUGLE-96 [8]. The calculation results are presented in Tab. 1, Tab. 2 and Fig. 4 - Fig. 11.
3 The measurement arrangement
The neutron fluence assessment in the cavity behind RPV is based on activation detector method. The measured activity values are used like input data for neutron fluence adjustment. The measurement in the reactor cavity is arranged according to Fig. 1, Fig. 2 and Fig. 3. The holder of activation detectors (red lines Fig. 3) is made from aluminum and it covers space between welds no. 3 and no. 4 and approximately 26 degree sector on RPV surface (sector C in Fig. 1 and green sector in Fig. 2). The holder supports activation detectors for spatial neutron fluence distribution and for neutron spectrum measurements. The spectrometric sets of activation detectors (metal disk foils with content of
46
The calculation and measurement results are compared in Tab. 1 for Unit 1 cycle 12 and in Tab. 2 for Unit 2 cycle 11 for activation detectors (46Ti, 54Fe, 55Mn, 58Ni,
63
Cu) located in positions P5, P6, P8, and P2 (Fig. 3).
Table 1. NPP Temelin Unit 1 cycle 12, activation detectors activities in the reactor cavity 1)
activation reaction measurement (E) calculation (C) difference A [Bq/1 nucleus] A [Bq/1 nucleus] (C-E)/E [%] box P5: RPV outer surface; azimuthally: 68,5°,
axially: weld No. 3
54
Fe(n,p)54Mn 2,647E-17 3,365E-17 27,1
58
Ni(n,p)58Co 8,015E-17 9,777E-17 22,0
46
Ti(n,p)46Sc 1,099E-17 1,301E-17 18,4
63
Cu(n,)60Co 7,470E-20 9,079E-20 21,5
55
Mn(n,2n)54Mn 5,522E-19 5,616E-19 1,7
box P6: RPV outer surface; azimuthally: 68,5°, axially: active core midplane
54
Fe(n,p)54Mn 2,879E-17 3,445E-17 19,7
58
Ni(n,p)58Co 8,378E-17 9,812E-17 17,1
46Ti(n,p)46Sc 1,089E-17 1,303E-17 19,7 63Cu(n,)60Co 7,941E-20 9,315E-20 17,3 55
Mn(n,2n)54Mn 5,732E-19 5,733E-19 0,0
box P8: RPV outer surface; azimuthally: 68,5°, axially: weld No. 4
54
Fe(n,p)54Mn 2,818E-17 3,193E-17 13,3
58
Ni(n,p)58Co 8,488E-17 9,359E-17 10,3
46
Ti(n,p)46Sc 1,098E-17 1,230E-17 12,0
63
Cu(n,)60Co 7,726E-20 8,439E-20 9,2
55
Mn(n,2n)54Mn 5,676E-19 5,151E-19 -9,2
box P2: RPV outer surface; azimuthally: 82,5°, axially: active core midplane
54
Fe(n,p)54Mn 1,814E-17 2,159E-17 19,0
58
Ni(n,p)58Co 5,301E-17 6,132E-17 15,7
46
Ti(n,p)46Sc 7,497E-18 8,271E-18 10,3
63
Cu(n,)60Co 5,516E-20 6,089E-20 10,4
55
Mn(n,2n)54Mn 4,223E-19 4,043E-19 -4,3
1
) Azimuthal variable, 0°: direction I in Fig. 1 and Fig. 2
activation reaction measurement (E) calculation (C) difference A [Bq/1 nucleus] A [Bq/1 nucleus] (C-E)/E [%] box P5: RPV outer surface; azimuthally: 68,5°,
axially: weld No. 3
54
Fe(n,p)54Mn 3,195E-17 4,047E-17 26,7
58
Ni(n,p)58Co 9,070E-17 1,109E-16 22,3
46
Ti(n,p)46Sc 1,238E-17 1,478E-17 19,3
63
Cu(n,)60Co 9,949E-20 1,107E-19 11,2
55Mn(n,2n)54Mn 6,072E-19 6,577E-19 8,3
box P6: RPV outer surface; azimuthally: 68,5°, axially: active core midplane
54Fe(n,p)54Mn 3,175E-17 4,146E-17 30,6 58
Ni(n,p)58Co 8,866E-17 1,110E-16 25,2
46
Ti(n,p)46Sc 1,193E-17 1,477E-17 23,8
63
Cu(n,)60Co 1,006E-19 1,137E-19 13,1
55
Mn(n,2n)54Mn 6,404E-19 6,728E-19 5,1
box P8: RPV outer surface; azimuthally: 68,5°, axially: weld No. 4
54
Fe(n,p)54Mn 3,023E-17 3,744E-17 23,8
58
Ni(n,p)58Co 8,496E-17 1,043E-16 22,7
46
Ti(n,p)46Sc 1,161E-17 1,370E-17 18,0
63
Cu(n,)60Co 9,625E-20 1,001E-19 4,0
55
Mn(n,2n)54Mn 5,879E-19 5,886E-19 0,1
box P2: RPV outer surface; azimuthally: 82,5°, axially: active core midplane
54Fe(n,p)54Mn 1,961E-17 2,551E-17 30,1 58
Ni(n,p)58Co 5,302E-17 6,795E-17 28,2
46
Ti(n,p)46Sc 7,459E-18 9,154E-18 22,7
63
Cu(n,)60Co 6,818E-20 7,277E-20 6,7
55
Mn(n,2n)54Mn 4,536E-19 4,622E-19 1,9
Fig. 4 54
Fe detectors activity azimuthal distribution for Unit 1 cycle 12
Fig. 6 54
Fe detectors activity axial distribution for Unit 1 cycle 12
Fig. 8 54
Fe detectors activity azimuthal distribution for Unit 2 cycle 11
Fig. 5 63
Cu detectors activity azimuthal distribution for Unit 1 cycle 12
Fig. 7 63
Cu detectors activity axial distribution for Unit 1 cycle 12
Fig. 9 63
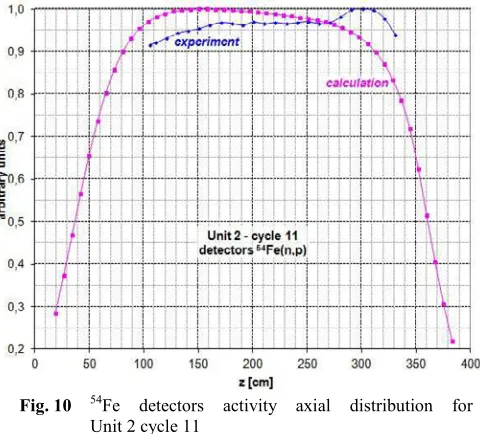
Fig. 10 54
Fe detectors activity axial distribution for Unit 2 cycle 11
5 Results discussion
For both cases Unit 1 cycle 12 and Unit 2 cycle 11 (see Tab. 1 and Tab. 2) the calculation overestimates the measurement except one occurrence: 55Mn in several RPV points for Unit 1 cycle 12. Generally, for 55Mn detector is the difference between calculation and measurement results relatively low, but it should be remembered that the reaction energy threshold is relatively high. And though 55Mn(n,2n) activation cross section shows significantly spectral dependence, the BUGLE-B7 library group system includes only 3 broad groups above the 55Mn(n,2n) reaction threshold. The largest differences between calculation and measurement holds for 54Fe detector: app. 20 – 30%. For other detectors (58Ni, 46Ti, 63Cu) better agreement between calculation and measurement is achieved, whereas for Unit 1 cycle 12 the differences approximately 10 – 20% are displayed, while for Unit 2 cycle 11, 10 – 25%.
The comparisons of activity spatial distribution in arbitrary units are given in Fig. 4 - Fig. 11. There is good agreement between calculation and measurements for azimuthal distribution. Despite of azimuthal distribution, the shape of axial distributions obtained by calculation differs little from results of measurements, whereas the calculated curves show opposed trend to measured ones. If the assumption those measurements are correct, the possible explanation is strong dependence on neutron source definition used for transport calculation. The similar issue or situation for VVER-1000 reactor was described by Borodkin et al. [9].
It should be emphasized that the maximal differences between calculation and measurements in Fig. 10 and Fig. 11 are one tenth (10%) in arbitrary units and the uncertainties of activity are approximately 7% for copper foils and 5% for iron detector. The highest value of uncertainty 9% is for titanium. The main reason is low activity and statistical error of peak area during gamma spectroscopy.
Fig. 11 63
Cu detectors activity axial distribution for Unit 2 cycle 11
References
1. DOORS 3.2a, Program Package for One, Two and Three Dimensional Discrete Ordinates Transport (CCC-650, RSICC, ORNL, 2003)
2. K. Ilieva, S. Antonov, S. Belousov, Nucl. Sci. & Eng. 122 No.1, 131-135 (1996)
3. K. Ilieva, T. Apostolov, I. Penev, S. Belousov, E. Taskaev, S. Antonov, T. Petrova, P. Tzokov, Z. Bojadjiev, Nucl. Engn. & Design 160, 257-260 (1996)
4. A. Thornton, T.A. Lewis, J.R. Mossop, C.J. Page, S.A. Haddock, 10thInternational Symposium on Reactor Dosimetry (Osaka, 1999)
5. J. Hep, A. Konená, V. Krýsl, V. Smutný, Reactor Dosimetry 14thInternational Symposium (Bretton Woods, 2011)
6. V. Krýsl, P. Mikoláš, J. Šstek, K. Vlachovský, Description of program MOBY-DICK with changes for VVER-1000 (ŠKODA JS, 2015)
7. BUGLE-B7/VITAMIN-B7, Broad-Group and Fine-Group and Coupled Neutron/Gama Cross-Section Libraries Derived from ENDF/B-VII.0 Nuclear Data (DLC-245, RSICC, ORNL, 2011) 8. BUGLE-96, Coupled 47 Neutron, 20 Gamma-Ray
Group Cross Section Library Derived from ENDF/B-VI for LWR Shielding and Pressure Vessel Dosimetry Applications (DLC-185, RSICC, ORNL, 1996)