Diabetes, Metabolic Syndrome and Obesity: Targets and Therapy
Dove
press
R e v i e w
open access to scientific and medical research
Open Access Full Text Article
Predicting cardiometabolic risk: waist-to-height
ratio or BMi. A meta-analysis
Savvas C Savva1
Demetris Lamnisos2
Anthony G Kafatos3
1Research and education institute of Child Health, Strovolos, Cyprus; 2Department of Nursing, School of Health Sciences, Cyprus University of Technology, Limassol, Cyprus; 3Preventive Medicine and Nutrition Unit, School of Medicine, University of Crete, Heraklion, Crete, Greece
Correspondence: Savvas C Savva 138, Limassol Ave, #205, 2015 Strovolos, Cyprus Tel +357 2251 0310 Fax +357 2251 0903
email sc.savvas@cytanet.com.cy
Background and objectives: The identification of increased cardiometabolic risk among asymptomatic individuals remains a huge challenge. The aim of this meta-analysis was to compare the association of body mass index (BMI), which is an index of general obesity, and waist-to-height ratio (WHtR), an index of abdominal obesity, with cardiometabolic risk in cross-sectional and prospective studies.
Methods: PubMed and Embase databases were searched for cross-sectional or prospective studies that evaluated the association of both BMI and WHtR with several cardiometabolic outcomes. The strength of relative risk (RR) with 95% confidence interval (CI) was calculated using the optimal cutoffs of BMI and WHtR in cross-sectional studies, while any available cutoff was used in prospective studies. The pooled estimate of the ratio of RRs (rRR [=RRBMI/ RRWHtR]) with 95% CIs was used to compare the association of WHtR and BMI with car-diometabolic risk. Meta-regression was used to identify possible sources of heterogeneity between the studies.
Results: Twenty-four cross-sectional studies and ten prospective studies with a total number of 512,809 participants were identified as suitable for the purpose of this meta-analysis. WHtR was found to have a stronger association than BMI with diabetes mellitus (rRR: 0.71, 95% CI: 0.59–0.84) and metabolic syndrome (rRR: 0.92, 95% CI: 0.89–0.96) in cross-sectional studies. Also in prospective studies, WHtR appears to be superior to BMI in detecting several outcomes, including incident cardiovascular disease, cardiovascular disease mortality, and all-cause mortality. The usefulness of WHtR appears to be better in Asian than in non-Asian populations. BMI was not superior to WHtR in any of the outcomes that were evaluated. However, the results of the utilized approach should be interpreted cautiously because of a substantial heterogeneity between the results of the studies. Meta-regression analysis was performed to explain this het-erogeneity, but none of the evaluated factors, ie, sex, origin (Asians, non-Asians), and optimal BMI or WHtR cutoffs were significantly related with rRR.
Conclusion: The results of this meta-analysis support the use of WHtR in identifying adults at increased cardiometabolic risk. However, further evidence is warranted because of a substantial heterogeneity between the studies.
Keywords: body mass index, waist-to-height ratio, meta-analysis, cardiometabolic
Introduction
The use of different combinations of anthropometric indices has been shown to produce
substantially different proportions of subjects at increased health risks.1 Body mass
index (BMI), as an index of general adiposity, and several indices of abdominal obe-sity, such as waist circumference (WC) and waist-to-hip ratio (WHR), are associated
Diabetes, Metabolic Syndrome and Obesity: Targets and Therapy downloaded from https://www.dovepress.com/ by 118.70.13.36 on 21-Aug-2020
For personal use only.
Number of times this article has been viewed
Dovepress
Savva et al
with increased cardiometabolic risk and risk of death. Several meta-analyses have failed to prove substantial superiority of abdominal obesity indices over BMI or between the two
aforementioned abdominal obesity indices.2–4
Since the mid-1990s, waist-to-height ratio (WHtR) has emerged as a promising index for identification of subjects
at increased cardiometabolic risk in both adults5–7 and
children.8,9 A huge number of studies have been undertaken
since then in order to evaluate the ability of this index in comparison to BMI and other indices to identify healthy humans at increased cardiometabolic risk. It has been sug-gested that WHtR has several advantages compared to BMI, and even to WC and WHR, as a simple and rapid screening tool, including its ability to identify health risks in both males and females, in different ethnic groups, and in all age
groups, including adults and children.10 Moreover, it has been
proposed that a cutoff value of 0.5 for both men and women and individuals of Caucasian, Asian, and Central American origin can be used for the prediction of cardiometabolic risk. This value was the mean value of the suggested boundary values regarding several cardiovascular disease (CVD) risk factors.11 This cutoff has been used to support the simple
public health message “keep your waist circumference to
less than half your height.”11
Several meta-analyses have aimed to put together the results from studies highlighting the usefulness of WHtR compared to BMI and other body fatness indices to identify cardiometabolic risk in healthy adults12–15 and children.16
Barzi et al concluded that no single index among BMI, WHtR, WC, and WHR is superior than any other in
detect-ing dyslipidemia in both Asian and non-Asian populations.13
In the meta-analysis of van Dijk et al,15 WC was proposed
as superior in detecting single CVD risk factors compared to BMI, WHtR, and WHR, but this meta-analysis used only correlation coefficients for their conclusions. Kodama et al showed that WHtR had a stronger association with incident
diabetes than BMI and WHR.14 Ashwell et al showed that
WHtR had a better discriminatory power than BMI and WC in detecting several cardiometabolic risk factors.12 This latter
meta-analysis used pooled area-under-the-curve values but included both cross-sectional and prospective studies in the same models.
The aim of the present meta-analysis, therefore, was to compare the ability of WHtR and BMI to detect multiple cardiometabolic risks and mortality, both cross-sectionally and prospectively, using reported optimal cutoffs for these indices.
Methods
Data sources and search strategy
A literature search was performed using Pubmed and Embase databases through May 9, 2013 using the terms (“waist-to-height ratio” OR “waist/(“waist-to-height ratio” OR “stature-to-(“waist-to-height ratio” OR “stature/height ratio” OR “WHtR” OR “WSR”) AND (“body mass index” OR “BMI”). Only original full-text studies written in English were selected for analysis. Confer-ence abstracts were excluded since presented information was limited for data extraction.
inclusion criteria
• Adults older than 18 years, irrespective of sex and ethnic
background
• Cross-sectional or prospective studies
• Studies reporting associations between at least one of the
primary outcomes and both anthropometric indices, ie, exposure measures BMI and WHtR
• For cross-sectional studies, only those reporting optimal
BMI and WHtR cutoffs
• Studies from which 2 × 2 tables could be retrieved
(out-come present/absent, exposure positive/negative).
exclusion criteria
• Case-control studies
• Studies evaluating cardiometabolic risk in specific
high-risk groups (eg, patients undergoing coronary angiography)
• Studies reporting on single lipid abnormality or single
systolic or diastolic hypertension
• Studies with children and/or adolescents.
Primary outcomes
Primary outcomes for cross-sectional studies were defined as follows:
1. Diabetes mellitus (DM). Any combination of
fast-ing blood glucose $7.0 mmol/L ($126 mg/dL) or
2-hour post-challenge blood glucose $11.1 mmol/L
($200 mg/dL) or patients with physician diagnosis of
diabetes or patients receiving anti-diabetic medication. 2. Elevated blood pressure. Any combination of systolic
blood pressure $130 mmHg and/or diastolic blood
pressure $85 mmHg and/or patients with physician
diagnosis of hypertension and/or patients receiving anti-hypertensive medication.
3. Dyslipidemia. Treatment for dyslipidemia or two or more abnormal serum lipid measurements including
Diabetes, Metabolic Syndrome and Obesity: Targets and Therapy downloaded from https://www.dovepress.com/ by 118.70.13.36 on 21-Aug-2020
Dovepress Predicting cardiometabolic risk: waist-to-height ratio or BMi
total cholesterol $5.2 mmol/L ($200 mg/dL),
low- density-lipoprotein cholesterol $3.5 mmol/L
($135 mg/dL), triglycerides $1.7 mmol/L ($150 mg/dL),
or high-density-lipoprotein cholesterol ,1.03 mmol/L
(,40 mg/dL).
4. Metabolic syndrome (MetS). Two or more risk fac-tors according to International Diabetes Federation or American Heart Association criteria when WC was not included in the definition (ie, two or more criteria out of four), or three or more criteria when WC was included in the criteria (ie, three or more criteria out of five). Regarding prospective studies, primary outcomes were: all-cause mortality; CVD mortality; incident CVD including myocardial infarction and stroke; and incident DM using the same cutoffs as described previously.
exposure cutoffs selection
The search of the identified studies revealed that reporting of exposure cutoffs was based on three different methods by the researchers: optimal cutoffs, ie, cutoffs that were chosen in order to maximize sensitivity and specificity of the indices;
standard cutoffs, ie, selection of 25 kg/m2 for non-Asians or
23 kg/m2 for Asians for BMI cutoffs and of 0.5 for WHtR
cutoffs; and cutoffs based on percentiles, ie, data were split in quartiles, quintiles, and so forth. We initially aimed to evaluate the discriminative ability of standard BMI and WHtR cutoffs in detecting cardiometabolic risk. However, this task proved difficult because of the limited number of studies that presented findings in a way that data could be extracted for meta-analysis. Therefore, in cross-sectional studies, we utilized only studies reporting optimal cutoffs. In prospective studies, due to a limited number of studies, we utilized optimal cutoffs or cutoffs based on percentiles. In the latter case, percentile cutoff nearest to “standard” cutoffs were selected.
Data extraction
Data extracted from each eligible study included first author; year of publication; participants’ age, sex, and nationality (which was further classified in Asian and non-Asian groups); study type (cross-sectional, prospective); criteria used for defining primary outcomes; and exposure cutoffs. Moreover, we extracted the numbers of patients and healthy individuals for each primary outcome in relation to exposure measures BMI and WHtR, dichotomized according to reported cutoffs.
Those numbers were presented in a 2 × 2 table (primary
outcome versus exposure) for each outcome and each
exposure measure. When precise numbers of patients and healthy individuals depending on exposure measures were not reported in studies presenting optimal exposure cutoffs, we utilized indirect methods for calculating these numbers. Specifically, we used reported sensitivity and specificity rates along with numbers of patients and healthy individuals
in order to extract the 2 × 2 table (primary outcome versus
exposure).
Quality assessment
Quality of all selected prospective studies was assessed using
the Newcastle-Ottawa quality assessment Scale (NOS).17
The NOS uses a star rating system to assess quality based on three aspects of the cohort study: selection of study groups (maximum 4 stars); comparability of study groups (maximum 2 stars); and ascertainment of outcome of interest (maxi-mum 3 stars). Therefore, a prospective study may receive a maximum of 9 stars. The NOS is not able to be used in cross-sectional studies, therefore a similar approach to the one used
by Friedemann et al was used.16 This approach considered five
elements: 1) representativeness of the study; 2) ascertainment of exposure; 3) selective reporting; 4) incomplete outcome data; and 5) assessment of outcome. Each of these outcomes could receive 1 star, therefore a cross-sectional study might receive a maximum of 5 stars.
Statistical analysis
Pooled ratio of relative risks (rRR) with 95% CIs was the principal measure for comparing the strength of BMI versus that of WHtR as a screening tool for the primary outcomes. The pooled rRR was calculated as follows:
rRR = RRBMI/RRWHtR (1)
An upper bound of the 95% CI for rRR less than 1 indi-cates significant strength in favor of WHtR and a lower bound of 95% CI greater than 1 indicates significant strength in favor of BMI. In the case that the 95% CI overlapped with 1, then the relative strength was in favor of neither of the two exposures. The 95% CI of rRR for each study was calculated by assuming a normal approximation to
log(rRR) = log(RRBMI) - log(RRWHtR) (2)
and then antilog to construct asymmetric 95% CI around rRR. The variance of log(rRR) was approximated by the sum of the variances of log(RRBMI) and log(RRWHtR). In most studies, results were reported separately for men and
Diabetes, Metabolic Syndrome and Obesity: Targets and Therapy downloaded from https://www.dovepress.com/ by 118.70.13.36 on 21-Aug-2020
Dovepress
Savva et al
women; therefore, results from these studies were included separately, and thus the term “data units” is used instead of “studies.” Meta-analysis of rRR for primary outcomes reported in at least two studies was performed using the
DerSimonian and Laird random effect statistical model.18
This model takes into account both the between- and within-studies variability.
Subgroup analysis was also performed by first stratify-ing the studies accordstratify-ing to origin (Asian and non-Asian) and then further stratified according to sex. Quantita-tive heterogeneity in the results was investigated by the I2 statistic, while the Egger’s regression test was used
to assess the publication bias in each obesity measure separately. Investigation of possible sources of heteroge-neity was performed using meta-regression in outcomes from the cross-sectional studies. In the outcomes from prospective studies, meta-regression was not performed due to the limited number of studies. The log(rRR) was used as the dependent variable in meta-regression, and participants’ sex, origin, optimal BMI or WHtR cutoffs, as well as an interaction term between participants’ sex and origin, were used as the covariates in attempts to explain the heterogeneity.
Analyses were performed with the aid of the metafor
package19 with R statistical software (v 3.0.1; The R
Founda-tion for Statistical Computing, Vienna, Austria).20
Results
Study and participant characteristics
The search strategy yielded 1,460 studies from the PubMed database and 763 studies from the Embase database. After applying inclusion and exclusion criteria, a total of 34 studies were included in this meta-analysis (Figure 1); 46 data units from 24 cross-sectional studies with optimal BMI and
WHtR cutoffs21–44 and 18 data units from ten prospective
studies.45–54 The total number of participants in the
cross-sectional studies was 221,814 individuals, of which 177,974 were Asians and 43,840 non-Asians. In the cross-sectional studies, there were 6,850 patients with DM, 26,491 patients with dyslipidemia, 20,467 with elevated blood pressure, and 19,014 with MetS. The total number of participants in the prospective studies was 290,995 individuals of which 137,325 were Asians and 153,670 non-Asians. In prospective studies, there were 6,057 patients with incident DM, 4,388 patients with incident CVD, 1,903 with CVD mortality, and 5,642 with all-cause mortality.
In all 34 studies, the total number of participants was 512,809 persons. The age limit in the inclusion criteria was
18 years or older; however, we included two studies in which participants’ ages were .15 years22 or 15 to 74 years.27
Furthermore, four of the included studies did not determine range of age but rather provided mean age with standard deviation.25,28,29,34
The characteristics of the included studies are presented in Table 1. From cross-sectional studies reporting results based on optimal BMI and WHtR cutoffs, we identified a total of 27 data units from 14 studies reporting
associa-tions with DM,21–34 19 data units from ten studies with
dys-lipidemia,21,23–25,27,29,32–35 34 data units from 18 studies with
elevated blood pressure,21–25,27–32,34–40 and 16 data units from
eight studies with MetS.23,33,35,38,41–43 In prospective studies,
we identified ten data units from five studies reporting
asso-ciations with incident DM,21–44 four data units from three
studies with incident CVD,50–52 four data units from two
studies with CVD mortality,53,54 and four data units from two
studies with all-cause mortality.53,54
exposure measure cutoffs
The summary of the optimal cutoffs from the cross-sectional studies in each of the outcomes is presented in Table 2. From this table, it is obvious that both BMI and WHtR optimal cutoffs were generally higher in non-Asian than in Asian populations. Moreover, medians of WHtR were also generally higher than the suggested cutoff of 0.500 in non-Asian individuals, and this was even the case in three out of four outcomes in Asian populations. Simi-lar data are not presented for prospective studies because in four out of the ten included studies, cutoffs were not optimal but rather based on percentiles. A visual inspec-tion of the cutoffs utilized in each data unit in prospective studies provides the impression that cutoffs are higher in non-Asians compared to Asians regarding incident DM and incident CVD.
Results from cross-sectional studies
with optimal cutoffs for BMi and wHtR
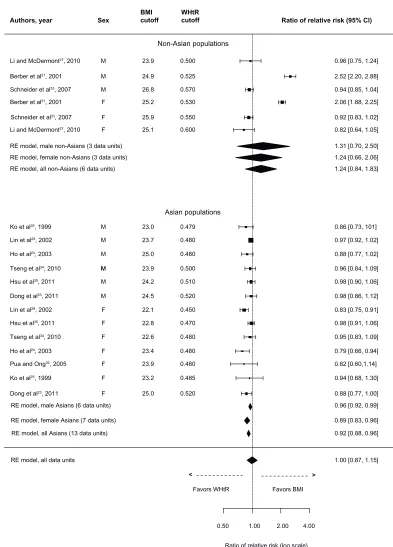
Primary outcomes from these studies were DM, dyslipi-demia, elevated blood pressure, and MetS. Results for DM are presented in Figure 2. The overall rRR clearly indicates that WHtR is superior to BMI in detecting DM (rRR: 0.71, 95% CI: 0.59–0.84). The association of WHtR with DM was stronger for both Asians (rRR: 0.64, 95% CI: 0.50–0.83) and non-Asians (rRR: 0.79, 95% CI: 0.63–0.99). Moreover, subgroup analysis indicates that WHtR is also superior to BMI in discriminating DM in both male and female Asians and non-Asian females.
Diabetes, Metabolic Syndrome and Obesity: Targets and Therapy downloaded from https://www.dovepress.com/ by 118.70.13.36 on 21-Aug-2020
Dovepress Predicting cardiometabolic risk: waist-to-height ratio or BMi Literature search
PubMed database (n=1,460) Embase database (n=763)
Search results combined after removing 492 duplications
(n=1,731)
Articles screened on the
basis of title and abstract Excluded (n=1,472)
Irrelevant (n=887)
Not including both exposures (n=250)
Not including cardiometabolic outcomes (n=99) Children – adolescents (n=144)
Conference abstracts, letters, language (n=92)
Included (n=259)
Manuscript review and application of inclusion criteria
Excluded (n=225)
High-risk groups, not cross-sectional or prospective studies (n=68)
Cross-sectional studies not reporting optimal cutoffs (n=61)
Unable to retrieve 2×2 table (n=69)
Studies reporting single lipid abnormalities or risk factor combinations other than metabolic syndrome (n=27)
Included (n=34)
Cross-sectional studies (n=24)
Prospective studies (n=10)
Figure 1 Flow diagram of study selection.
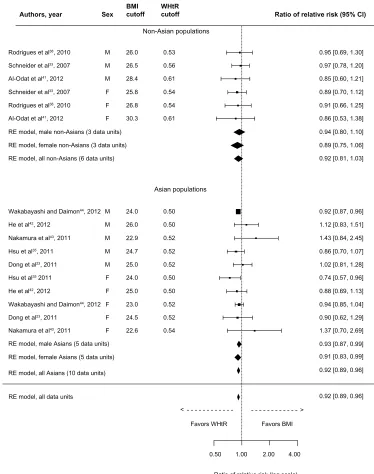
The overall comparison measure for dyslipidemia was in favor of neither of the exposures (rRR: 1.00, 95% CI: 0.87–1.15), as shown in Figure 3. However, the comparison measure was statistically significant in favor of WHtR in Asian populations (rRR: 0.92, 95% CI: 0.88–0.96), and this comparison remains statistically significant in favor of WHtR in both male and female Asians. In non-Asians, although the
data units from the study of Berber et al21 were well in favor
of BMI, neither exposure proved superior to the other (rRR: 1.24, 95% CI: 0.84–1.83).
Similar findings were observed for elevated blood pres-sure, with the overall comparison measure (rRR: 0.95, 95% CI: 0.83–1.11) being in favor of neither of the two exposures (Figure 4), although it was in favor of WHtR in Asian populations (rRR: 0.87, 95% CI: 0.77–0.98); however, the comparison measures attenuated within sex in Asians.
In non-Asians, the data units from the study of Berber et al21
again indicate a significantly stronger association of BMI with elevated blood pressure.
Finally, the overall comparison measure for MetS (Figure 5) was in favor of WHtR (rRR: 0.92, 95% CI: 0.89–0.96). This was also true in Asian populations (rRR: 0.92, 95% CI: 0.89–0.96) and in both male and female Asians. However, the two exposures performed equally in non-Asians (rRR: 0.92, 95% CI: 0.81–1.03). The defini-tion of MetS among utilized studies included WC in three out of the eight studies;35,38,41 two out of these three studies
comprised non-Asians. Sensitivity analyses were used to explore the degree to which the findings were affected by these three studies. The overall rRR (ie, with ten data units after excluding the three studies) remained statistically sig-nificant in favor of WHtR (rRR: 0.93, 95% CI: 0.89–0.97).
Diabetes, Metabolic Syndrome and Obesity: Targets and Therapy downloaded from https://www.dovepress.com/ by 118.70.13.36 on 21-Aug-2020
Dovepress
Savva et al
Table 1 Characteristics of included studies
Author Ethnicity Ethnic
group
Sex Number of
participants
Age range or mean age ± SD (years)
BMI and WHtR cutoff selection
Outcome
Cross-sectional studies with optimal cutoffs
Al-Odat et al41 Jordanian Non-Asian M, F 212; 288 20–85 Optimal MetS
Berber et al21 Mexican Non-Asian M, F 2,426; 5,939 .20 Optimal DM, Dys, eBP
Craig et al22 Tongan Non-Asian M, F 314; 453 .15 Optimal DM, eBP
Deshmukh et al36 indian Asian M, F 1,059; 1,641 .18 Optimal eBP
Dong et al23 Chinese Asian M, F 1,522; 1,484 20–74 Optimal DM, Dys, eBP, MetS
He et al42 Chinese Asian M, F 430; 638 .40 Optimal MetS
Ho et al24 Hong Kong
Chinese
Asian M, F 1,412; 1,483 27–74 Optimal DM, Dys, eBP
Hsu et al35 Taiwanese Asian M, F 1,147; 1,212 40–94 Optimal Dys, eBP, MetS
Khader et al37 Jordanian Non-Asian M, F 1,128; 3,462 .18 Optimal eBP
Ko et al25 Hong Kong
Chinese
Asian M, F 910; 603 36.6 ± 9.2 Optimal DM, Dys, eBP
Li et al26 US Non-Asian M, F 2,994; 3,283 .20 Optimal DM
Li and McDermott27 Australian Aboriginal
Non-Asian M, F 760; 881 15–74 Optimal DM, Dys, eBP
Li et al28 Taiwanese Asian M, F 21,038; 15,604 37.2 ± 9.4 Optimal DM, eBP
Lin et al29 Chinese Asian M, F 26,359; 29,204 37.3 ± 10.9 Optimal DM, Dys, eBP
Mansour and Al-Jazairi30
iraqi Non-Asian M, F 6,693; 6,293 .18 Optimal DM, eBP
Nakamura et al43 Japanese Asian M, F 330; 514 40–69 Optimal MetS
Park et al31 Korean Asian M, F 2,327; 3,102 .20 Optimal DM, eBP
Pua and Ong32 Singaporean Asian F 566 18–68 Optimal DM, Dys, eBP
Rodrigues et al38 Brazilian Non-Asian M, F 759; 896 25–64 Optimal eBP, MetS
Schneider et al33 German Non-Asian M, F 2,016; 3,361 20–79 Optimal DM, Dys, MetS
Silva et al39 Brazilian Non-Asian M, F 754; 928 20–59 Optimal eBP
Singh et al40 indian Asian M, F 3,118 .30 Optimal eBP
Tseng et al34 Taiwanese Asian M, F 2,280; 2,403 44.5 ± 11.9 Optimal DM, Dys, eBP
wakabayashi and Daimon44
Japanese Asian M, F 37,697; 19,891 35–70 Optimal MetS
Prospective studies
Aekplakorn et al50 Thai Asian M 2,536 35–59 Optimal incident CvD
Chei et al45 Japanese Asian M, F 974; 1,998 40–69 Percentiles incident DM
Gelber et al51 US Non-Asian M, F 16,332; 32,700 40–84; $45 Percentiles incident CvD
Huerta et al46 Spanish Non-Asian M, F 14,019; 23,714 30–65 Optimal incident DM
Jia et al47 Chinese Asian M, F 48,015; 13,688 18–85 Optimal incident DM
Petursson et al53 Norwegian Non-Asian M, F 26,461; 30,510 20–79 Percentiles All-cause mortality,
CvD mortality
Sargeant et al48 Jamaican Non-Asian M, F 290; 438 25–74 Optimal incident DM
welborn and Dhaliwal54 Australian Non-Asian M, F 4,508; 4,698 20–69 Optimal All-cause mortality,
CvD mortality
Xu et al49 Chinese Asian M, F 1,384; 1,647 .35 Optimal incident DM
Zhang et al52 Chinese Asian F 67,083 40–70 Percentiles incident CvD
Abbreviations: BMi, body mass index; CvD, cardiovascular disease; DM, diabetes mellitus; Dys, dyslipidemia; eBP, elevated blood pressure; MetS, metabolic syndrome; SD, standard deviation; wHtR, waist-to-height ratio.
Similarly, in Asians, after removing the study of Hsu et al35
(ie, eight data units), the association remained statistically significant in favor of WHtR (rRR: 0.93, 95% CI: 0.89–0.97). A similar analysis was not performed in non-Asians because of the limited number of studies.
Results from prospective studies
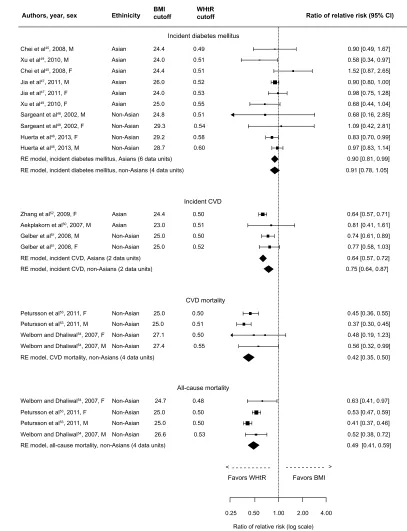
Associations from available prospective studies are presented in Figure 6. The assessed outcomes were incident DM, inci-dent CVD, CVD mortality, and all-cause mortality. Regarding the two mortality outcomes, data were available only from
Diabetes, Metabolic Syndrome and Obesity: Targets and Therapy downloaded from https://www.dovepress.com/ by 118.70.13.36 on 21-Aug-2020
Dovepress Predicting cardiometabolic risk: waist-to-height ratio or BMi Table 2 Summary of optimal exposure cutoffs from cross-sectional studies
Outcome Asians Non-Asians
Number of data units Median (min, max) Number of data units Median (min, max)
waist-to-height ratio
Diabetes mellitus 15 0.510 (0.480, 0.530) 12 0.560 (0.500, 0.620)
Dyslipidemia 13 0.480 (0.450, 0.520) 6 0.526 (0.500, 0.600)
elevated blood pressure 20 0.510 (0.450, 0.530) 14 0.528 (0.490, 0.600)
Metabolic syndrome 10 0.520 (0.500, 0.540) 6 0.550 (0.530, 0.610)
Body mass index (kg/m2)
Diabetes mellitus 15 24.3 (23.2, 25.5) 12 26.1 (23.8, 35.0)
Dyslipidemia 13 23.7 (22.1, 25.0) 6 25.2 (23.9, 26.8)
elevated blood pressure 20 24.1 (21.2, 26.3) 14 26.2 (23.6, 31.7)
Metabolic syndrome 10 24.3 (22.6, 26.0) 6 26.7 (25.8, 30.3)
Authors, year BMIcutoff WHtRcutoff Ratio of relative risk (95% Cl)
Non-Asian populations Sex
Li and McDermont27, 2010
Lin et al29, 2002
Lin et al29, 2002
Li et al28, 2013
Li et al28, 2013
Ko et al25, 1999
Ko et al25, 1999
Park et al31, 2009
Ho et al24, 2003
Ho et al24, 2003
Pua and Ong32, 2005
Tseng et al34, 2010
Tseng et al34, 2010
Dong et al23, 2011
Dong et al23, 2011
Mansour and Al-Jazairi30, 2007
Mansour and Al-Jazairi30, 2007
Berber et al21, 2001
Berber et al21, 2001
Li et al26, 2010
Li et al26, 2010
Li and McDermont27, 2010
Schneider et al33, 2007
Schneider et al33, 2007
Craig et al22, 2007
Craig et al22, 2007
RE model, male non-Asians (6 data units) RE model, female non-Asians (6 data units) RE model, all non-Asians (12 data units)
RE model, male Asians (7 data units) RE model, female Asians (8 data units) RE model, all Asians (15 data units)
RE model, all data units
Favors WHtR
Ratio of relative risk (log scale) Favors BMI
0.25 0.50 1.00 2.00 4.00
M 23.8 25.4 25.3 28.0 28.0 31.7 25.4 26.0 26.1 27.8 25.8 35.0 0.500 0.520 0.525 0.560 0.590 0.600 0.535 0.560 0.560 0.580 0.600 0.620
0.89 [0.42, 1.88] 0.56 [0.46, 0.68] 1.69 [1.12, 2.54] 0.74 [0.54, 1.01] 0.86 [0.65, 1.15] 0.89 [0.23, 3.42] 1.16 [0.87, 1.56] 0.67 [0.48, 0.94] 0.50 [0.41, 0.61] 0.92 [0.69, 1.24] 0.43 [0.21, 0.89] 0.80 [0.34, 1.86] 0.86 [0.61, 1.22] 0.73 [0.53, 0.99] 0.79 [0.63, 0.99]
0.68 [0.49, 0.95] 0.44 [0.30, 0.63] 0.74 [0.31, 1.74] 0.75 [0.53, 1.06] 0.55 [0.32, 0.95] 1.17 [0.72, 1.89] 0.83 [0.54, 1.26] 0.59 [0.39, 0.89] 0.64 [0.40, 1.02] 1.33 [0.12,15.41] 0.66 [0.38, 1.17] 0.50 [0.14, 1.72] 0.90 [0.49,1.65] 0.18 [0.12, 0.27] 1.03 [0.66, 1.61] 0.70 [0.55, 0.89] 0.59 [0.37, 0.92] 0.64 [0.50, 0.83]
0.71 [0.59, 0.84] M M M M M F F F F F F M 24.5 25.2 24.3 23.8 24.4 25.5 25.0 23.4 23.9 23.2 23.3 24.3 23.2 24.5 0.500 Asian populations 0.503 0.508 0.510 0.520 0.520 0.530 0.480 0.497 0.500 0.500 0.512 0.520 0.520 M M M M M M F F F F F F F > >
Park et al31, 2009 F 23.6 0.520
Figure 2 Forest plot for discrimination of diabetes mellitus in cross-sectional studies with optimal BMi and wHtR cutoffs.
Abbreviations: BMI, body mass index; CI, confidence interval; RE, random effects; WHtR, waist-to-height ratio.
Diabetes, Metabolic Syndrome and Obesity: Targets and Therapy downloaded from https://www.dovepress.com/ by 118.70.13.36 on 21-Aug-2020
Dovepress
Savva et al
non-Asian populations. Although there were only four data units from only two studies for each mortality outcome, the results were well in favor of WHtR compared to BMI; pooled rRR for CVD mortality was 0.42 (95% CI: 0.35–0.50) and, for all-cause mortality, 0.49 (95% CI: 0.41–0.59). Results were also in favor of WHtR compared to BMI regarding incident
CVD in both Asians (rRR: 0.64, 95% CI: 0.57–0.72) and non-Asians (rRR: 0.75, 95% CI: 0.64–0.87). Finally, WHtR was superior in detecting incident DM in Asian populations (rRR: 0.90, 95% CI: 0.81–0.99) but not in non-Asian populations (rRR: 0.91, 95% CI: 0.78–1.05). Due to the small number of data units, within-sex analyses were not performed.
Authors, year BMIcutoff WHtRcutoff Ratio of relative risk (95% Cl)
Non-Asian populations Sex
Li and McDermont27, 2010
Li and McDermont27, 2010
Lin et al29, 2002
Lin et al29, 2002
Ko et al25, 1999
Ko et al25, 1999
Hsu et al35, 2011
Hsu et al35, 2011
Ho et al24, 2003
Ho et al24, 2003
Pua and Ong32, 2005
Tseng et al34, 2010
Tseng et al34, 2010
Dong et al23, 2011
Dong et al23, 2011
Berber et al21, 2001
Berber et al21, 2001
Schneider et al33, 2007
Schneider et al33, 2007
RE model, male non-Asians (3 data units) RE model, female non-Asians (3 data units) RE model, all non-Asians (6 data units)
RE model, male Asians (6 data units)
RE model, female Asians (7 data units)
RE model, all Asians (13 data units)
RE model, all data units
Ratio of relative risk (log scale)
Favors WHtR Favors BMI
0.50 1.00 2.00 4.00
M 23.9
24.9
26.8
25.2
25.9
25.1
0.500
0.570 0.525
0.530
0.550
0.600
0.96 [0.75, 1.24]
2.52 [2.20, 2.88]
0.94 [0.85, 1.04]
2.06 [1.88, 2.25]
0.92 [0.83, 1.02]
0.82 [0.64, 1.05]
1.31 [0.70, 2.50] 1.24 [0.66, 2.06] 1.24 [0.84, 1.83]
0.86 [0.73, 101]
0.97 [0.92, 1.02]
0.88 [0.77, 1.02]
0.96 [0.84, 1.09]
0.98 [0.90, 1.06]
0.98 [0.86, 1.12]
0.83 [0.75, 0.91]
0.98 [0.91, 1.06]
0.95 [0.83, 1.09]
0.79 [0.66, 0.94]
0.82 [0.60,1.14]
0.94 [0.68, 1.30]
0.88 [0.77, 1.00] 0.96 [0.92, 0.99]
0.89 [0.83, 0.96]
0.92 [0.88, 0.96]
1.00 [0.87, 1.15] M
M F
F
F
M 23.0
23.7
25.0
23.9
24.2
24.5
22.1
22.8
22.6
23.4
23.9
25.0
0.479
Asian populations
0.480
0.480
0.500
0.510
0.520
0.450
0.470
0.480 0.480 0.480
0.520 M
M M
M
M
M
F
F
F
F
F
F
>
>
23.2 0.485
F
Figure 3 Forest plot for discrimination of dyslipidemia in cross-sectional studies with optimal BMi and wHtR cutoffs.
Abbreviations: BMI, body mass index; CI, confidence interval; RE, random effects; WHtR, waist-to-height ratio.
Diabetes, Metabolic Syndrome and Obesity: Targets and Therapy downloaded from https://www.dovepress.com/ by 118.70.13.36 on 21-Aug-2020
Dovepress Predicting cardiometabolic risk: waist-to-height ratio or BMi
Authors, year BMIcutoff WHtRcutoff Ratio of relative risk (95% Cl)
Non-Asian populations
Sex
Li and McDermont27, 2010
Singh et al40, 2012
Dong et al23, 2011
Deshmukh et al36, 2006
Li et al28, 2013
Li et al28, 2013
Lin et al29, 2002
Lin et al29, 2002
Ko et al25, 1999
Ho et al24, 2003
Deshmukh et al36, 2006
Park et al31, 2009
Park et al31, 2009
Tseng et al34, 2010
Tseng et al34, 2010
Hsu et al35, 2011
Hsu et al35, 2011
Ko et al25, 1999
Ho et al24, 2003
Dong et al23, 2011
Silva et al39, 2013
Silva et al39, 2013
Khader et al37, 2010
Mansour and Al-Jazairi30, 2007
Mansour and Al-Jazairi30, 2007
Khader et al37, 2010
Berber et al21, 2001
Berber et al21, 2001
Rodrigues et al38, 2010
Rodrigues et al38, 2010
Li and McDermont27, 2010
Craig et al22, 2007
Craig et al22, 2007
RE model, male non-Asians (6 data units) RE model, female non-Asians (8 data units) RE model, all non-Asians (14 data units)
RE model, male Asians (9 data units) RE model, female Asians (10 data units) RE model, all Asians (20 data units)
RE model, all data units
Favors WHtR
Ratio of relative risk (log scale) Favors BMI
0.25 0.50 1.00 2.00 4.00
M 24.6 23.6 27.2 25.6 24.9 24.9 30.0 26.2 26.2 26.6 29.3 26.5 25.9 31.7 0.500 0.500 0.500 0.520 0.525 0.550 0.490 0.510 0.530 0.535 0.560 0.600 0.600 0.590
0.70 [0.38, 1.30] 0.04 [0.83, 1.30] 1.99 [0.80, 1.21] 0.84 [0.67, 1.05] 4.06 [3.11, 5.29] 0.76 [0.63, 0.92] 1.02 [0.75, 1.37] 0.98 [0.85, 1.12]
3.09 [2.62, 3.65] 0.76 [0.58, 0.99]
0.83 [0.59, 1.18] 0.68 [0.57, 0.81] 0.92 [0.47, 1.78] 1.02 [0.75, 1.37] 1.12 [0.66, 1.89] 1.04 [0.73, 1.47] 1.07 [0.80, 1.43]
0.75 [0.53, 1.06] 1.23 [0.80, 1.90] 0.91 [0.83, 1.01] 0.71 [0.47, 1.09] 0.62 [0.53, 0.72]
0.70 [0.44, 1.13] 0.78 [0.65, 0.93]
0.89 [0.75, 1.04] 1.42 [1.11, 1.81] 1.00 [0.81, 1.24] 1.31 [0.93, 1.85] 0.75 [0.66, 0.86] 0.71 [0.53, 0.94] 0.91 [0.73, 1.13] 0.94 [0.69, 1.28] 1.28 [0.56, 2.92] 0.59 [0.48, 0.72] 0.42 [0.15, 1.20] 0.77 [0.46, 1.29] 1.56 [1.00, 2.42]
0.87 [0.77, 0.98]
0.95 [0.83, 1.11] 0.87 [0.71, 1.06] 0.89 [0.74, 1.06] M M M M M F F F F F F F F M
M and F 25.0
21.7 23.9 23.8 25.7 24.6 25.9 24.5 25.0 26.3 21.2 22.5 23.5 23.8 23.1 24.3 0.500 Asian populations 0.480 0.450 0.465 0.509 0.510 0.510 0.520 0.520 0.520 0.450 0.460 0.490 0.485 0.500 0.510 0.510 0.520 0.530 M M M M M M M M F F F F F F F F F > >
Pua and Ong32, 2005 23.4
24.1
24.5 24.1
0.515 F
Figure 4 Forest plot for discrimination of elevated blood pressure in cross-sectional studies with optimal BMi and wHtR cutoffs.
Abbreviations: BMI, body mass index; CI, confidence interval; RE, random effects; WHtR, waist-to-height ratio.
Quality assessment
Results of quality assessment for the selected studies are presented in Tables S1 and S2. In prospective studies (Table S1), eight out of the ten studies received 7 or 8 stars;
two studies received lower scores, ie, the study of Jia et al47
in Asians and the study of Sargeant et al48 in non-Asians,
both of which gave data for incident DM. Sensitivity analysis
in Asians, excluding the study of Jia et al,47 attenuated the
association (rRR: 0.84, 95% CI: 0.55–1.27). Sensitivity analysis in non-Asians did not alter the association, which remained in favor of neither of the exposures (rRR: 0.90, 95% CI: 0.73–1.12).
Diabetes, Metabolic Syndrome and Obesity: Targets and Therapy downloaded from https://www.dovepress.com/ by 118.70.13.36 on 21-Aug-2020
Dovepress
Savva et al
Authors, year BMIcutoff WHtRcutoff Ratio of relative risk (95% Cl)
Non-Asian populations
Asian populations
Sex
Schneider et al33, 2007
Schneider et al33, 2007
Al-Odat et al41, 2012
Al-Odat et al41, 2012
He et al42, 2012
He et al42, 2012
Nakamura et al43, 2011
Nakamura et al43, 2011
Wakabayashi and Daimon44, 2012
Wakabayashi and Daimon44, 2012
Hsu et al35, 2011
Hsu et al35 2011
Dong et al23, 2011
Dong et al23, 2011
Rodrigues et al38, 2010
Rodrigues et al38, 2010
RE model, male non-Asians (3 data units)
RE model, female non-Asians (3 data units)
RE model, all non-Asians (6 data units)
RE model, all data units
Favors WHtR
Ratio of relative risk (log scale) Favors BMI
0.50 1.00 2.00 4.00
M
26.5 26.0
28.4
25.8
30.3 26.8
0.53
0.56
0.61
0.54
0.54
0.61
0.95 [0.69, 1.30]
0.97 [0.78, 1.20]
0.85 [0.60, 1.21]
0.89 [0.70, 1.12]
0.91 [0.66, 1.25]
0.86 [0.53, 1.38]
0.94 [0.80, 1.10]
0.89 [0.75, 1.06]
0.92 [0.81, 1.03]
0.93 [0.87, 0.99]
0.91 [0.83, 0.99]
0.92 [0.89, 0.96]
0.92 [0.89, 0.96] 0.92 [0.87, 0.96]
1.12 [0.83, 1.51]
1.43 [0.84, 2.45]
0.86 [0.70, 1.07]
1.02 [0.81, 1.28]
0.74 [0.57, 0.96]
0.88 [0.69, 1.13]
0.94 [0.85, 1.04]
0.90 [0.62, 1.29]
1.37 [0.70, 2.69] M
M
F F
F
M
M
M
M
M
F
F
F
F
F 24.0
26.0
22.9
24.7
25.0
24.0
25.0
23.0
24.5
22.6
0.52
0.52
0.52 0.50 0.50
0.52
0.52
0.50
0.50
0.54
> >
RE model, male Asians (5 data units)
RE model, female Asians (5 data units)
RE model, all Asians (10 data units)
Figure 5 Forest plot for discrimination of metabolic syndrome in cross-sectional studies with optimal BMi and wHtR cutoffs.
Abbreviations: BMI, body mass index; CI, confidence interval; RE, random effects; WHtR, waist-to-height ratio.
In cross-sectional studies, 22 of the included 24 studies received 4 or 5 stars out of the maximum 5. Two studies
scored 3 stars – the study of Berber et al21 in non-Asians
and the study of Tseng et al34 in Asians. Both studies gave
data for the outcomes of DM, elevated blood pressure, and dyslipidemia. Sensitivity analysis, excluding results from the
study of Tseng et al in Asians,34 did not alter the findings.
In non-Asians, excluding the study of Berber et al21 did not
alter the association for DM, which remained in favor of WHtR; however, it resulted in statistically significant asso-ciations in favor of WHtR regarding elevated blood pressure
(rRR: 0.87, 95% CI: 0.79–0.96) and dyslipidemia (rRR: 0.92, 95% CI: 0.86–0.99).
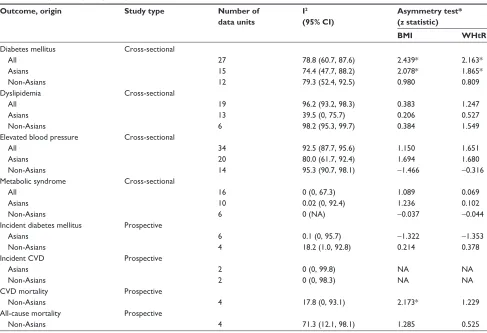
Heterogeneity and publication biases
A substantial heterogeneity among the results was observed
in those outcomes having low uncertainty in I2 (Table 3).
The low uncertainty in I2 is indicated by the relatively
small range of its 95% CI. This substantial heterogeneity is not surprising, given the observed differences between Asians and non-Asians. When there was a high uncertainty
in I2, then no safe conclusions could be made about the
Diabetes, Metabolic Syndrome and Obesity: Targets and Therapy downloaded from https://www.dovepress.com/ by 118.70.13.36 on 21-Aug-2020
Dovepress Predicting cardiometabolic risk: waist-to-height ratio or BMi
Authors, year, sex Ethinicity BMIcutoff WHtRcutoff Ratio of relative risk (95% Cl)
Incident diabetes mellitus
Incident CVD Chei et al45, 2008, M
Chei et al45, 2008, F
Xu et al49, 2010, M
Xu et al49, 2010, F
Sargeant et al48, 2002, M
Sargeant et al48, 2002, F
Huerta et al46, 2013, F
Huerta et al46, 2013, M
Jia et al47, 2011, M
Jia et al47, 2011, F
RE model, incident diabetes mellitus, non-Asians (4 data units) RE model, incident diabetes mellitus, Asians (6 data units)
RE model, incident CVD, Asians (2 data units) RE model, incident CVD, non-Asians (2 data units)
RE model, CVD mortality, non-Asians (4 data units) 24.4
24.0
24.0
25.0 24.8
29.3
29.2 28.7 24.4
26.0
0.49
0.51
0.53
0.55 0.51
0.54
0.58 0.60 0.51
0.52 Asian
Asian Asian
Asian Asian
Asian Non-Asian
Non-Asian
Zhang et al52, 2009, F
Aekplakorn et al50, 2007, M
Gelber et al51, 2008, M
Gelber et al51, 2008, F
24.4 23.0
25.0 25.0
0.50 0.51
0.50 0.52 Asian
Asian
Non-Asian Non-Asian
CVD mortality
All-cause mortality
Favors WHtR Favors BMI
Petursson et al53, 2011, F
Petursson et al53, 2011, M
Welborn and Dhaliwal54, 2007, F
Welborn and Dhaliwal54, 2007, M
25.0 25.0 27.1
27.4
0.50 0.51 0.50
0.55 Non-Asian
Non-Asian Non-Asian Non-Asian
RE model, all-cause mortality, non-Asians (4 data units) Petursson et al53, 2011, F
Petursson et al53, 2011, M
Welborn and Dhaliwal54, 2007, F
Welborn and Dhaliwal54, 2007, M
24.7
25.0 25.0
26.6
0.48
0.50 0.50
0.53 Non-Asian
Non-Asian Non-Asian
Non-Asian Non-Asian Non-Asian
0.90 [0.49, 1.67]
0.58 [0.34, 0.97] 1.52 [0.87, 2.65]
0.90 [0.80, 1.00] 0.98 [0.75, 1.28]
0.68 [0.44, 1.04] 0.68 [0.16, 2.85]
1.09 [0.42, 2.81]
0.83 [0.70, 0.99] 0.97 [0.83, 1.14]
0.64 [0.57, 0.71] 0.81 [0.41, 1.61]
0.74 [0.61, 0.89] 0.77 [0.58, 1.03] 0.90 [0.81, 0.99]
0.91 [0.78, 1.05]
0.64 [0.57, 0.72]
0.45 [0.36, 0.55] 0.37 [0.30, 0.45] 0.48 [0.19, 1.23]
0.56 [0.32, 0.99]
0.42 [0.35, 0.50]
0.63 [0.41, 0.97]
0.53 [0.47, 0.59] 0.41 [0.37, 0.46]
0.52 [0.38, 0.72]
0.25 0.50
Ratio of relative risk (log scale) 1.00 2.00 4.00
>
0.49 [0.41, 0.59] 0.75 [0.64, 0.87]
<
Figure 6 Forest plot for discrimination of incident diabetes mellitus, incident CvD, CvD mortality, and all-cause mortality in prospective studies with BMi and wHtR.
Abbreviations: BMI, body mass index; CI, confidence interval; CVD, cardiovascular disease; RE, random effects; WHtR, waist-to-height ratio.
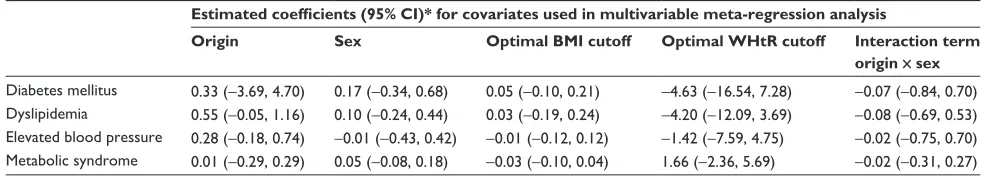
heterogeneity of the results. We further explored between-study heterogeneity by meta-regression analysis for the predefined study-level covariates in outcomes from the cross-sectional studies (Table S3). None of these covari-ates has a significant relationship with the log of RR and, therefore, they cannot help in explaining the heterogeneity between the studies.
Regarding publication bias, Egger’s regression tests imply that there is asymmetry in the funnel plots regarding DM in cross-sectional studies for both BMI and WHtR, both overall and in Asians. There was also an indication for asym-metry in the funnel plot regarding CVD mortality in BMI studies. In the remaining outcomes, there was no indication of possible publication bias.
Diabetes, Metabolic Syndrome and Obesity: Targets and Therapy downloaded from https://www.dovepress.com/ by 118.70.13.36 on 21-Aug-2020
Dovepress
Savva et al
Table 3 Study heterogeneity and publication biases
Outcome, origin Study type Number of
data units
I2 (95% CI)
Asymmetry test* (z statistic)
BMI WHtR
Diabetes mellitus All
Asians Non-Asians
Cross-sectional
27 15 12
78.8 (60.7, 87.6) 74.4 (47.7, 88.2) 79.3 (52.4, 92.5)
2.439* 2.078* 0.980
2.163* 1.865* 0.809 Dyslipidemia
All Asians Non-Asians
Cross-sectional
19 13 6
96.2 (93.2, 98.3) 39.5 (0, 75.7) 98.2 (95.3, 99.7)
0.383 0.206 0.384
1.247 0.527 1.549 elevated blood pressure
All Asians Non-Asians
Cross-sectional
34 20 14
92.5 (87.7, 95.6) 80.0 (61.7, 92.4) 95.3 (90.7, 98.1)
1.150 1.694
-1.466
1.651 1.680
-0.316 Metabolic syndrome
All Asians Non-Asians
Cross-sectional
16 10 6
0 (0, 67.3) 0.02 (0, 92.4) 0 (NA)
1.089 1.236
-0.037
0.069 0.102
-0.044 incident diabetes mellitus
Asians Non-Asians
Prospective
6 4
0.1 (0, 95.7) 18.2 (1.0, 92.8)
-1.322 0.214
-1.353 0.378 incident CvD
Asians Non-Asians
Prospective
2 2
0 (0, 99.8) 0 (0, 98.3)
NA NA
NA NA CvD mortality
Non-Asians
Prospective
4 17.8 (0, 93.1) 2.173* 1.229
All-cause mortality Non-Asians
Prospective
4 71.3 (12.1, 98.1) 1.285 0.525
Note: *P-value for z statistic ,0.05.
Abbreviations: BMI, body mass index; CI, confidence interval; CVD, cardiovascular disease; NA, not applicable; WHtR, waist-to-height ratio.
Discussion
Summary of evidence
This meta-analysis was based on 34 studies, of which 24 were cross-sectional and ten prospective, with more than 500,000 participants. The results demonstrate that the pooled rRR of BMI to WHtR was in favor of WHtR in detecting DM, dyslipidemia, elevated blood pressure, and MetS in Asian populations and DM in non-Asian populations in cross-sectional studies. At this point, it should be noted that, in non-Asian populations, as far as dyslipidemia and elevated blood pressure are concerned, data from the study of Berber
et al21 appear to be extremely in favor of BMI. However, the
quality assessment of this study was rather poor, and when we removed these data units from the analysis, the pooled rRR proved also in favor of WHtR in both outcomes. WHtR was also superior to BMI in detecting incident DM and incident CVD in Asian populations and incident CVD, CVD mortality, and all-cause mortality in non-Asian populations in prospective studies. Regarding CVD mortality and all-cause mortality outcomes, it should be noted that data were avail-able only from non-Asian populations. The performance of
rRR was generally similar in male and female participants in cross-sectional studies, whereas sex-specific analysis was not performed in prospective studies because of the limited number of data units. BMI did not prove superior to WHtR in any of the evaluated outcomes when all data units were analyzed, or within ethnicity and sex subgroup analysis.
Considerations about this meta-analysis
To the best of our knowledge, this is the first meta-analysis that has examined the pooled rRR of BMI to WHtR in detect-ing cardiometabolic outcomes usdetect-ing optimal cutoffs of the two exposure measures. The superiority of WHtR compared to BMI in certain cardiometabolic outcomes documented in our meta-analysis is in line with other meta-analyses that demonstrated that WHtR is superior to BMI in detecting
several cardiometabolic risk factors12 and, particularly, DM.14
On the other hand, two other meta-analyses did not provide evidence that WHtR was superior to BMI or that BMI was
superior to WHtR in detecting cardiometabolic risk.13,15
Obesity remains a huge challenge globally, because it is one of the most important causes of premature death.
Diabetes, Metabolic Syndrome and Obesity: Targets and Therapy downloaded from https://www.dovepress.com/ by 118.70.13.36 on 21-Aug-2020
Dovepress Predicting cardiometabolic risk: waist-to-height ratio or BMi
In an effort to optimize identification of high-risk individuals,
new indices are proposed, such as the Body Shape Index.55
There are, however, several reasons why WHtR has been proposed as a useful single global index to determine health
risks.10 The results from the present and other meta-analyses,
when taken together, may justify the use of WHtR or other abdominal obesity proxy measures as a single screening tool for cardiometabolic risk rather than BMI. This may be justified given the low sensitivity of BMI in detecting excess
body fat56 and metabolic risk57 and because of the “J”-shape
association of BMI with cardiovascular risk stratification.56
Compared to WC, which is currently the most widely used index of abdominal obesity, WHtR is thought to be better in discriminating cardiometabolic risk because it takes into account height, which is important particularly in shorter individuals.58
One of the proposed advantages in using WHtR instead of BMI is the ability to use one single cutoff point (0.5) in all ages, both sexes, and all ethnicities.11,57,59 This provides a
sim-ple public health message: “Keep your waist circumference
to less than half your height.”11 However, it should be noted
that our results from cross-sectional studies indicated that the optimal cutoff of WHtR was substantially higher than the simple cutoff of 0.5, particularly in non-Asians. Therefore, we may argue that the use of this single cutoff point is not justified with the results of the present meta-analysis and that further evidence is warranted to clarify this issue.
One of the issues pertaining to WHtR is the point of WC measurement. It has been suggested that measuring WC at the level of umbilicus rather than at the narrowest point between the lower costal border and the top of the iliac crest improves sensitivity in detecting percent excess fat, particularly in
women.60 On the other hand, Ashwell and Browning have
suggested measuring WC midway between the lower rib and iliac crest simply because this was the most often-used measurement they found in a review and because this was the preferred site of measurement recommended by the World
Health Organization (WHO).61
Limitations
The main advantage of a meta-analysis is the calculation of effect sizes with more precision compared to data of a single study. Although we aimed to choose specific and robust cutoffs for the definition of the utilized outcomes for this meta-analysis, outcome-specific bias cannot be excluded due to the combination of data from different studies in which different definitions for each outcome were used. Furthermore, as far as certain outcomes are concerned, the
number of available studies was limited. There were only three studies for dyslipidemia and MetS in non-Asians, three studies for incident CVD, and just two studies for CVD and all-cause mortality.
The small number of included studies for certain out-comes in non-Asians prevented us from further evaluating the discriminating ability of BMI and WHtR within non-Asian subpopulations, such as Caucasians, blacks, and so on. This would be an important task given the current WHO recom-mendation of using a single BMI cutoff for non-Asians, but also on the suggestion of using a single cutoff of WHtR in
evaluating cardiometabolic risk.11
In this meta-analysis, participants belonging to any ethnicity were included. Therefore, we opted to use studies reporting results based on optimal cutoffs for the exposure indices rather than the “standard” cutoffs (eg, WHtR 0.5, BMI
23 kg/m2 in Asians or 25 kg/m2 in non-Asians). However, in
prospective studies, we included studies irrespective of selec-tion of exposure cutoffs because of the limited number of data units in certain outcomes. Another issue with prospective studies is the unknown effect of follow-up duration (ranges from 2 to 17 years) on the estimated effect size.
In the present meta-analysis, we opted to compare the discriminative analysis of BMI, which is an index of general adiposity, with WHtR, an index of abdominal adiposity, in detecting cardiometabolic risk for those reasons already mentioned. However, it should be underlined that other indices measuring abdominal adiposity have been also
found to be superior to BMI. Although Ashwell et al12 have
demonstrated that WHtR is superior to WC in detecting cardiometabolic risk, more research may be needed to docu-ment this superiority.
Publication bias might account for some of the observed effect sizes regarding DM in cross-sectional studies and CVD mortality. Moreover, the results of this meta-analysis should be interpreted cautiously because of the presence of heterogeneity in some of the outcomes and the high
uncer-tainty about I2 statistics in other outcomes. Meta-regression
showed that none of the predefined covariates could explain part of the heterogeneity between the studies in the outcomes regarding DM, elevated blood pressure, dyslipidemia, and MetS in cross-sectional studies.
Conclusion
This meta-analysis provides evidence that WHtR is superior to BMI in detecting several cardiometabolic risk factors, both in cross-sectional and prospective studies. Despite the heteroge-neity of results among studies and evidence of asymmetry in
Diabetes, Metabolic Syndrome and Obesity: Targets and Therapy downloaded from https://www.dovepress.com/ by 118.70.13.36 on 21-Aug-2020
Dovepress
Savva et al
some of the outcomes, it is important to emphasize that BMI was not superior to WHtR in detecting any of the evaluated outcomes in this study, and thus we conclude that WHtR can be used as a screening tool for cardiometabolic risk at least as efficiently as BMI in both Asian and non-Asian populations.
Acknowledgment
The authors are grateful to George Kafatos for his critical comments on the manuscript draft. They are also grateful to Nanette Christou for her valuable help in the preparation of the manuscript.
Disclosure
The evidence synthesis upon which this meta-analysis was based was not funded by any external source. The authors report no conflicts of interest in this work.
References
1. Duggleby SL, Jackson AA, Godfrey KM, Robinson SM, Inskip HM; Southampton Women’s Survey Study Group. Cut-off points for anthropometric indices of adiposity: differential classification in a large population of young women. Br J Nutr. 2009;101(3):424–430. 2. Vazquez G, Duval S, Jacobs DR Jr, Silventoinen K. Comparison of body
mass index, waist circumference, and waist/hip ratio in predicting inci-dent diabetes: a meta-analysis. Epidemiol Rev. 2007;29(1):115–128. 3. de Koning L, Merchant AT, Pogue J, Anand SS. Waist
circumfer-ence and waist-to-hip ratio as predictors of cardiovascular events: meta-regression analysis of prospective studies. Eur Heart J. 2007; 28(7):850–856.
4. Czernichow S, Kengne AP, Stamatakis E, Hamer M, Batty GD. Body mass index, waist circumference and waist-hip ratio: which is the better discriminator of cardiovascular disease mortality risk?: evidence from an individual-participant meta-analysis of 82 864 participants from nine cohort studies. Obes Rev. 2011;12(9):680–687.
5. Ashwell M, Cole TJ, Dixon AK. Ratio of waist circumference to height is strong predictor of intra-abdominal fat. Br Med J. 1996; 313(7056):559–560.
6. Cox BD, Whichelow M. Ratio of waist circumference to height is better predictor of death than body mass index. Br Med J. 1996; 313(7070):1487.
7. Hsieh SD, Yoshinaga H. Waist/height ratio as a simple and useful predictor of coronary heart disease risk factors in women. Intern Med. 1995;34(12):1147–1152.
8. Savva SC, Tornaritis M, Savva ME, et al. Waist circumference and waist-to-height ratio are better predictors of cardiovascular disease risk factors in children than body mass index. Int J Obes Relat Metab Disord. 2000;24(11):1453–1458.
9. Hara M, Saitou E, Iwata F, Okada T, Harada K. Waist-to-height ratio is the best predictor of cardiovascular disease risk factors in Japanese schoolchildren. J Atheroscler Thromb. 2002;9(3):127–132.
10. Ashwell M, Hsieh SD. Six reasons why the waist-to-height ratio is a rapid and effective global indicator for health risks of obesity and how its use could simplify the international public health message on obesity. Int J Food Sci Nutr. 2005;56(5):303–307.
11. Browning LM, Hsieh SD, Ashwell M. A systematic review of waist-to-height ratio as a screening tool for the prediction of cardiovascular disease and diabetes: 0.5 could be a suitable global boundary value. Nutr Res Rev. 2010;23(2):247–269.
12. Ashwell M, Gunn P, Gibson S. Waist-to-height ratio is a better screening tool than waist circumference and BMI for adult cardio-metabolic risk factors: systematic review and meta-analysis. Obes Rev. 2012;13(3):275–286.
13. Barzi F, Woodward M, Czernichow S, et al. The discrimination of dys-lipidaemia using anthropometric measures in ethnically diverse popu-lations of the Asia-Pacific Region: the Obesity in Asia Collaboration. Obes Rev. 2010;11(2):127–136.
14. Kodama S, Horikawa C, Fujihara K, et al. Comparisons of the strength of associations with future type 2 diabetes risk among anthropometric obesity indicators, including waist-to-height ratio: a meta-analysis. Am J Epidemiol. 2012;176(11):959–969.
15. van Dijk S, Takken T, Prinsen E, Wittink H. Different anthropometric adiposity measures and their association with cardiovascular disease risk factors: a meta-analysis. Neth Heart J. 2012;20(5):208–218. 16. Friedemann C, Heneghan C, Mahtani K, Thompson M, Perera R,
Ward AM. Cardiovascular disease risk in healthy children and its association with body mass index: systematic review and meta-analysis. Br Med J. 2012;345:e4759.
17. Wells G, Shea B, O’Connel D, et al. The Newcastle-Ottawa Scale (NOS) for assessing the quality of nonrandomised studies in meta-analyses [webpage on the Internet]. Ottawa, ON: Ottawa Hospital Research Institute; 2013. Available from: http://www.ohri.ca/programs/ clinical_ epidemiology/oxford.asp. Accessed August 2, 2013.
18. DerSimonian R, Laird N. Meta-Analysis in Clinical Trials. Control Clinl Trials. 1986; 7(3), 177–188.
19. Viechtbauer W. Conducting meta-analyses in R with the metafor package. J Stat Softw. 2010;36(3):1–48.
20. RCoreTeam. R: A Language and Environment for Statistical Computing. Vienna: R Foundation for Statistical Computing; 2013. Available from: http:/www.R-project.org. Accessed May 5, 2013.
21. Berber A, Gómez-Santos R, Fanghänel G, Sánchez-Reyes L. Anthropometric indexes in the prediction of type 2 diabetes mellitus, hypertension and dyslipidaemia in a Mexican population. Int J Obes Relat Metab Disord. 2001;25(12):1794–1799.
22. Craig P, Colagiuri S, Hussain Z, Palu T. Identifying cut-points in anthro-pometric indexes for predicting previously undiagnosed diabetes and cardiovascular risk factors in the Tongan population. Obes Res Clin Pract. 2007;1(1):17–25.
23. Dong X, Liu Y, Yang J, Sun Y, Chen L. Efficiency of anthropometric indicators of obesity for identifying cardiovascular risk factors in a Chinese population. Postgrad Med J. 2011;87(1026):251–256. 24. Ho SY, Lam TH, Janus ED. Hong Kong Cardiovascular Risk Factor
Prevalence Study Steering Committee. Waist to stature ratio is more strongly associated with cardiovascular risk factors than other simple anthropometric indices. Ann Epidemiol. 2003;13(10):683–691. 25. Ko GT, Chan JC, Cockram CS, Woo J. Prediction of hypertension,
diabetes, dyslipidaemia or albuminuria using simple anthropomet-ric indexes in Hong Kong Chinese. Int J Obes Relat Metab Disord. 1999;23(11):1136–1142.
26. Li C, Ford ES, Zhao G, Kahn HS, Mokdad AH. Waist-to-thigh ratio and diabetes among US adults: The Third National Health and Nutrition Examination Survey. Diabetes Res Clin Pract. 2010;89(1):79–87. 27. Li M, McDermott R. Using anthropometric indices to predict
cardio-metabolic risk factors in Australian indigenous populations. Diabetes Res Clin Pract. 2010;87(3):401–406.
28. Li WC, Chen IC, Chang YC, Loke SS, Wang SH, Hsiao KY. Waist-to-height ratio, waist circumference, and body mass index as indices of cardiometa-bolic risk among 36,642 Taiwanese adults. Eur J Nutr. 2013;52(1):57–65. 29. Lin WY, Lee LT, Chen CY, et al. Optimal cut-off values for obesity: using
simple anthropometric indices to predict cardiovascular risk factors in Taiwan. Int J Obes Relat Metab Disord. 2002;26(9):1232–1238. 30. Mansour AA, Al-Jazairi MI. Cut-off values for anthropometric variables
that confer increased risk of type 2 diabetes mellitus and hypertension in Iraq. Arch Med Res. 2007;38(2):253–258.
Diabetes, Metabolic Syndrome and Obesity: Targets and Therapy downloaded from https://www.dovepress.com/ by 118.70.13.36 on 21-Aug-2020