Article
Comparative Rice Bran Metabolomics across Diverse
Cultivars and Functional Rice Gene-Bran Metabolite
Relationships
Iman Zarei1, Emily Luna2, Jan E. Leach2, Anna McClung3, Samuel Vilchez4, Ousmane Koita5, and Elizabeth P. Ryan1*
1. Department of Environmental and Radiological Health Sciences, College of Veterinary Medicine and Biomedical Sciences, Colorado State University, Fort Collins, CO, USA.
2. Department of Bioagricultural Sciences and Pest Management, Colorado State University, Fort Collins, CO, USA.
3. USDA-Agricultural Research Service, Dale Bumpers National Rice Research Center, Stuttgart, AR, USA. 4. Center of Infectious Diseases, Department of Microbiology and Parasitology, Faculty of Medical Sciences,
National Autonomous University of Nicaragua, León (UNAN-León), León, Nicaragua.
5. Laboratoire de Biologie Moleculaire Appliquee, Faculté des Sciences et Techniques (FAST), University of Bamako, Bamako, Mali.
* Correspondence: e.p.ryan@colostate.edu
Abstract: Rice (Oryza sativa L.) processing yields ~60 million metric tons of bran annually. Rice genes producing bran metabolites of nutritional and human health importance were assessed across 17 diverse cultivars from seven countries using non-targeted metabolomics and resulted in 378-430 metabolites. Gambiaka cultivar had the highest number and Njavara had the lowest number of metabolites. The 71 rice bran compounds of significant variation by cultivar included 21 amino acids, seven carbohydrates, two metabolites from cofactors and vitamins, 33 lipids, six nucleotides, and two secondary metabolites. -ketoglutarate, γ-tocopherol/β-tocopherol and γ-tocotrienol are example bran metabolites with extensive cultivar variation and genetic information. 34 rice bran components that varied between cultivars linked to 535 putative biosynthetic genes using to the OryzaCyc 4.0, Plant Metabolic Network database. Rice genes responsible for bran composition with animal and human health importance is available for rice breeding programs to utilize in crop improvement.
Keywords: rice bran; rice genes; rice cultivars; metabolic pathway; metabolomics
1. Introduction
Rice, a major global cereal crop, originates from Oryza sativa L. (Asian rice) or Oryza glaberrima Steud (African rice) [1]. Oryza. sativa is the primary source of calories for half of the world’s population [2] and provides phytochemicals, vitamins, minerals, carbohydrates, and fats when consumed as whole grain rice [3]. Rice grows in over 100 countries [4]. As a result of its long history of cultivation and selection under diverse environments, O. sativa comprises over 400,000 varieties and has acquired a broad range of adaptability and tolerance to different water and soil regimens, from flooded lowlands to arid hillside slopes [5,6]. The 2017 global paddy rice production reported by Food and Agriculture
Organization (FAO)
of the United Nations was 756.7 metric million tons with over 502 million metric tons milled and more than 60 million metric tons of rice bran produced [7]. Polished white rice is the major product with rice milling yields of 65-70% and the by-products comprised of 20% rice husk and 8-12% rice bran [8].
Rice bran has a broad spectrum of health benefits [9-12], partially due to a diverse array of bioactive metabolites [13,14]. Rice bran bioactive components include, but are not limited to γ-oryzanol [15], tocopherols, tocotrienols [16], carotenoids [17], γ-aminobutyric acid [18], octacosanol [19], squalene [20], unsaturated fatty acids [21], phytosterols and phenolic compounds [22]. Dietary consumption of rice bran was shown to be feasible and tolerable to increase key nutrients and fiber intakes in children and adults [11,23-25], and provide health promoting properties in the prevention and control of major chronic diseases, such as diabetes [26], chronic inflammation [27], cardiovascular disease [25,28], as well as cancers of the colon, liver, prostate, and breast [11,24,29,30]. Until recently, rice bran has been largely under-valued and under-utilized for nutritional and medicinal applications [31], and this promising food has not received attention from rice breeders when compared to other traits of agronomic importance (e.g. yield, disease resistance) [32]. Given the bran component of whole grain rice is the fraction with highest nutritive value [33,34], and that extensive genetic variation exists in Oryza sativa germplasm, a continued exploration with regards to the nutritional and health properties of rice bran is merited.
Metabolomics has shown utility to study rice plant biology and compounds that are linked to tolerance to different stressors including abiotic stress [35], mineral toxicity [36], nutrient limitation [37,38], drought stress [39], and pesticide stress [40], suggesting extensive metabolome adaptability in rice. Metabolomics has also characterized natural and genetic variations in rice via phenotyping of brown rice seeds [41], cooked brown rice [42], mature seeds [43], embryo (a fraction of rice bran) and endosperm (white rice) [44], and leaves [39]. These findings support metabolomic approaches to improve plant function, enhance grain nutritional quality, and increase grain yield [6,45,46]. Metabolite profiling of rice bran from three USA rice cultivars showed appreciable variation of bioactive rice bran components and provided the rationale for larger, global scale investigations [13,47]. Variation in bran composition could substantially contribute to greater interest in whole grain rice for wider consumer acceptance.
There is a gap in knowledge between rice bran bioactive metabolites and their genetic variation among globally diverse rice cultivars. Given that metabolomics is a powerful tool that allows for a broad range of rice bran metabolite detection, the objective of this study was to investigate variation in the rice bran metabolome of 17 cultivars, and to identify gene-metabolite relationships relevant to the nutritional and medicinal quality of rice bran. Rice bran metabolites were hypothesized to exhibit biochemical variation across cultivars and reveal key rice gene-metabolite relationships of utility for rice bran traits with nutrition and health importance in future breeding programs.
2. Results
2.1. Classification of rice bran metabolite profiles and metabolic pathways by non-targeted metabolomics
bran, had 16 metabolites. Cultivars ranged from 0 to11 metabolites in rice bran peptides. It is noteworthy that the number of cofactors & vitamins did not vary greatly across rice bran cultivars (23-27 metabolites) (Table 1 and Supplementary Table S1). Each of the chemical classes were subdivided into 53 metabolic pathways (Supplementary Table S1).
2.2. Global rice bran metabolome variation for 17 cultivars
Across all cultivars, the principal component 1 (PC1) accounted for 20.3% of the total variation in the dataset, and PC2 for 16% of the metabolite variation (Figure 1). These results indicate that there is a ‚core‛ rice bran metabolome and that the difference in the range of individual rice bran metabolites (ca. 60-90) can be seen across the different chemical classes of the metabolome.
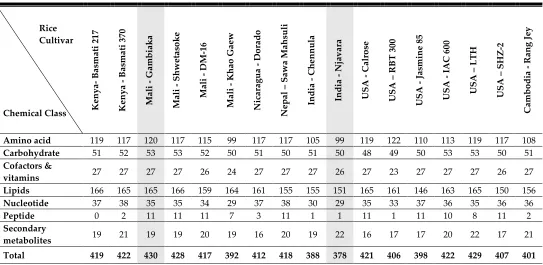
Table 1. Number of rice bran metabolites with confirmed annotation in each cultivar by cultivar and chemical class
Rice Cultivar
Chemical Class K
eny a - B as m at i 21 7 K eny a - B as m ati 37 0 Ma li - G am bia k a Ma li - Sh w et as o k e Ma li - DM -16 Ma li - K ha o G ae w N ic ara g ua D o ra do N ep al – Sa w a Ma hsuli India Ch enn ul a India N ja v ara U SA - Ca lrose U SA – R B T 3 00 U SA - Ja sm ine 8 5 U SA - IA C 6 00 U SA – L TH U SA – SH Z -2 Ca m bo di a - R an g Je y
Amino acid 119 117 120 117 115 99 117 117 105 99 119 122 110 113 119 117 108 Carbohydrate 51 52 53 53 52 50 51 50 51 50 48 49 50 53 53 50 51 Cofactors &
vitamins 27 27 27 27 26 24 27 27 27 26 27 23 27 27 27 26 27
Lipids 166 165 165 166 159 164 161 155 155 151 165 161 146 163 165 150 156 Nucleotide 37 38 35 35 34 29 37 38 30 29 35 33 37 36 35 36 36
Peptide 0 2 11 11 11 7 3 11 1 1 11 1 11 10 8 11 2
Secondary
metabolites 19 21 19 19 20 19 16 20 19 22 16 17 17 20 22 17 21 Total 419 422 430 428 417 392 412 418 388 378 421 406 398 422 429 407 401
Figure 1. Principal Component Analysis (PCA) of rice bran metabolome for 17 rice cultivars. PCA was completed using median-scaled relative abundance of all bran in the 17 rice cultivars. The PC1 showed 20.3% variation, and PC2 showed 16% variation in the metabolite profiles. Colored dots indicate the country where the rice was produced.
2.3. Comparison of rice bran metabolites across 17 cultivars
A Z-score was used to represent the median-scaled relative abundance of each rice bran metabolite across all cultivars, and a threshold Z-score of |2| was applied to identify metabolites that differed appreciably between cultivars. This comparative Z-score analysis led to the identification of 71 rice bran metabolites that were significantly different across cultivars. The cultivar discriminating metabolites are shown in Figure 2 (panel A-D) and complete metabolite characterizations are included in Supplementary Table S2. Thus the 20% variation identified using comparative rice bran metabolomics (PC1) included 21 amino acids, seven carbohydrates, and two cofactors & vitamins, 33 lipids, six nucleotides, and two secondary metabolites.
2.3.1. Cultivar variation in rice bran amino acids
2.3.2. Cultivar variation in rice bran carbohydrates
Seven rice bran carbohydrates showed significant differences across cultivars (Figure 2B). Cultivars with lower abundances is some metabolites included arabonate/xylonate in Khao Gaew, glucosaminate, aconitate, and α-ketoglutarate in Njavara, and malate in IAC 600.Calrose was higher for abundance of malate, while Basmati 217 had highest abundance of erythritol. The remaining cultivars (i.e., Basmati 370, Gambiaka, Shwetasoke, and DM-16, Dorado, Sawa Mahsuli, Chennula, RBT 300, Jasmine 85, LTH, SHZ-2, and Rang Jey) showed no significant Z-score changes across the carbohydrate chemical class.
2.3.3. Cultivar variation in rice bran cofactors & vitamins
There was limited variation for cofactors & vitamins in bran amongst the cultivars, except for the vitamin E components γ-tocopherol/β-tocopherol and γ-tocotrienol, with the lowest relative abundances observed in Sawa Mahsuli rice bran (Figure 2B).
2.3.4. Cultivar variation in rice bran lipids
Lipids represented the largest percentage of the bran metabolome (39%) encompassing 146-166 metabolites across varieties (Table 1). Figure 2C shows the 32 lipid metabolites with significant Z-score below -2 and one lipid was significantly higher in abundance (Z-score above 2) when compared across cultivars. Chennula was the only cultivar that had an increased Z-score for laurate. RBT 300 (20 lipids), Rang Jey (5 lipids), Jasmine 85 (4 lipids), Njavara (2 lipids), and Chennula (2 lipids) were the cultivars with lower metabolite relative abundances. The significant metabolites in RBT 300 included linoleate, linolenate, myristate, myristoleate, palmitate, palmitoleate, diacylglycerol (14:0/18:1, 16:0/16:1), two isomers of linlinolenoyl-glycerol (18:2/18:3), linlinglycerol (18:2/18:2), oleoyl-linoleoyl-glycerol (18:1/18:2), oleoyl-oleoyl-glycerol (18:1/18:1), palmitoleoyl-oleoyl-linoleoyl-glycerol (16:1/18:2), palmitoyl-palmitoyl-glycerol (16:0/16:0), 1-linoleoylglycerol (18:2), 1-oleoylglycerol (18:1), 1-palmitoylglycerol (16:0), 12,13-dihydroxyoctadec-9-enoic acid (12,13-DiHOME), DiHOME, and 9,10-epoxystearate. Rang Jey was lower in bran oleoyl-linoleoyl-glycerol (18:1/18:2), oleoyl-oleoyl-glycerol (18:1/18:1), 1-linoleoyl- glycerophosphoethanolamine (GPE) (18:2), 1-palmitoyl- glycerophosphocholine (GPC) (16:0), and 1-palmitoyl-GPE (16:0). Jasmine 85 showed a lower relative abundance of two isomers of palmitoyl-linoleoyl-glycerol (16:0/18:2), palmitoyl-oleoyl-glycerol (16:0/18:1), and palmitoyl-palmitoyl-glycerol (16:0/16:0). Lower relative abundance lipids in Njavara included glycerophosphopalmitoyl-palmitoyl-glycerol and GPC. Chennula showed low abundance in oleoyl-linoleoyl-glycerol (18:1/18:2) and 2-oleoylglycerol (18:1).
2.3.5. Cultivar variation in rice bran nucleotides
Six nucleotides varied among the cultivars. Figure 2D shows that Rang Jey rice bran had higher abundance of guanine and hypoxanthine, and lower abundance of adenosine when compared to the other rice cultivars. RBT 300 had higher relative abundance in 1-methyladenine and adenosine 5'-monophosphate (AMP). Khao Gaew showed a lower level of adenine amongst the cultivars.
2.3.6. Cultivar variation in rice bran secondary metabolites
peptide (prolylglycine in Chennula and Njavara, and valylglutamine in RBT 300). There were seven cultivars with 11 peptides identified (Gambiaka, Shwetasoke, DM-16, Sawa Mahsuli, Calrose, Jasmine 85, and SHZ-2).
Figure 2. Comparison of discriminating rice bran metabolites across 17 cultivars. Based on the Z-scores obtained from the relative abundance of each metabolite, 71 rice bran components representing 15 metabolic pathways were significantly different among the cultivars and represented. The 21 amino acids (Panel A), 7 carbohydrates and 2 cofactors & vitamins (Panel B), 33 lipids (Panel C), 6 nucleotides and 2 secondary metabolites (Panel D) have Z-scores expressed as standard deviations from the mean and were calculated using the following formula: Z = (x- µ)/σ, ‚x‛ is relative abundance of the metabolite, ‚µ‛ is mean of relative abundance for the metabolite across 17 rice brans, and ‚σ‛ is the relative abundance standard deviation of same metabolite across 17 cultivars. Metabolites above 2 or below -2 in the panel A-D are highlighted for the largest variation and noted by cultivar and the country where the rice was grown. Colored symbols are associated with location where the rice was grown.
2.4. Integrating rice biosynthetic genes with rice bran metabolites
genes, whereby linolenate, an omega-3 polyunsaturated fatty acid (PUFA) was linked to only one gene, but was indirectly associated with 332 genes that are common in biosynthesis of a standard fatty acid. Table 3 lists three carbohydrates and two cofactors & vitamins metabolites with registered biosynthetic genes. There were two genes responsible for malate biosynthesis with an additional 150 genes that are common to biosynthesis of non-specified carbohydrates. Tocochromanols, also known as Vitamin E components (tocopherols and tocotrienols, collectively), have genes in rice that are clearly-defined [48] and γ-tocopherol/β-tocopherol had four genes while γ-tocotrienol had a single known gene. There were four nucleotides and one secondary metabolite with rice genes reported for biosynthesis (Table 4). Salicylate had three identified biosynthetic genes and 152 other possible genes may be involved in the carboxylate biosynthesis.
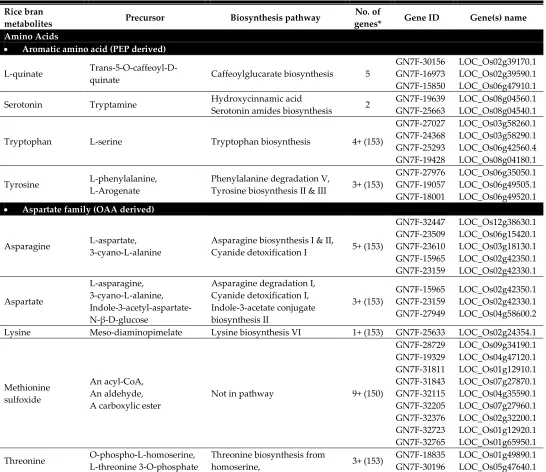
Table 2. Metabolite-rice gene relationship identified from OryzaCyc (Oryza sativa japonica group), Plant Metabolic Network (PMN) database
Rice bran
metabolites Precursor Biosynthesis pathway
No. of
genes* Gene ID Gene(s) name
Amino Acids
Aromatic amino acid (PEP derived)
L-quinate
Trans-5-O-caffeoyl-D-quinate Caffeoylglucarate biosynthesis 5
GN7F-30156 GN7F-16973 GN7F-15850 LOC_Os02g39170.1 LOC_Os02g39590.1 LOC_Os06g47910.1
Serotonin Tryptamine Hydroxycinnamic acid
Serotonin amides biosynthesis 2
GN7F-19639 GN7F-25663
LOC_Os08g04560.1 LOC_Os08g04540.1
Tryptophan L-serine Tryptophan biosynthesis 4+ (153)
GN7F-27027 GN7F-24368 GN7F-25293 GN7F-19428 LOC_Os03g58260.1 LOC_Os03g58290.1 LOC_Os06g42560.4 LOC_Os08g04180.1
Tyrosine L-phenylalanine, L-Arogenate
Phenylalanine degradation V,
Tyrosine biosynthesis II & III 3+ (153)
GN7F-27976 GN7F-19057 GN7F-18001 LOC_Os06g35050.1 LOC_Os06g49505.1 LOC_Os06g49520.1
Aspartate family (OAA derived)
Asparagine L-aspartate, 3-cyano-L-alanine
Asparagine biosynthesis I & II,
Cyanide detoxification I 5+ (153)
GN7F-32447 GN7F-23509 GN7F-23610 GN7F-15965 GN7F-23159 LOC_Os12g38630.1 LOC_Os06g15420.1 LOC_Os03g18130.1 LOC_Os02g42350.1 LOC_Os02g42330.1 Aspartate L-asparagine, 3-cyano-L-alanine, Indole-3-acetyl-aspartate-N-β-D-glucose
Asparagine degradation I, Cyanide detoxification I, Indole-3-acetate conjugate biosynthesis II 3+ (153) GN7F-15965 GN7F-23159 GN7F-27949 LOC_Os02g42350.1 LOC_Os02g42330.1 LOC_Os04g58600.2
Lysine Meso-diaminopimelate Lysine biosynthesis VI 1+ (153) GN7F-25633 LOC_Os02g24354.1
Methionine sulfoxide
An acyl-CoA, An aldehyde, A carboxylic ester
Not in pathway 9+ (150)
GN7F-28729 GN7F-19329 GN7F-31811 GN7F-31843 GN7F-32115 GN7F-32205 GN7F-32376 GN7F-32723 GN7F-32765 LOC_Os09g34190.1 LOC_Os04g47120.1 LOC_Os01g12910.1 LOC_Os07g27870.1 LOC_Os04g35590.1 LOC_Os07g27960.1 LOC_Os02g32200.1 LOC_Os01g12920.1 LOC_Os01g65950.1
Threonine O-phospho-L-homoserine, L-threonine 3-O-phosphate
Threonine biosynthesis from
homoserine, 3+ (153)
GN7F-18835 GN7F-30196
L-threonine 3-O-phosphate GN7F-29436 LOC_Os08g17784.1
Glutamate family (α-ketoglutarate derived)
Arginine L-arginino-succinate Arginine biosynthesis I & II,
Citrulline-nitric oxide cycle 3+ (153)
GN7F-20973 GN7F-32460 GN7F-32707 LOC_Os03g19280.1 LOC_Os03g60976.1 LOC_Os03g60992.1 Glutamate1
More than 35 precursors (top two: L-glutamine, 2-oxoglutarate)
More than 27 pathways (top two: 4-aminobenzoate biosynthesis, 4-aminobutyrate degradation) 91+ (157) GN7F-17849 GN7F-25902 GN7F-28339 GN7F-27233 GN7F-19896 LOC_Os06g48620.1 LOC_Os04g52440.1 LOC_Os08g10510.1 LOC_Os02g02210.1 LOC_Os04g52450.1 Glutamine
More than 8 precursors (top 3: L-glutamate, A dipeptide with proline at the C-terminal, A γ L-glutamyl-L-amino acid)
More than 6 pathways (top 4: Ammonia assimilation cycle I & II, Glutamine biosynthesis I & II) 5+ (153) GN7F-15709 GN7F-15901 GN7F-22516 GN7F-26393 GN7F-27460 LOC_Os03g50490.1 LOC_Os04g56400.1 LOC_Os03g12290.1 LOC_Os10g31820.1 LOC_Os02g50240.1 N-acetylglutamate L-glutamate
Arginine biosynthesis II (acetyl cycle), Ornithine biosynthesis 6+ (150) GN7F-20894 GN7F-19328 GN7F-17187 GN7F-31311 GN7F-32148 GN7F-32821 LOC_Os03g17120.1 LOC_Os07g39690.1 LOC_Os03g31690.1 LOC_Os03g46200.1 LOC_Os03g58010.1 LOC_Os03g58030.1
Pyroglutamine An (γ-L-glutamyl)-L-amino
acid γ-glutamylcyclotransferase 2
GN7F-31386 GN7F-32110
LOC_Os03g63700.1 LOC_Os11g04420.4
Serine family (phosphoglycerate derived)
Glycine L-cysteinyl-glycine, γ-glutamyl cycle,
Phytochelatins biosynthesis 8+ (151)
GN7F-30607 GN7F-16957 GN7F-25454 GN7F-26619 GN7F-28075 GN7F-16002 GN7F-26733 GN7F-19516 LOC_Os01g05810.1 LOC_Os04g38450.1 LOC_Os01g05820.1 LOC_Os05g34290.1 LOC_Os06g01260.1 LOC_Os12g35890.1 LOC_Os09g32290.2 LOC_Os01g21380.1
Taurine2 In Transport Reactions 4
GN7F-31312 GN7F-31505 GN7F-32616 GN7F-32729 LOC_Os09g29660.1 LOC_Os05g31080.1 LOC_Os03g20170.1 LOC_Os09g29670.1 Lipids
Free fatty acid
α-linolenate A phosphatidylcholine No common pathways 1+ (334) GN7F-18386 LOC_Os11g04940.1
Laurate
Lauroyl-CoA,
A dodecanoyl- [acyl-carrier protein]
Palmitate biosynthesis II (bacteria and plants), Sporopollenin precursors biosynthesis
1+ (285) GN7F-19329 LOC_Os04g47120.1
Linoleate Linoleoyl-CoA No common pathways 2+ (332) GN7F-33079 GN7F-16232
LOC_Os02g44654.2 LOC_Os04g47250.1
Myristate Myristoyl-CoA No common pathways 0+ (325) - -
Palmitate
Palmitoyl-CoA, A palmitoyl-[acp], 1,2- dipalmitoyl-phosphatidylcholine, 1- palmitoyl-2-linoleoyl-phosphatidylcholine Cutin biosynthesis, Sporopollenin precursors biosynthesis, Suberin monomers biosynthesis,
Palmitate biosynthesis II
(bacteria and plants), Phospholipid remodeling (phosphatidylcholine, yeast)
Palmitoleate A palmitoleoyl-
[acyl-carrier protein] No common pathways 4+ (333)
GN7F-31362 GN7F-31587 GN7F-31765 GN7F-32681 LOC_Os04g46710.1 LOC_Os04g46730.1 LOC_Os02g44134.1 LOC_Os02g44200.1 Oxylipins 9,10-epoxystearate oleate, A hydroperoxy-fatty-acyl-[lipid] Cutin biosynthesis, Poly-hydroxy fatty acids biosynthesis 10+ (332) GN7F-31064 GN7F-30659 GN7F-18468 GN7F-27809 GN7F-16745 GN7F-21459 GN7F-19209 GN7F-18601 GN7F-29035 GN7F-15971 LOC_Os10g37070.1 LOC_Os08g05620.1 LOC_Os01g24810.1 LOC_Os10g05020.1 LOC_Os04g03890.1 LOC_Os10g37100.1 LOC_Os04g33370.1 LOC_Os02g01890.1 LOC_Os08g05610.1 LOC_Os06g46680.1
Phospholipid Metabolism
Glycerophosphor ylcholin (sn- glycero-3-phosphocholine)
A
1-acyl-sn-glycero-3-phosphocholine No common pathways 7
GN7F-33055 GN7F-29598 GN7F-18763 GN7F-31398 GN7F-32181 GN7F-32498 GN7F-32638 LOC_Os01g07960.3 LOC_Os04g57370.1 LOC_Os04g09540.1 LOC_Os01g42690.1 LOC_Os04g57390.1 LOC_Os05g51050.1 LOC_Os08g42680.1 *Numbers in brackets indicate the number of common genes known to be responsible for synthesis of a standard alpha amino acid and a standard fatty acid.
1Only the top 5 genes (most studied) were included in the table.
2There are no identified genes for taurine biosynthesis in rice. However, genes that are responsible for its transport from environment into the rice plant are identified.
Table 3. Metabolite-rice gene relationships identified from OryzaCyc (Oryza sativa japonica group), Plant Metabolic Network (PMN) database
Rice bran
metabolites Precursor Biosynthesis pathway
No. of
genes* Gene ID Gene(s) name
Carbohydrate
TCA cycle
α-ketoglutarate (2-oxoglutarate)1
L-glutamate, D-threo-isocitrate
9 pathways (top 4: Alanine degradation II,
Glutamate degradation I, Arginine biosynthesis II, Ornithine
biosynthesis) 11+ (160) GN7F-23833 GN7F-16177 GN7F-28651 GN7F-23252 GN7F-26515 LOC_Os03g58040.1 LOC_Os02g43470.1 LOC_Os04g45970.1 LOC_Os05g03830.1 LOC_Os07g27780.1
cis-aconitate Citrate
Glutamine biosynthesis III glyoxylate cycle,
TCA cycle II (plants and fungi)
4+ (150) GN7F-24702 GN7F-28499 GN7F-23691 GN7F-25422 GN7F-25644 LOC_Os10g03960.1 LOC_Os06g19960.1 LOC_Os03g04410.1 LOC_Os08g09200.1
Glyoxylate, Fumarate
degradation II,
Glyoxylate cycle, Superpathway of glyoxylate cycle and fatty acid degradation,
TCA cycle II (plants and fungi)
GN7F-21211 LOC_Os03g21950.1
Cofactors & vitamins
Tocopherol metabolism
β-tocopherol
δ-tocopherol, S-adenosyl-L-methionine
Vitamin E biosynthesis
(tocopherols) 4
GN7F-31982 GN7F-31239 GN7F-31334 GN7F-25500 LOC_Os10g41970.1 LOC_Os03g26200.1 LOC_Os08g02600.1 LOC_Os02g47310.1 γ-tocotrienol 2,3-dimethyl-6- geranylgeranyl-1,4-benzoquinol
Vitamin E biosynthesis
(tocopherols) 1 GN7F-24601 LOC_Os02g17650.1
*Numbers in brackets indicate the number of common genes known to be responsible for synthesis of a standard carbohydrate. 1Only the top 5 genes were included in the table.
Table 4. Metabolite-rice gene relationship identified from OryzaCyc (Oryza sativa japonica group), Plant Metabolic Network (PMN) database
Rice bran
metabolites Precursor Biosynthesis pathway
No. of
genes* Gene ID Gene(s) name
Nucleotides
Purine metabolism
Adenine1 S-methyl-5'-thioadenosine, adenosine, N6-dimethylallyladenine, Trans-zeatin, cis-zeatin, N1-ethyladenine, N1-methyladenine S-methyl-5'-thioadenosine degradation I,
Adenine and adenosine salvage II, Cytokinins degradation 18 GN7F-25353 GN7F-26929 GN7F-32781 GN7F-32797 GN7F-19530 LOC_Os08g44370.1 LOC_Os09g39440.1 LOC_Os05g33644.1 LOC_Os05g33630.1 LOC_Os06g37500.1 Adenosine S-adenosyl-L-homocysteine, Trans-zeatin riboside, Isopentenyl adenosine S-adenosyl-L-methionine cycle II,
L-methionine degradation I (to L-homocysteine), Cytokinins degradation 3+ (8) GN7F-20280 GN7F-19530 GN7F-20388 LOC_Os02g12780.1 LOC_Os06g37500.1 LOC_Os01g09260.1 Adenosine 5'-monophosphate1 Adenosine triphosphate (ATP)
More than 97 pathways (top 4: Trans-zeatin biosynthesis, Adenosine nucleotides degradation I,
4-hydroxybenzoate biosynthesis I (eukaryotes),
arginine biosynthesis I (via L-ornithine) 299+ (24) GN7F-23647 GN7F-23504 GN7F-28551 GN7F-25622 GN7F-25996 LOC_Os02g46970.1 LOC_Os06g44620.1 LOC_Os08g34790.1 LOC_Os08g14760.1 LOC_Os01g24030.1
Hypoxanthine Inosine Adenosine nucleotides
degradation I 5
2.5. Integration of rice bran metabolites, metabolic pathways and rice genes
Figure 3 shows the Pathways Enrichment Score (PES) for 15 metabolic pathways in the cultivars that contained one or more metabolites with significant Z-scores among the 71 discriminating rice bran metabolites. A complete list of all PES is shown in Supplementary Table S3.
2.5.1. Amino acid metabolic pathway enrichment scores and gene associations
Amino acids contained four metabolic pathways with PES distinctions including aromatic amino acid [phosphoenolpyruvate (PEP) derived]p, aspartate family oxaloacetate (OAA) derived, glutamate family (α-ketoglutarate derived), and serine family (phosphoglycerate derived) that involve the 21 amino acids that differed among the cultivars including four aromatic amino acid (PEP derived), seven aspartate family (OAA derived), nine glutamate family (α-ketoglutarate derived), and two serine family (phosphoglycerate derived) and shown in Supplementary Table S2. DM-16 rice bran had low and high abundance of quinate and serotonin, respectively, which have the highest PES for the aromatic amino acid (PEP derived) pathway (PES= 24.8). Chennula rice bran had the highest PES for the aspartate family (OAA derived) pathway (PES= 3.9) and the low relative abundance of three amino acids namely lysine, N6,N6,N6-trimethyllysine, and threonine explained the difference. Gambiaka rice bran had the highest PES for the glutamate family (α-ketoglutarate derived) pathway (PES= 6.9) and high relative abundance of N-methylproline, stachydrine, and trans-4-hydroxyproline explain the difference. Sawa Mahsuli rice bran had the highest PES for the serine family (phosphoglycerate derived) pathway (PES= 6.0) when compared to other cultivars. Differentially-higher abundance of glycine in this cultivar was the contributor to this difference (Figure 3).
2.5.2. Carbohydrate metabolic pathway enrichment scores and gene associations
The carbohydrate chemical class contained two metabolic pathways with significant PES and included amino sugar and nucleotide sugar, and the citric acid cycle (TCA cycle). Seven discriminating metabolites explained these changes including four amino sugar and nucleotide sugar, and three TCA cycle. Rice genes involved in biosynthesis of metabolites under the TCA cycle metabolic pathways are shown in Table 3. There were no genes identified for metabolites under the amino sugar and nucleotide sugar metabolic pathway. Khao Gaew rice bran had the highest PES for the amino sugar and nucleotide sugar pathway (PES=20.3) and this was due to the low relative abundance of arabonate/xylonate and ribonate. Njavara rice bran had the highest PES for the TCA cycle across all cultivars (PES= 9.9) due to glucosamine, aconitate and α-ketoglutarate having the lowest abundance among the cultivars (Figure 3).
2.5.3. Cofactors & vitamins metabolic pathway enrichment scores and gene associations
Cofactors & vitamins were associated with the tocopherol metabolic pathway, whereby the Sawa Mahsuli rice bran had the highest score (PES= 9.6) due to lower relative abundance γ-tocopherol/β-tocopherol and γ-tocotrienol as compared to other cultivars (Figure 3). Rice genes involved in biosynthesis of metabolites under the tocopherol metabolic pathway are shown in Table 3.
2.5.4. Lipids metabolic pathway enrichment scores and gene associations
Benzenoids
Salicylate Methylsalicylate Unknown 3 + (152)
GN7F-26541 GN7F-21475 GN7F-28107
The 33 lipid metabolites that explained these changes in PESs included seven free fatty acids, 14 glycerolipids (diacyl), four glycerolipids (monoacyl), three lyso-phospholipids, three oxylipins, and two phospholipids. Rice genes involved in biosynthesis of metabolites under free fatty acid, oxylipins, and phospholipid pathways are shown in Table 2. There were no genes identified for metabolites under monoacyl and diacyl glycerolipids, and lyso-phospholipids metabolic pathway. RBT 300 had the lowest relative abundance for the majority of lipids (20 lipids) which explain the highest PES for the free fatty acid pathway (PES= 3.1), glycerolipids (diacyl) pathway (PES= 12.8), glycerolipids (monoacyl) pathway (PES=5.7), and oxylipins pathway (PES= 6.5). Rang Jey rice bran had the highest PES for the lyso-phospholipids pathway (PES= 3.6) and the low abundances of 1-linoleoyl- glycerophosphoethanolamine (GPE) (18:2), 1-palmitoyl-GPC (16:0), and 1-palmitoyl-GPE (16:0) explain this significance. Njavara rice bran was another cultivar with highest PES for phospholipid metabolism (PES= 4.6) and low abundance of glycerophosphoglycerol and GPC explain this significance (Figure 3).
2.5.5. Nucleotide metabolic pathway enrichment score s and gene associations
Within the nucleotides a PES of 2.7 was identified for purine metabolism, with Rang Jey rice bran having the highest score. This PES was a result of the lower relative abundance of adenosine in this cultivar compared to others (Figure 3). Rice genes involved in biosynthesis of metabolites under the purine metabolic pathway are shown in Table 4.
2.5.6. Secondary metabolite pathway enrichment scores and gene associations
Figure 3. Cultivars with significant Pathway Enrichment Score (PES) of 15 metabolic pathways. Metabolic pathways with enrichment scores greater or less than 1 are shown in this figure and indicate that the pathway for the cultivar contained 1 or more metabolites with a statistically-significant Z-score.
3. Discussion
low-middle-income countries where malnutrition remains a major problem [50,51]. Evaluating the nutritional and health benefits of rice bran is enhanced by using a global metabolomics approach. The 71 discriminating rice bran metabolites that varied among these 17 cultivars that were collected from diverse field environments should be considered in breeding due to the presence of nutritionally- and medicinally-valuable bran metabolites.
A few examples of amino acids with health benefits that were identified herein are quinate and serotonin from the aromatic amino acid metabolic pathway (PEP derived) that have shown to be anti-inflammatory [52] and antiemetic [53], respectively. This metabolome analysis showed that the abundance of quinate and serotonin were significantly lower and higher, respectively in DM-16 (produced in Mali, West Africa) when compared to other rice brans. The increased relative abundance of glycine and pipecolate was also observed in Sawa Mahsuli (produced in Nepal). Glycine was shown to have diarrheal [54], inflammatory [55], antioxidant [56], cancer chemoprevention [57], and anti-obesity properties [58]. Pipecolate was shown to have cancer chemoprevention properties as this phytochemical serves as a precursor to gut microbial secondary metabolites production such as such as rapamycin, swainsonine, virginiamycin, and marcfortine that exhibit anti-inflammatory, antitumor, and antibiotic properties [59].
Carbohydrates, vitamins and lipids of interest to improve animal and human health, differed in abundance across cultivars. Malate, a carbohydrate from the TCA cycle was detected and had higher relative abundance in Calrose (USA grown) when compared to other cultivars. In the human body, malate has importance to energy metabolism during both aerobic and anaerobic conditions [60,61], and it was shown that a deficiency of malate may be a major cause of physical exhaustion [61]. Malate has also been reported to have natural antimicrobial activity against Salmonella typhimurium and other microbial pathogens [62]. Given that rice bran, and in particular the Calrose cultivar, is a good source of malate, it could be used to replenish the endogenous malate in the body, and warrants further attention for nutritional and breeding programs.
The Sawa Mahsuli cultivar from Nepal showed lower relative abundance of tocopherol and γ-tocotrienol when compared to other cultivars and should be considered as a genetic resource for crop improvement because total vitamin E contents found in rice bran are associated with health benefits [63]. γ-tocopherol, the primary form of vitamin E in food in the USA [64], and γ-tocotrienol, a safe and well-tolerated form of vitamin E [65], have demonstrated a broad range of disease fighting activities including but not limited to anti-inflammatory [66] and anti-hypertension actions [67].
selectively elevated through γ-linoleic acid supplementation [73]. Future studies should consider using rice bran lipids from bran or whole grain rice as they may demonstrate beneficial effects when compared to consuming these lipids as isolated supplements.
Other metabolites from this study that varied by cultivar and should be considered for importance to human health were 4-hydroxybenzoate and salicylate. The 4-hydroxybenzoate had a higher relative abundance in Rang Jay (grown in Cambodia), and this compound has established antimicrobial properties [62,74] as well as antioxidant [75] actions. Salicylate, a phytochemical with a broad function in plant growth and development [76], is also an active component of aspirin and has well-documented anti-diabetic, anti-inflammatory, and cardio-protective properties [77,78]. It has potential to be improved through selective breeding programs in Khao Gaew (from Mali) as salicylate had the lowest abundance in this cultivar.
The rice bran phytochemical diversity observed among 17 cultivars produced in geographically diverse field environments included bran molecules that were present at very low levels and which have been typically overlooked in targeted studies. For example, taurine was only recently shown to exist in rice bran [13] and this study verifies its lower abundance across cultivars and regions. Taurine is a known antioxidant and anti-inflammatory agent, as well as a powerful scavenger of hypochlorous acid [79,80]. These effects of taurine may be also related to prevention of obesity by increasing energy metabolism in white adipose tissue [81]. In other studies, taurine was found to have antiepileptic actions [82] and to be neuroprotective against glutamate excitotoxicity [83].
Understanding the genes involved in biosynthesis of bran specific metabolites that are distinct from the rest of the grain is essential to improve nutritional and medicinal value of the bran and whole grain (brown) rice. Increasing our understanding of the rice genes involved in the biosynthetic pathways of bran composition, such as lipid biosynthetic pathways, are noteworthy as these genes were largely missing from the integrated database (Table 3). Enhancing rice bran amino acid and lipid contents, as well as many other phytochemicals, such as recently shown for tricin [84], may be beneficial to co-develop with high-yielding rice cultivars. Genome-wide association study (GWAS) using cultivar diversity panels [85,86] and Quantitative Trait Locus (QTL) mapping in structured bi-parental populations [6,87,88], when coupled with rice bran metabolomics, offer a novel means of gene discovery and crop improvement. This emerging field of phytochemical genomics, integrating genomic, proteomic and metabolomic approaches, has been used in crop improvement for barley [89], corn [90,91], potato [92], and tomato [93,94]. We put forth that the study and identification of rice genes underlying the nutritional and medicinal traits in rice bran deserve investigation to realize the tremendous potential impact of rice bran in global nutritional security.
4. Materials and methods
4.1. Rice cultivars and heat stabilization of bran
Rice bran was isolated from 17 rice cultivars that originated from 11 countries and were grown in seven countries including Cambodia, India, Kenya, Mali, Nepal, Nicaragua, and the United States, all having emerging interests in producing functional foods [9,10,23]. The phenotypes of all cultivars are described in Table 5. Immediately after the milling process, raw rice bran was heat-stabilized (110°C for 6 min) to prevent rancidity and then stored at -20oC until further processing for metabolomics.
Table 5. Classification and phenotypes of the seventeen rice cultivars used for bran metabolomics
Cultivar Grain type Bran color Country of Origin Growing Location
Basmati 217 Long Brown India Kenya
Basmati 370 Long Brown India Kenya
Calrose Medium Brown USA California
Chennula Long Brown India India
DM-16 Short Brown South America Mali
Dorado Long Brown Colombia Nicaragua
Gambiaka Long Brown Mali Mali
IAC 600 Medium Purple Brazil Arkansas
Jasmine 85 Long Brown Philippines Arkansas
Khao Gaew Long Brown Thailand Mali
Li-Jiang-Xin-Tuan-Hei-Gu (LTH) Medium Red China Arkansas
Njavara Long Red India India
Rang Jey Medium Brown Cambodia Cambodia
RBT 300* Medium Brown USA California
Sawa Mahsuli Long Brown Nepal Nepal
Shan-Huang-Zhan-2
(SHZ-2) Long Brown China Arkansas
Shwetasoke Long Brown Mali Mali
* This rice bran is a commercial ingredient from a mixture of varieties grown in California.
4.2. Rice bran metabolite extraction and sample preparation
Metabolon Inc. (Durham, NC) performed the global, non-targeted metabolomics. Rice bran samples were extracted as previously described [13]. Briefly, samples were extracted with 80% methanol. Samples then underwent vigorous shake for 2 min (Glen Mills GenoGrinder 2000) and followed by centrifugation to precipitate protein and separate the small molecules from macromolecules. The attained supernatant extract (i.e., rice bran extract) was divided into several fractions for different modes of analysis by ultrahigh performance liquid chromatography-tandem mass spectroscopy (UPLC-MS/MS) including reverse phase chromatography with positive/negative ion mode electrospray ionization for non-polar compounds, and hydrophilic-interaction chromatography (HILIC) UPLC-MS/MS for the analysis of polar compounds. Prior to injection, samples were placed on TurboVap® (Zymark) evaporator to make sure
4.3. UPLC-MS/MS analysis
The non-targeted metabolomics analysis was based on previously-described methods [13]. Briefly, a Waters ACQUITY UPLC coupled with a Thermo Scientific Q-Exactive high resolution/accurate mass spectrometer interfaced with a heated electrospray ionization (HESI-II) source and Orbitrap mass analyzer was utilized. The dried rice bran extract was reconstituted in UPLC-compatible solvents (acidic or basic solvents) for each mode of analysis. For the acidic solution, the rice bran extract was once analyzed for hydrophilic compounds and once for hydrophobic compounds. For hydrophilic compounds, the extract was eluted from a C18 column (Waters UPLC BEH C18-2.1x100 mm, 1.7 µm) using water and methanol, containing 0.05% perfluoropentanoic acid and 0.1% formic acid in gradient manner. For hydrophobic compounds, the extract was gradient eluted from the same mentioned C18 column and solvent, with added acetonitrile.
Similar to the acidic mode, in the basic solution, rice bran extract was once analyzed for hydrophilic compounds and once for hydrophobic compounds using a similar C18. For more hydrophobic and positive ion compound extraction, water, methanol and 6.5mM ammonium bicarbonate at pH 8.0 was used to elute the rice bran extracts from the C18 column. For more hydrophilic and more negative ion compounds, the extract was analyzed and eluted through interaction liquid chromatography (HILIC) column (Waters UPLC BEH Amide 2.1x150 mm, 1.7 µm) using a gradient consisting of water and acetonitrile and 10 mM ammonium formate, at pH 10.8. Using dynamic exclusion, the mass spectrometry analysis was interchanged between MS and data-dependent MS2 scans with the scan range of 70-1000
m/z.
4.4. Metabolite data extraction and compound identification
Biochemical identifications from UPLC-MS was completed using the Metabolon database and were based on three criteria: retention index, accurate mass match to the National Institute of Standards and Technology library within +/- 0.005 atomic mass units, and the tandem mass spectrometry (MS/MS) scores between the generated data from the experiment and standards [13]. Each rice bran metabolite was then cross checked for an associated number in the Kyoto Encyclopedia of Genes and Genomes (KEGG), Human Metabolome Database (HMDB), and PubChem databases.
4.5. Metabolic pathway analysis
Across all 17 rice bran varieties, the metabolome analysis comprised 53 metabolic pathways, and each metabolite was assigned to one pathway. Using the following equation, pathway enrichment score (PES) was calculated, where ‚k‛ correspond to the number of metabolites with a Z-score of +/- 2 or larger in a metabolic pathway, ‚m‛ correspond to the total number of metabolites identified in that pathway, ‚n‛ correspond to the total number of significant metabolites in the dataset, and ‚N‛ correspond to the total number of identified metabolites in the entire dataset:
Metabolic pathways that had PES less or greater than one indicated that the pathway contained one or more differentially-expressed metabolites compared to all other pathways.
4.6. Rice biosynthetic gene identification for selected rice bran metabolites
The Oryza sativa (japonica group-based) OryzaCyc 4.0, Plant Metabolic Network (PMN) database was
when comparing the 17 cultivars in the metabolomics dataset. The rice gene and bran metabolite linkages can be verified at (http://plantcyc.org/databases/oryzacyc/4.0). It is notable that a limitation arises from the fact that rice genome database is limited to japonica population and may differ for indica sub-population [96].
4.7. Statistical analysis
Median-scaled relative abundance and Z-score for each of the metabolites and across all cultivars were calculated as previously described [13]. Z-score calculation was based on the median-scaled relative abundances and reported as standard deviations from the mean and was calculated using the following formula:
Z =
where relative abundance of the metabolite is expressed as ‚x‛, mean of relative abundance for the metabolite across 17 rice brans is expressed as ‚µ‛, and the relative abundance standard deviation of same metabolite across 17 cultivars is expressed as ‚σ‛. A notable Z-score for a metabolite shows that the relative abundance of that metabolite in a specific cultivar is lower or higher than the standard deviations from the mean of other cultivars. For each variety, metabolites with a Zscore greater than 2 or less than -2 (Z-score > |2.0|) were considered to be distinguishers of that variety. Furthermore, a principal component analysis (PCA) was completed using SIMCA (Sartorius Stedim Biotech) to assess the overall variability in the global metabolite profile of bran from 17 rice cultivars using median-scaled relative abundance values. However, the country in which the rice cultivar originated from or was grown in was not a variable in the PCA as a means to focus differences in rice varieties that are available to consumers in various countries.
Supplementary Materials: The following are available online at www.mdpi.com/xxx/s1, Supplementary Table 1: List of all the identified metabolites in bran of 17 rice cultivars with their relative abundances, Supplementary Table 2: Z-scores and relative abundances of 71 significant metabolites, Supplementary Table 3: Metabolic pathway enrichment scores (PES) for discriminating metabolites between rice bran varieties.
Author Contributions: EPR and IZ designed and conducted the research; IZ conducted the metabolome analysis and wrote the manuscript. EL and IZ investigated the gene-metabolite relationship. JEL, AM, SV, and OK among others acknowledged below assisted in the rice bran collection from the field and classification from diverse countries. All authors read and approved the final manuscript.
Funding: This work was supported by a Grand Explorations in Global Health grant (OPP1015267) from the Bill and Melinda Gates Foundation, grant from the National Institute of Food and Agriculture (NIFA) (004228-00002), and an international doctoral training fellowship in Agroecosystem Health from Colorado State University.
Acknowledgments: We thank Dr. George Thomas, Dr. John N. Kinyuru, Dr. Job Mapesa, and Tavia Mirassou-Wolf, for their contribution to collect rice bran from India, Kenya, and Cambodia and to all the students and our international collaborators for their assistance in collection of rice bran for the global varieties from multiple countries. We would like to thank Nora Jean Nealon and Katherine Li for internal editorial review. The authors declare that they have no competing interests.
References
1. Sarla, N.; Swamy, B.P.M. Oryza glaberrima: A source for the improvement of Oryza sativa.
Current Science 2005, 89, 955-963.
2. Khush, G.S. What it will take to Feed 5.0 Billion Rice consumers in 2030. Plant Molecular Biology 2005, 59, 1-6, doi:10.1007/s11103-005-2159-5.
3. Gani, A.; Wani, S.; Masoodi, F.; Hameed, G. Whole-grain cereal bioactive compounds and their health benefits: a review. J Food Process Technol 2012, 3, 146-156.
4. Cosslett, T.L.; Cosslett, P.D. Introduction. In Sustainable Development of Rice and Water Resources in Mainland Southeast Asia and Mekong River Basin, Springer Singapore: Singapore, 2018; 10.1007/978-981-10-5613-0_1pp. 1-4.
5. Sánchez, B.; Rasmussen, A.; Porter, J.R. Temperatures and the growth and development of maize and rice: a review. Global change biology 2014, 20, 408-417.
6. Kusano, M.; Yang, Z.; Okazaki, Y.; Nakabayashi, R.; Fukushima, A.; Saito, K. Using metabolomic approaches to explore chemical diversity in rice. Molecular plant 2015, 8, 58-67, doi:10.1016/j.molp.2014.11.010.
7. Food and Agricultur Organization of the United Nation, R.M.M.F.-R. FAO Rice Market Monitor (RMM). 2017.
8. Van Hoed, V.; Depaemelaere, G.; Ayala, J.V.; Santiwattana, P.; Verhe, R.; De Greyt, W. Influence of chemical refining on the major and minor components of rice brain oil. Journal of the American
Oil Chemists' Society 2006, 83, 315-321, doi:10.1007/s11746-006-1206-y.
9. Henderson, A.J.; Ollila, C.A.; Kumar, A.; Borresen, E.C.; Raina, K.; Agarwal, R.; Ryan, E.P. Chemopreventive properties of dietary rice bran: current status and future prospects. Advances in
nutrition (Bethesda, Md.) 2012, 3, 643-653, doi:10.3945/an.112.002303.
10. Borresen, E.C.; Ryan, E.P. Rice bran: a food ingredient with global public health opportunities.
Wheat Rice Dis Prev Health 2014, 301-310.
11. Borresen, E.C.; Brown, D.G.; Harbison, G.; Taylor, L.; Fairbanks, A.; O'Malia, J.; Bazan, M.; Rao, S.; Bailey, S.M.; Wdowik, M., et al. A Randomized Controlled Trial to Increase Navy Bean or Rice Bran Consumption in Colorectal Cancer Survivors. Nutrition and cancer 2016, 68, 1269-1280, doi:10.1080/01635581.2016.1224370.
12. Alauddina, A.; Islam, J.; Shirakawaa, H.; Koseki, T.; Ardiansyah, A.; Komai, M. Rice Bran as a Functional Food: An Overview of the Conversion of Rice Bran into a Superfood/Functional Food (Chapter 14). InTechOpen: 2017.
13. Zarei, I.; Brown, D.G.; Nealon, N.J.; Ryan, E.P. Rice Bran Metabolome Contains Amino Acids, Vitamins & Cofactors, and Phytochemicals with Medicinal and Nutritional Properties. Rice 2017, 10, 24, doi:10.1186/s12284-017-0157-2.
14. Brown, D.G.; Borresen, E.C.; Brown, R.J.; Ryan, E.P. Heat-stabilised rice bran consumption by colorectal cancer survivors modulates stool metabolite profiles and metabolic networks: a randomised controlled trial. The British journal of nutrition 2017, 117, 1244-1256, doi:10.1017/s0007114517001106.
15. Xu, Z.; Godber, J.S. Purification and Identification of Components of γ-Oryzanol in Rice Bran Oil.
Journal of Agricultural and Food Chemistry 1999, 47, 2724-2728, doi:10.1021/jf981175j.
16. Xu, Z.; Hua, N.; Godber, J.S. Antioxidant Activity of Tocopherols, Tocotrienols, and γ-Oryzanol Components from Rice Bran against Cholesterol Oxidation Accelerated by 2,2‘-Azobis(2-methylpropionamidine) Dihydrochloride. Journal of Agricultural and Food Chemistry 2001, 49, 2077-2081, doi:10.1021/jf0012852.
coupled to diode array and mass spectrometric detection employing silica C30 stationary phases.
Journal of separation science 2005, 28, 1712-1718.
18. Parrado, J.; Miramontes, E.; Jover, M.; Gutierrez, J.F.; Collantes de Terán, L.; Bautista, J. Preparation of a rice bran enzymatic extract with potential use as functional food. Food Chemistry 2006, 98, 742-748, doi:http://doi.org/10.1016/j.foodchem.2005.07.016.
19. Chen, F.; Wang, Z.; Zhao, G.; Liao, X.; Cai, T.; Guo, L.; Hu, X. Purification process of octacosanol extracts from rice bran wax by molecular distillation. Journal of Food Engineering 2007, 79, 63-68, doi:http://doi.org/10.1016/j.jfoodeng.2006.01.030.
20. Sugihara, N.; Kanda, A.; Nakano, T.; Nakamura, T.; Igusa, H.; Hara, S. Novel Fractionation Method for Squalene and Phytosterols Contained in the Deodorization Distillate of Rice Bran Oil.
Journal of Oleo Science 2010, 59, 65-70, doi:10.5650/jos.59.65.
21. de Deckere, E.A.; Korver, O. Minor constituents of rice bran oil as functional foods. Nutrition
reviews 1996, 54, S120-126.
22. Liu, L.; Wen, W.; Zhang, R.; Wei, Z.; Deng, Y.; Xiao, J.; Zhang, M. Complex enzyme hydrolysis releases antioxidative phenolics from rice bran. Food Chemistry 2017, 214, 1-8, doi:http://doi.org/10.1016/j.foodchem.2016.07.038.
23. Kinyuru, J.N.; Borresen, E.C.; Ryan, E.P. Nutritional and Safety Evaluation of Heat-Stabilized Rice Bran for Sup-plementary Feeding of Malnourished Children in Kenya. Int J Food Sci Nutr
Diet 2015, 4, 226-232.
24. Sheflin, A.M.; Borresen, E.C.; Kirkwood, J.S.; Boot, C.M.; Whitney, A.K.; Lu, S.; Brown, R.J.; Broeckling, C.D.; Ryan, E.P.; Weir, T.L. Dietary supplementation with rice bran or navy bean alters gut bacterial metabolism in colorectal cancer survivors. Molecular nutrition & food research 2017, 61, doi:10.1002/mnfr.201500905.
25. Borresen, E.C.; Jenkins-Puccetti, N.; Schmitz, K.; Brown, D.G.; Pollack, A.; Fairbanks, A.; Wdowik, M.; Rao, S.; Nelson, T.L.; Luckasen, G., et al. A Pilot Randomized Controlled Clinical Trial to Assess Tolerance and Efficacy of Navy Bean and Rice Bran Supplementation for Lowering Cholesterol in Children. Global Pediatric Health 2017, 4, 2333794X17694231, doi:10.1177/2333794X17694231.
26. Lai, M.-H.; Chen, Y.-T.; Chen, Y.-Y.; Chang, J.-H.; Cheng, H.-H. Effects of rice bran oil on the blood lipids profiles and insulin resistance in type 2 diabetes patients. Journal of Clinical
Biochemistry and Nutrition 2012, 51, 15-18, doi:10.3164/jcbn.11-87.
27. Choi, S.P.; Kim, S.P.; Kang, M.Y.; Nam, S.H.; Friedman, M. Protective Effects of Black Rice Bran against Chemically-Induced Inflammation of Mouse Skin. Journal of Agricultural and Food
Chemistry 2010, 58, 10007-10015, doi:10.1021/jf102224b.
28. Qureshi, A.A.; Bradlow, B.A.; Salser, W.A.; Brace, L.D. Novel tocotrienols of rice bran modulate cardiovascular disease risk parameters of hypercholesterolemic humans. The Journal of nutritional
biochemistry 1997, 8, 290-298, doi:http://dx.doi.org/10.1016/S0955-2863(97)89667-2.
29. Verschoyle, R.D.; Greaves, P.; Cai, H.; Edwards, R.E.; Steward, W.P.; Gescher, A.J. Evaluation of the cancer chemopreventive efficacy of rice bran in genetic mouse models of breast, prostate and intestinal carcinogenesis. British Journal of Cancer 2007, 96, 248-254, doi:10.1038/sj.bjc.6603539. 30. Badr El-Din, N.K.; Ali, D.A.; Othman, R.; Ghoneum, M. Abstract 5259: Prevention of
hepatocarcinogenesis in rats by arabinoxylan rice bran, MGN-3/Biobran. Cancer Research 2016, 76, 5259.
31. Yang, Z.; Nakabayashi, R.; Mori, T.; Takamatsu, S.; Kitanaka, S.; Saito, K. Metabolome Analysis of Oryza sativa (Rice) Using Liquid Chromatography-Mass Spectrometry for Characterizing Organ Specificity of Flavonoids with Anti-inflammatory and Anti-oxidant Activity. Chemical &
32. Mahender, A.; Anandan, A.; Pradhan, S.K.; Pandit, E. Rice grain nutritional traits and their enhancement using relevant genes and QTLs through advanced approaches. SpringerPlus 2016, 5, 2086, doi:10.1186/s40064-016-3744-6.
33. Park, H.Y.; Lee, K.W.; Choi, H.D. Rice bran constituents: immunomodulatory and therapeutic activities. Food & function 2017, 8, 935-943, doi:10.1039/c6fo01763k.
34. Ryan, E.P. Bioactive food components and health properties of rice bran. Journal of the American
Veterinary Medical Association 2011, 238, 593-600, doi:10.2460/javma.238.5.593.
35. Maruyama, K.; Urano, K.; Yoshiwara, K.; Morishita, Y.; Sakurai, N.; Suzuki, H.; Kojima, M.; Sakakibara, H.; Shibata, D.; Saito, K., et al. Integrated Analysis of the Effects of Cold and Dehydration on Rice Metabolites, Phytohormones, and Gene Transcripts. Plant Physiology 2014, 164, 1759.
36. Navarro-Reig, M.; Jaumot, J.; Pina, B.; Moyano, E.; Galceran, M.T.; Tauler, R. Metabolomic analysis of the effects of cadmium and copper treatment in Oryza sativa L. using untargeted liquid chromatography coupled to high resolution mass spectrometry and all-ion fragmentation.
Metallomics : integrated biometal science 2017, 9, 660-675, doi:10.1039/c6mt00279j.
37. Masumoto, C.; Miyazawa, S.-I.; Ohkawa, H.; Fukuda, T.; Taniguchi, Y.; Murayama, S.; Kusano, M.; Saito, K.; Fukayama, H.; Miyao, M. Phosphoenolpyruvate carboxylase intrinsically located in the chloroplast of rice plays a crucial role in ammonium assimilation. Proceedings of the National
Academy of Sciences 2010, 107, 5226-5231, doi:10.1073/pnas.0913127107.
38. Okazaki, Y.; Otsuki, H.; Narisawa, T.; Kobayashi, M.; Sawai, S.; Kamide, Y.; Kusano, M.; Aoki, T.; Hirai, M.Y.; Saito, K. A new class of plant lipid is essential for protection against phosphorus depletion. Nature communications 2013, 4, 1510.
39. Chen, W.; Gong, L.; Guo, Z.; Wang, W.; Zhang, H.; Liu, X.; Yu, S.; Xiong, L.; Luo, J. A Novel Integrated Method for Large-Scale Detection, Identification, and Quantification of Widely Targeted Metabolites: Application in the Study of Rice Metabolomics. Molecular plant 2013, 6, 1769-1780, doi:https://doi.org/10.1093/mp/sst080.
40. Mahdavi, V.; Farimani, M.M.; Fathi, F.; Ghassempour, A. A targeted metabolomics approach toward understanding metabolic variations in rice under pesticide stress. Analytical biochemistry 2015, 478, 65-72, doi:10.1016/j.ab.2015.02.021.
41. Kusano, M.; Fukushima, A.; Kobayashi, M.; Hayashi, N.; Jonsson, P.; Moritz, T.; Ebana, K.; Saito, K. Application of a metabolomic method combining one-dimensional and two-dimensional gas chromatography-time-of-flight/mass spectrometry to metabolic phenotyping of natural variants
in rice. Journal of Chromatography B 2007, 855, 71-79,
doi:https://doi.org/10.1016/j.jchromb.2007.05.002.
42. Heuberger, A.L.; Lewis, M.R.; Chen, M.-H.; Brick, M.A.; Leach, J.E.; Ryan, E.P. Metabolomic and functional genomic analyses reveal varietal differences in bioactive compounds of cooked rice.
PloS one 2010, 5, e12915.
43. Hu, C.; Shi, J.; Quan, S.; Cui, B.; Kleessen, S.; Nikoloski, Z.; Tohge, T.; Alexander, D.; Guo, L.; Lin, H., et al. Metabolic variation between japonica and indica rice cultivars as revealed by non-targeted metabolomics. 2014, 4, 5067, doi:10.1038/srep05067
https://www.nature.com/articles/srep05067#supplementary-information.
44. Galland, M.; He, D.; Lounifi, I.; Arc, E.; Clement, G.; Balzergue, S.; Huguet, S.; Cueff, G.; Godin, B.; Collet, B., et al. An Integrated "Multi-Omics" Comparison of Embryo and Endosperm Tissue-Specific Features and Their Impact on Rice Seed Quality. Frontiers in plant science 2017, 8, 1984, doi:10.3389/fpls.2017.01984.
46. Daygon, V.D.; Calingacion, M.; Forster, L.C.; Voss, J.J.; Schwartz, B.D.; Ovenden, B.; Alonso, D.E.; McCouch, S.R.; Garson, M.J.; Fitzgerald, M.A. Metabolomics and genomics combine to unravel the pathway for the presence of fragrance in rice. Scientific reports 2017, 7, 8767, doi:10.1038/s41598-017-07693-9.
47. Ryan, E.P.; Heuberger, A.L.; Weir, T.L.; Barnett, B.; Broeckling, C.D.; Prenni, J.E. Rice bran fermented with saccharomyces boulardii generates novel metabolite profiles with bioactivity. J
Agric Food Chem 2011, 59, 1862-1870, doi:10.1021/jf1038103.
48. Chaudhary, N.; Khurana, P. Vitamin E biosynthesis genes in rice: Molecular characterization, expression profiling and comparative phylogenetic analysis. Plant Science 2009, 177, 479-491, doi:https://doi.org/10.1016/j.plantsci.2009.07.014.
49. Katherine J. Li, E.C.B., NaNet Jenkins-Puccetti, Gary Luckasen, Elizabeth P. Ryan. Navy Bean and Rice Bran Intake Alters the Plasma Metabolome of Children at Risk for Cardiovascular Disease.
Frontiers in Nutrition 2018, doi: 10.3389/fnut.2017.00071, doi:doi: 10.3389/fnut.2017.00071.
50. Trehan, I.; Manary, M.J. Management of severe acute malnutrition in low-income and middle-income countries. Archives of disease in childhood 2015, 100, 283-287, doi:10.1136/archdischild-2014-306026.
51. Rutishauser-Perera, A. Tackling the double burden of malnutrition in low and middle-income countries: response of the international community.
52. Yates, C.R.; Miller, D.D.; Zeng, K.; Thompson, K.E. Anti-inflammatory quinic acid derivatives for oral administration. Google Patents: 2012.
53. De-Miguel, F.F.; Trueta, C. Synaptic and extrasynaptic secretion of serotonin. Cellular and
molecular neurobiology 2005, 25, 297-312.
54. Naylor, J.M.; Leibel, T.; Middleton, D.M. Effect of glutamine or glycine containing oral electrolyte solutions on mucosal morphology, clinical and biochemical findings, in calves with viral induced diarrhea. Canadian Journal of Veterinary Research 1997, 61, 43-48.
55. Lu, T.-C.; Ko, Y.-Z.; Huang, H.-W.; Hung, Y.-C.; Lin, Y.-C.; Peng, W.-H. Analgesic and anti-inflammatory activities of aqueous extract from Glycine tomentella root in mice. Journal of
Ethnopharmacology 2007, 113, 142-148, doi:https://doi.org/10.1016/j.jep.2007.05.024.
56. Ligumsky, M.; Sestieri, M.; Okon, E.; Ginsburg, I. Antioxidants Inhibit Ethanol-Induced Gastric Injury in the Rat: Role of Manganese, Glycine, and Carotene. Scandinavian Journal of
Gastroenterology 1995, 30, 854-860, doi:10.3109/00365529509101591.
57. Jain, M.; Nilsson, R.; Sharma, S.; Madhusudhan, N.; Kitami, T.; Souza, A.L.; Kafri, R.; Kirschner, M.W.; Clish, C.B.; Mootha, V.K. Metabolite profiling identifies a key role for glycine in rapid cancer cell proliferation. Science 2012, 336, 1040-1044.
58. Tastesen, H.S.; Keenan, A.H.; Madsen, L.; Kristiansen, K.; Liaset, B. Scallop protein with endogenous high taurine and glycine content prevents high-fat, high-sucrose-induced obesity and improves plasma lipid profile in male C57BL/6J mice. Amino Acids 2014, 46, 1659-1671, doi:10.1007/s00726-014-1715-1.
59. He, M. Pipecolic acid in microbes: biosynthetic routes and enzymes. Journal of Industrial
Microbiology and Biotechnology 2006, 33, 401-407.
60. Bendahan, D.; Mattei, J.; Ghattas, B.; Confort-Gouny, S.; Le Guern, M.E.; Cozzone, P. Citrulline/malate promotes aerobic energy production in human exercising muscle. British Journal
of Sports Medicine 2002, 36, 282-289, doi:10.1136/bjsm.36.4.282.
61. Wu, J.; Wu, Q.; Huang, J.; Chen, R. Effects of L-malate on physical stamina and activities of enzymes related to the malate-aspartate shuttle in liver of mice. Physiological research 2007, 56, 213. 62. Nealon, N.J.; Worcester, C.R.; Ryan, E.P. Lactobacillus paracasei metabolism of rice bran reveals metabolome associated with Salmonella Typhimurium growth reduction. Journal of applied
63. Forster, G.M.; Raina, K.; Kumar, A.; Kumar, S.; Agarwal, R.; Chen, M.H.; Bauer, J.E.; McClung, A.M.; Ryan, E.P. Rice varietal differences in bioactive bran components for inhibition of colorectal cancer cell growth. Food Chem 2013, 141, 1545-1552, doi:10.1016/j.foodchem.2013.04.020.
64. Dietrich, M.; Traber, M.G.; Jacques, P.F.; Cross, C.E.; Hu, Y.; Block, G. Does γ-Tocopherol Play a Role in the Primary Prevention of Heart Disease and Cancer? A Review. Journal of the American
College of Nutrition 2006, 25, 292-299, doi:10.1080/07315724.2006.10719538.
65. Meganathan, P.; Fu, J.Y. Biological Properties of Tocotrienols: Evidence in Human Studies.
International journal of molecular sciences 2016, 17, doi:10.3390/ijms17111682.
66. Jiang, Q.; Elson-Schwab, I.; Courtemanche, C.; Ames, B.N. γ-Tocopherol and its major metabolite, in contrast to α-tocopherol, inhibit cyclooxygenase activity in macrophages and epithelial cells.
Proceedings of the National Academy of Sciences 2000, 97, 11494-11499.
67. Chatelain, E.; Boscoboinik, D.O.; Bartoli, G.-M.; Kagan, V.E.; Gey, F.K.; Packer, L.; Azzi, A. Inhibition of smooth muscle cell proliferation and protein kinase C activity by tocopherols and tocotrienols. Biochimica et Biophysica Acta (BBA)-Molecular Cell Research 1993, 1176, 83-89.
68. Simopoulos, A.P. Omega-3 fatty acids in health and disease and in growth and development. The
American journal of clinical nutrition 1991, 54, 438-463.
69. Carta, G.; Murru, E.; Banni, S.; Manca, C. Palmitic Acid: Physiological Role, Metabolism and Nutritional Implications. Frontiers in physiology 2017, 8, 902, doi:10.3389/fphys.2017.00902.
70. Shultz, T.; Chew, B.; Seaman, W.; Luedecke, L. Inhibitory effect of conjugated dienoic derivatives of linoleic acid and β-carotene on the in vitro growth of human cancer cells. Cancer letters 1992, 63, 125-133.
71. Lee, K.N.; Kritchevsky, D.; Parizaa, M.W. Conjugated linoleic acid and atherosclerosis in rabbits.
Atherosclerosis 1994, 108, 19-25, doi:https://doi.org/10.1016/0021-9150(94)90034-5.
72. Barceló-Coblijn, G.; Murphy, E.J. Alpha-linolenic acid and its conversion to longer chain n−3 fatty acids: Benefits for human health and a role in maintaining tissue n−3 fatty acid levels. Progress in
Lipid Research 2009, 48, 355-374, doi:https://doi.org/10.1016/j.plipres.2009.07.002.
73. Fan, Y.Y.; Chapkin, R.S. Importance of dietary gamma-linolenic acid in human health and nutrition. The Journal of nutrition 1998, 128, 1411-1414.
74. Kosova, M.; Hrádková, I.; Mátlová, V.; Kadlec, D.; Šmidrkal, J.; Filip, V. Antimicrobial effect of 4‐ hydroxybenzoic acid ester with glycerol. Journal of clinical pharmacy and therapeutics 2015, 40, 436-440.
75. Barreca, D.; Laganà, G.; Leuzzi, U.; Smeriglio, A.; Trombetta, D.; Bellocco, E. Evaluation of the nutraceutical, antioxidant and cytoprotective properties of ripe pistachio (Pistacia vera L., variety Bronte) hulls. Food chemistry 2016, 196, 493-502.
76. Rivas-San Vicente, M.; Plasencia, J. Salicylic acid beyond defence: its role in plant growth and development. Journal of experimental botany 2011, 62, 3321-3338.
77. Hawley, S.A.; Fullerton, M.D.; Ross, F.A.; Schertzer, J.D.; Chevtzoff, C.; Walker, K.J.; Peggie, M.W.; Zibrova, D.; Green, K.A.; Mustard, K.J. The ancient drug salicylate directly activates AMP-activated protein kinase. Science 2012, 336, 918-922.
78. Ittaman, S.V.; VanWormer, J.J.; Rezkalla, S.H. The Role of Aspirin in the Prevention of Cardiovascular Disease. Clinical Medicine & Research 2014, 12, 147-154, doi:10.3121/cmr.2013.1197. 79. Christophersen, O.A. Radiation protection following nuclear power accidents: a survey of
putative mechanisms involved in the radioprotective actions of taurine during and after radiation exposure. Microbial ecology in health and disease 2012, 23, doi:10.3402/mehd.v23i0.14787.