- 1 - Influence of chiral compounds on the oxygen evolution reaction (OER) in the
water splitting process
Mirko Gazzotti1, Andrea Stefani1, Marco Bonechi2, Walter Giurlani2, Massimo Innocenti2*, Claudio Fontanesi1*
1Department of Engineering ‘Enzo Ferrari’, University of Modena and Reggio Emilia,
Via Vivarelli 10, 41125 Modena, Italy
2Department of Chemistry, University of Firenze, via della Lastruccia 3, 50019 Sesto
Fiorentino, Firenze, Italy.
Abstract
Results are presented concerning the influence on the water splitting process of enantiopure tartaric acid present in bulk solution. Stainless steel and electrodeposited nickel are used as working electrode (WE) surface. The latter is obtained by electrodeposition on the two poles of a magnet. The influence and role played by the chiral compound in solution has been assessed by comparing the current values, in cyclic voltammetry (CV) experiments, recorded in the potential range at which oxygen evolution reaction (OER) occurs. In the case of tartaric acid and nickel WE a spin polarization of about 4 % is found. The use of the chiral environment (bulk solution) and ferromagnetic chiral Ni electrode allows for observing the OER at a more favourable potential: about 50 mV (i.e. a cathodic, less positive, shift of the potential at which the oxygen evolution is observed).
Keywords: spin dependent electrochemistry, water splitting, nickel, chirality, OER
* corresponding author:
Massimo Innocenti, [email protected]
Claudio Fontanesi,: [email protected]
- 2 - 1. Introduction
- 3 -
for beta) spin state, hindering the production of 𝐻2𝑂2 (hydrogen peroxide). The latter is a highly reactive and corrosive compound, and it can be considered a side reaction’s undesirable product of the 𝑂𝐻 oxidation (compare equation (2)). In this work the CISS effect is exploited using chiral compounds in bulk solution, rather than adsorbed on the electrode surface. In principle, allowing to achieve a more efficient production of hydrogen through the water splitting but using a simpler and cheaper system. The water splitting process is studied as a function of different chiral additives/catalysers on both a stainless steel and nickel electrodes, the latter deposited directly on a magnetic surface.
2. Experimental
L-(+)-tartaric acid (the natural available enantiomer), L-(–)-aspartic acid, D-(+)-glucose were purchased from Sigma Aldrich and used without further purifications. The nickel electrodeposition was carried out using a classical Watt’s Bath (WB), whose composition is: 150 g/L of nickel sulphate, nickel chloride, 37 g/L boric acid H3BO3, pH = 5. Cyclic
voltammetry (CV) measurements were performed using both Autolab PGSTAT 128N and CHI660A potentiostats, employing a typical three-electrode electrochemical cell arrangement concerning the measurements involving the stainless steel working electrode. A different arrangement was adopted in the case of the Ni electrodeposited on the magnet: a Teflon cell, featuring a hole (0.8 cm diameter) in the bottom, was used in a vertical configuration where the Ni-on-the-magnet working electrode was tightened from below, a Teflon ring was used to ensure no solution leakage from the cell. Thus, Steel AISI 316L or the Ni-on-the-magnet surfaces were used as working electrodes (WE), while a Pt wire and a silver, silver chloride, KCl saturated solution (Ag/AgCl/KClsat)
electrodes were the counter (CE) and reference electrodes (RE), respectively. In order to check the quality of the nickel surface obtained via electrodeposition on the magnet, control experiments were carried out using glassy carbon, Pt and evaporated gold as working electrodes [21]. A KOH 0.1 M aqueous solution is used as base electrolyte in all reported electrochemical measurements.
3. Results
The overall water splitting reaction is, in principle, a simple redox reaction:
2𝐻2𝑂 → 2𝐻2+ 𝑂2 ∆E = 1.23 V vs RHE (1)
- 4 -
process, which involves a rather complex reaction mechanism featuring the transfer of 4 electrons [22]. The mechanism depends on a number of chemical as well as physical parameters, and in particular on the solution pH. In the following equations, (2)–(5), the overall half-cell reactions are reported:
Alkaline solution:
4𝑂𝐻− → 𝑂2+ 2𝐻2𝑂 + 4𝑒− 𝐸𝑎0= 0.401 V vs NHE (2)
4𝐻2𝑂 + 4𝑒− → 2𝐻2 + 4𝑂𝐻− 𝐸𝑐0 = –0.828 V vs NHE (3)
Acid solution:
2𝐻2𝑂 → 𝑂2+ 4𝐻++ 4𝑒− 𝐸𝑎0 = 1.229 V vs NHE (4)
4𝐻++ 4𝑒− → 𝐻2 𝐸𝑐0= 0.00 V vs NHE (5)
In principle, the potentials associated to reactions (2) and (4) are the thermodynamic values relevant to the OER, but beyond the thermodynamic potential it is necessary to apply an overpotential to observe the gas evolution. The key to improve the process efficiency is to minimize the overpotential [2–4]. The following sequence of elementary reaction steps represents the step-by-step overall reaction that occurs at the anode in an acid solution (where 𝑀 represent the anode metallic conductive substrate) [22–25].
𝑀 + 𝐻2𝑂(𝑏𝑢𝑙𝑘) → (𝑀)𝑂𝐻(𝑎𝑑𝑠)+ 𝐻(𝑠𝑜𝑙)+ + 𝑒− ∆G1 (6)
(𝑀)𝑂𝐻(𝑎𝑑𝑠) → (𝑀)𝑂(𝑎𝑑𝑠)+ 𝐻(𝑠𝑜𝑙)+ + 𝑒− ∆G2 (7)
(𝑀)𝑂(𝑎𝑑𝑠)+ 𝐻2𝑂(𝑏𝑢𝑙𝑘) → (𝑀)𝑂𝑂𝐻(𝑎𝑑𝑠)+ 𝐻(𝑠𝑜𝑙)+ + 𝑒− ∆G3 (8)
(𝑀)𝑂𝑂𝐻(𝑎𝑑𝑠)→ 𝑀 + 𝑂2(𝑔𝑎𝑠)+ 𝐻(𝑠𝑜𝑙)+ + 𝑒− ∆G4 (9)
∆𝐺𝑖is the Gibb’s free energy of each elementary steps. As reported in literature [28,29],
∆𝐺𝑂𝐸𝑅 is the max of the four ∆𝐺𝑖 values,namely ∆𝐺3. ∆𝐺𝑖can be calculated with the
formula ∆𝐺0 = −𝑛𝐹𝐸 if all elementary steps are known and so the ∆𝐸0 of the redox
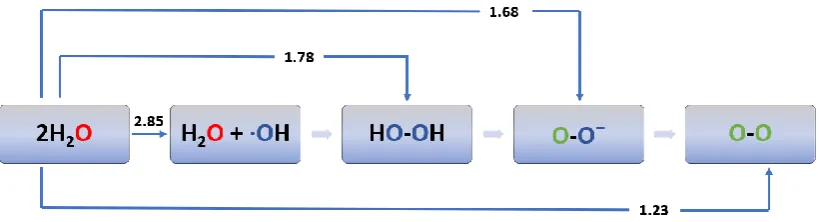
couple involved [26–28]. Those values are useful in compiling the Latimer diagram of the reaction, a compact diagram of each step involved in the redox chain, reported in Scheme 1, where numbers in the purple arrows represent the ∆𝐸0 of the reactions from
(6) to (9). The ∆𝐸0 of the total reaction is the results of the equation ∑ 𝑛41 𝑖∆𝐸𝑖0 ∑ 𝑛41 𝑖
where 𝑛𝑖
- 5 -
Scheme 1 – Water electrolysis: Latimer reaction mechanism.
The energy for the reaction can be provided by different sources, e.g. with the use of light, often coupled with catalytic substrate, like TiO2 [29–31]. Remarkably, the final product
at the anode, i.e. oxygen, is produced in its triplet state, which is the most stable molecular oxygen species. Here spin dependent electrochemistry can play a role. Thus, experiments of electrochemical water splitting were carried out using two different anodes: i) a stainless steel AISI 316 L electrode ii) Ni electrodeposited directly on the North (or South) pole surface of a permanent magnet (Ni-on-the-magnet electrode). Cyclic voltammetry results are presented focusing on the response of the anodic OER. In the case of the AISI 316L steel, results were collected using, L-(+)-tartaric acid, D-( )-aspartic acid and D-(+)-glucose. In the case of Ni-on-the-magnet electrode, CV measurements were still performed with bulk concentrations of D-(+)-glucose, L-(+)-tartaric acid and D-()-tartaric acid, and particular focus was also payed to potential sweeps experiments in presence of L-(+)-tartaric acid. On the whole, the experimental electrochemical outcome allows to discuss the role played on the OER efficiency by suitable spin injection; in relation to the chirality of compounds present in solution.
3.1 Steel AISI 316L
3.1.1 L-(+)-tartaric acid
- 6 -
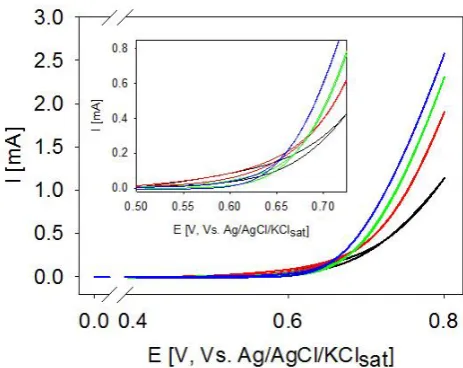
1) shows the lowest current, 1.2 mA, at 0.8 V. The current appears to be correlated to the concentration of the chiral compound with an inverse proportionality. The inset of Figure 1 presents a more detailed CV, in the 0.5 to 0.75 V potential range. The inset shows a small but neat difference between the forward and backward scans. The current for the KOH base electrolyte solution is always higher than the one measured in presence of tartaric acid.
Figure 1 – Cyclic voltammetry curves recorded on a steel AISI 316L WE. 50 mV/s potential scan rate, Pt sheet as CE and Ag/AgCl/KClsat as RE. KOH 0.1 M aqueous
solution is the base electrolyte. L-(+)-tartaric acid concentration: (blue) 0 mM, (green) 0.5 mM, (red) 5 mM, (black) 25 mM. The inset shows the CV detail in the 0.5 and 0.75 V potential range.
3.1.2 L-(–)-aspartic acid
- 7 -
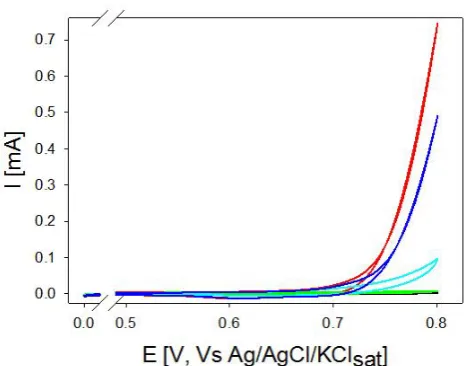
Figure 2 – Cyclic voltammetry curves recorded on a steel AISI 316L WE. 50 mV/s potential scan rate, Pt sheet as CE and Ag/AgCl/KClsat as RE. KOH 0.1 M aqueous
solution is the base electrolyte. L-(–)-aspartic acid concentration: (red) 0 mM, (blue) 1 mM, (light blue) 10 mM, (green) 50 mM, (black) 100 mM.
3.1.3 D-(+)-glucose
Figure 3 shows CVs as function of the concentration of D-(+)-glucose. A systematic variation in the current as a function of the D-(+)-glucose concentration can be noted. The maximum efficiency, obtained comparing the current response at fixed potential values, is found for the 10 mM D-(+)-glucose concentration (green curve, Figure 3). The KOH base electrolyte solution is characterized by the lowest current values (red curve, Figure 3).
Figure 3 – Cyclic voltammetry curves recorded on a steel AISI 316L WE. 50 mV/s potential scan rate, Pt sheet as CE and Ag/AgCl/KClsat as RE. KOH 0.1 M aqueous
- 8 - 3.2 Nickel electrodeposited on magnet
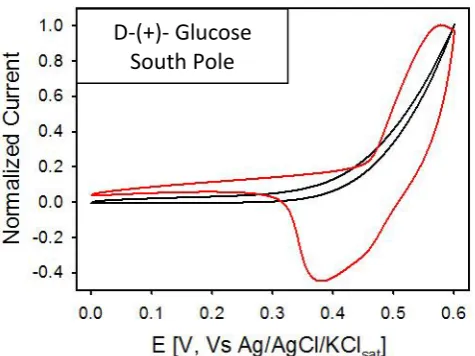
3.2.1 D-(+)-glucose
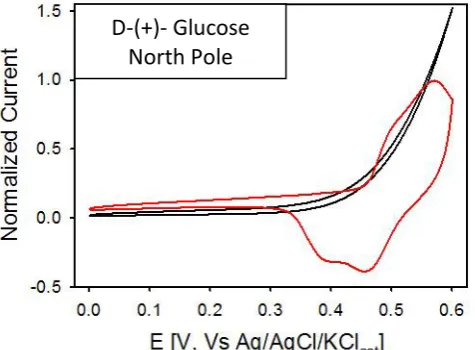
Figure 4 shows the cyclic voltammetry of Ni electrodeposited on the north surface of a permanent magnet used as working electrode in two different solutions: D-(+)-glucose 0.1 M in base electrolyte (KOH 0.1 M) and bare base electrolyte. The experimental set-up is the one with the Teflon cell described in Section 2 (2. Experimental). Note that Error! Reference source not found.4 and Error! Reference source not found.5 values
are normalized to point out the differences between the current in the solution with the chiral compound and the one with only the support electrolyte KOH. The value that has been used to normalize the data was the current associated to the oxidation of the Ni surface, otherwise the current peak, in the forward scan, in the base electrolyte curve: an opportune dividing coefficient is adopted in order to make that peak current value equal to 1. In the case of pure electrolyte KOH solution (red curve, Figure 4) the Ni peaks are evident, with the oxidation one happening at 0.55 V in the forward scan while during the backward scan the reduction peak splits in two smaller peaks, one at 0.39 V and the other at 0.46 V. Otherwise, the curve describing the current in the solution containing the chiral compound is completely different, resulting more like the one found with the stainless steel electrode (Figure 3). In particular, the D-(+)-Glucose curve doesn’t have the peaks of the Ni nor in forward nor in backward scan. The absence of peaks in the glucose’s curve means that the redox process became irreversible if the glucose is added to the KOH solution. The anodic peak current in the solution containing the chiral compound results being 50% higher than the one measured with only the support electrolyte.
Figure 4 – Normalized cyclic voltammetry curves recorded with electrodeposited Ni on the North pole of the magnet. Red curve: KOH 0.1 M aqueous solution. Black curve: 0.1
- 9 -
M of D-(+)-Glucose in KOH 0.1 M aqueous solution. 50 mV/s potential scan rate, a Pt as CE, Ag/AgCl/KClsat as RE.
Error! Reference source not found.5 shows the cyclic voltammetry measured on Ni
electrodeposited on the south pole of the permanent magnet used as working electrode; those experiments were carried out with the same solutions of Error! Reference source not found.4, in the same operative conditions. As in Error! Reference source not
found., the D-(+)-Glucose’s curve doesn’t have the characteristic peaks associated to the
oxidation and the reduction of the Ni.
For what concerns the support electrolyte, the graph shows one peak at 0.55 V in oxidation and one peak and a shoulder in reduction at 0.37 V and 0.45 V respectively, coherent to what has been already seen in Error! Reference source not found.4. As for Error! Reference source not found.4, the ordinate axis has been normalized using the
value of the current associated to the oxidation peak of the support electrolyte, so that peak would result having value equals to 1 on the normalized axis. In comparison with Figure 4, the current of the solution containing the chiral compound is lower in the south pole, resulting having the maximum current in oxidation almost equal to the one measured with the support electrolyte.
Figure 5 – Normalized cyclic voltammetry curves recorded with electrodeposited Ni on the south pole of the magnet. Red curve: KOH 0.1 M aqueous solution. Black curve: 0.1 M of D-(+)-Glucose in KOH 0.1 M aqueous solution. 50 mV/s potential scan rate, Pt as CE, Ag/AgCl/KCl as RE.
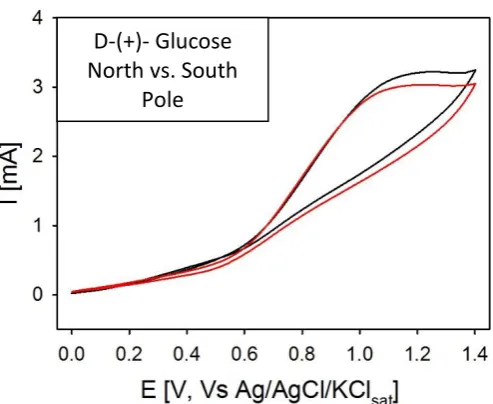
Error! Reference source not found. shows the comparison between CVs collected with
a Ni electrode on top of north and south magnet polarities, recorded in a wider potential range. Remarkably, at 1.2 V it is present a peak for both the curves and the north pole peak current of the oxidation process is larger than the south pole corresponding value.
- 10 -
Figure 6 – Comparison between cyclic voltammetry curves recorded with electrodeposited Ni on both poles of the magnet. Red curve: south pole with 0.1 M of (+)-Glucose in KOH 0.1 M aqueous solution. Black curve: north pole with 0.1 M of D-(+)-Glucose in KOH 0.1 M aqueous solution. 50 mV/s potential scan rate, Pt as CE, Ag/AgCl/KCl as RE.
3.3 Stepped sweeps
For a more accurate visual detection of the actual OER starting potential, “stepped sweeps” technique measurements were performed. In fact, differently from the previous CVs, these experiments feature incremental values of potential which is maintained constant for a chosen amount of time. These measurements are reported in Figures 7 and 8, showing the anodic current recorded as a function of time during the potential ramp for two different electrodes.
3.3.1 Stepped sweeps on AISI 316 L
Stepped sweeps were performed using the AISI 316 L steel sheet as working electrode, with the L-(+)-tartaric acid present in bulk solution. The applied potential programme as a function of time features a first potential ramp from 0 to 0.75 V at a 50 mVs-1 scan rate, followed by eight +0.01 V potential steps, up to 0.83 V. The potential was maintained constant for 10 s before the next step. Tartaric acid concentration 0.5 and 5 mM in bulk solution was used. A rather large increase in the current was found, which should reflect a more efficient way to produce oxygen. Indeed, visual observation of the anode shows that the oxygen evolution occurs at more negative (smaller) potentials, anticipating the OER between 20 to 30 mV with respect to the pure KOH base electrolyte solution (the relevant table (Table 1SI) is present in the Supporting Information).
D-(+)- Glucose North vs. South
- 11 -
Figure 7 – Stepped sweeps curves recorded on a steel AISI 316L WE, Pt sheet as CE and
Ag/AgCl/KClsat as RE. KOH 0.1 M aqueous solution is the base electrolyte. A potential
ramp from 0 to 0.75 V at a 50 mV/s was applied, followed by eight +0.01 V potential steps, up to 0.83 V. The potential was maintained constant for 10 s between each step.
L-(+)-tartaric acid concentration: (blue dash) 0 mM, (green) 0.5 mM, (red) 5 mM
3.3.2 Stepped sweeps Ni-on-magnet
- 12 -
shows that the oxygen evolution occurs at more negative (smaller) potentials, anticipating the OER between 30 to 50 mV with respect to the pure KOH base electrolyte solution (Table 1SI in the Supporting Information).
Figure 8 – Stepped sweeps curves recorded on a Ni deposited on magnet working electrode, a Pt sheet is the CE, Ag/AgCl/KCl is the RE. KOH 0.1 M aqueous solution the base electrolyte. First a potential ramp from 0 to 0.70 V at a 50 mV/s was applied, followed by eight +0.01 V potential steps, up to 0.78 V. The potential was maintained constant for 15 s between each step. L-(+)-tartaric acid concentration: (blue dash) South mag orientation 0 mM, (red dash) South mag orientation 0 mM, (light blue) South mag orientation 0.5 mM, (orange) North mag orientation 0.5mM
4. Discussion
- 13 -
is due to simple coulombic attraction between the anode (charged positively) and the relevant acid anion, which can be adsorbed on the surface eventually leading to a decrease in the overall current. A different electrochemical behaviour is found when the D-(+)-glucose is present in the solution, Figure 3. The current is always found larger than that of the base electrolyte, and in terms of efficiency the current increases as a function of the concentration until 10 mM, then starts to decrease for larger concentrations (compare black line, 100 mM, Figure 3). A different picture emerges when the ferromagnetic Ni surface, deposited on a magnet acting as substrate, is used as the anode. In the case of the L-(+)-tartaric acid, Error! Reference source not found.8 , the current recorded in response to potential sweeps in the presence of the bulk chiral compound is always larger than that of the base electrolyte. In this peculiar case, the effect of the presence of the chiral compound in bulk solution has been investigated by comparing the peak current values as a function of the magnet orientation (North vs. South), showing significant differences in the values of the current obtained at a fixed potential. Such an analysis is a crucial issue in unravelling the role of the spin. Moreover, to obtain a complete picture, the electrochemical results can be compared for the two enantiomers. Altogether four different situations are to be quantitatively compared: 1) (+)-tartaric acid North 2) L-(+)-tartaric acid south 3) D-(-)-tartaric acid north 4) D-(–)-tartaric acid south. Table 2SI, 3SI, 4SI and Table 5SI report, in the most synthetic way, the current results obtained performing CVs in all four cases. Moreover, Table 6SI and Table 7SI aim to present in a clear and simple way, as much as possible, the catalytic effect observed in the different combination of enantiomers and the magnet pole. In particular, the sign found in column titled “sgn (Jratio North - Jratio South)” (Table 6SI and Table 7SI) exhibit what is the most
efficient combination. Remarkably, the L-(+)-tartaric acid North is more effective than L-(+)-tartaric acid South in a consistent way, while the D-(-)-tartaric acid south combination is found more effective than the D-(-)-tartaric acid North (coherently with the results of the stepped sweeps previously presented in Section 3.3.2). In the case of the glucose, only the D-(+)-glucose enantiomer was examined and it is found that the current for the D-(+)-glucose north combination is larger than the D-(+)-glucose south one, Error! Reference source not found.4 and Figure 5. Please note that due to fluctuations
in the base electrolyte CVs, in Error! Reference source not found.4 and Error! Reference source not found.5 normalized data are presented. Table 8SI and Table 9SI
- 14 -
different Ni surface deposited on poles’ magnet. Those values are calculated with the formula (10).
(𝐽(𝑇𝑎𝑟𝑡)
𝐽(𝐾𝑂𝐻))(𝑁𝑜𝑟𝑡ℎ)−( 𝐽(𝑇𝑎𝑟𝑡) 𝐽(𝐾𝑂𝐻))(𝑆𝑜𝑢𝑡ℎ)
(𝐽(𝑇𝑎𝑟𝑡)
𝐽(𝐾𝑂𝐻))(𝑁𝑜𝑟𝑡ℎ)+( 𝐽(𝑇𝑎𝑟𝑡) 𝐽(𝐾𝑂𝐻))(𝑆𝑜𝑢𝑡ℎ)
= 𝑆𝑃% (10)
5. Conclusion
- 15 -
demanding. Without using exotic materials (for example cadmium based nanoparticles) which are also cheap and non-strategic.
All in all, the results obtained especially on the Ni as a function of the magnet orientation, relate well with results previously presented in the literature. This gives further impulse to the scientific research in the field of spin effects in the OER process.
Acknowledgements
The authors acknowledge financial support for this research by University of Modena and Reggio Emilia (Department of Engineering ‘Enzo Ferrari’), through “Photo-electrochemical water splitting” (FAR 2019) project.
References
[1] D. Mishra, T.Z. Markus, R. Naaman, M. Kettner, B. Göhler, H. Zacharias, N. Friedman, M. Sheves, C. Fontanesi, Spin-dependent electron transmission through bacteriorhodopsin embedded in purple membrane, Proc. Natl. Acad. Sci. 110 (2013) 14872–14876. https://doi.org/10.1073/pnas.1311493110.
[2] W. Mtangi, V. Kiran, C. Fontanesi, R. Naaman, Role of the Electron Spin Polarization in Water Splitting, J. Phys. Chem. Lett. 6 (2015) 4916–4922. https://doi.org/10.1021/acs.jpclett.5b02419.
[3] W. Mtangi, F. Tassinari, K. Vankayala, A. Vargas Jentzsch, B. Adelizzi, A.R.A. Palmans, C. Fontanesi, E.W. Meijer, R. Naaman, Control of Electrons’ Spin Eliminates Hydrogen Peroxide Formation During Water Splitting, J. Am. Chem. Soc. 139 (2017) 2794–2798. https://doi.org/10.1021/jacs.6b12971.
[4] C. Fontanesi, R. Naaman, W. Mtangi, Water splitting method and system, WO 2016056011 A1, 2016.
[5] X. Liang, J. Liu, D. Zeng, C. Li, S. Chen, H. Li, Hydrogen generation promoted by photocatalytic oxidation of ascorbate and glucose at a cadmium sulfide electrode,
Electrochimica Acta. 198 (2016) 40–48.
https://doi.org/10.1016/j.electacta.2016.03.023.
[6] F.A. Garcés-Pineda, M. Blasco-Ahicart, D. Nieto-Castro, N. López, J.R. Galán-Mascarós, Direct magnetic enhancement of electrocatalytic water oxidation in alkaline media, Nat. Energy. 4 (2019) 519–525. https://doi.org/10.1038/s41560-019-0404-4.
[7] S. Haschke, D. Pankin, Y. Petrov, S. Bochmann, A. Manshina, J. Bachmann, Design Rules for Oxygen Evolution Catalysis at Porous Iron Oxide Electrodes: A 1000‐Fold Current Density Increase, ChemSusChem. 10 (2017) 3644–3651. https://doi.org/10.1002/cssc.201701068.
[8] P. Beiter, T. Tian, 2015 Renewable Energy Data Book, National Renewable Energy Lab. (NREL), Golden, CO (United States), 2016. https://doi.org/10.2172/1339347. [9] K. AlRafea, M. Fowler, A. Elkamel, A. Hajimiragha, Integration of renewable energy
- 16 -
[10] G. Krajačić, R. Martins, A. Busuttil, N. Duić, M. da Graça Carvalho, Hydrogen as an energy vector in the islands’ energy supply, Int. J. Hydrog. Energy. 33 (2008) 1091– 1103. https://doi.org/10.1016/j.ijhydene.2007.12.025.
[11] L. Ntziachristos, C. Kouridis, Z. Samaras, K. Pattas, A wind-power fuel-cell hybrid system study on the non-interconnected Aegean islands grid, Renew. Energy. 30 (2005) 1471–1487. https://doi.org/10.1016/j.renene.2004.11.007.
[12] A. Züttel, Materials for hydrogen storage, Mater. Today. 6 (2003) 24–33. https://doi.org/10.1016/S1369-7021(03)00922-2.
[13] S. Niaz, T. Manzoor, A.H. Pandith, Hydrogen storage: Materials, methods and perspectives, Renew. Sustain. Energy Rev. 50 (2015) 457–469. https://doi.org/10.1016/j.rser.2015.05.011.
[14] P. Morvillo, F. Parenti, R. Diana, C. Fontanesi, A. Mucci, F. Tassinari, L. Schenetti, A novel copolymer from benzodithiophene and alkylsulfanyl-bithiophene: Synthesis, characterization and application in polymer solar cells, Sol. Energy Mater. Sol. Cells. 104 (2012) 45–52. https://doi.org/10.1016/j.solmat.2012.04.044.
[15] P. Morvillo, R. Diana, C. Fontanesi, R. Ricciardi, M. Lanzi, A. Mucci, F. Tassinari, L. Schenetti, C. Minarini, F. Parenti, Low band gap polymers for application in solar cells: synthesis and characterization of thienothiophene-thiophene copolymers, Polym. Chem. (2013). https://doi.org/10.1039/C3PY01618H.
[16] S.J. Appleyard, Simple photovoltaic cells for exploring solar energy concepts, Phys. Educ. 41 (2006) 409.
[17] K. Ray, S.P. Ananthavel, D.H. Waldeck, R. Naaman, Asymmetric Scattering of Polarized Electrons by Organized Organic Films of Chiral Molecules, Science. 283 (1999) 814–816. https://doi.org/10.1126/science.283.5403.814.
[18] I. Carmeli, K.S. Kumar, O. Heifler, C. Carmeli, R. Naaman, Spin Selectivity in Electron Transfer in Photosystem I, Angew. Chem. Int. Ed. 53 (2014) 8953–8958. https://doi.org/10.1002/anie.201404382.
[19] R. Naaman, D.H. Waldeck, Chiral-Induced Spin Selectivity Effect, J. Phys. Chem. Lett. 3 (2012) 2178–2187. https://doi.org/10.1021/jz300793y.
[20] F. Tassinari, S.P. Mathew, C. Fontanesi, L. Schenetti, R. Naaman, Electric-Field-Driven Alignment of Chiral Conductive Polymer Thin Films, Langmuir. 30 (2014) 4838–4843. https://doi.org/10.1021/la500657e.
[21] M. Gazzotti, S. Arnaboldi, S. Grecchi, R. Giovanardi, M. Cannio, L. Pasquali, A. Giacomino, O. Abollino, C. Fontanesi, Spin-dependent electrochemistry: Enantio-selectivity driven by chiral-induced spin Enantio-selectivity effect, Electrochimica Acta. 286 (2018) 271–278. https://doi.org/10.1016/j.electacta.2018.08.023.
[22] X. Sala, S. Maji, R. Bofill, J. García-Antón, L. Escriche, A. Llobet, Molecular Water Oxidation Mechanisms Followed by Transition Metals: State of the Art, Acc. Chem. Res. 47 (2014) 504–516. https://doi.org/10.1021/ar400169p.
[23] G.V. Buxton, C.L. Greenstock, W.P. Helman, A.B. Ross, Critical Review of rate constants for reactions of hydrated electrons, hydrogen atoms and hydroxyl radicals (⋅OH/⋅O− in Aqueous Solution, J. Phys. Chem. Ref. Data. 17 (1988) 513– 886. https://doi.org/10.1063/1.555805.
[24] H. Dau, C. Limberg, T. Reier, M. Risch, S. Roggan, P. Strasser, The Mechanism of Water Oxidation: From Electrolysis via Homogeneous to Biological Catalysis, ChemCatChem. 2 (2010) 724–761. https://doi.org/10.1002/cctc.201000126. [25] R. Giovanardi, C. Fontanesi, W. Dallabarba, Adsorption of organic compounds at
- 17 -
process, Electrochimica Acta. 56 (2011) 3128–3138. https://doi.org/10.1016/j.electacta.2011.01.065.
[26] C. Fontanesi, R. Benassi, R. Giovanardi, M. Marcaccio, F. Paolucci, S. Roffia, Computational electrochemistry. Ab initio calculation of solvent effect in the multiple electroreduction of polypyridinic compounds, J. Mol. Struct. 612 (2002) 277–286.
[27] C. Fontanesi, Theoretical study of the dissociative process of the 4-chlorotoluene radical anion, J. Mol. Struct. THEOCHEM. 392 (1997) 87–94. https://doi.org/10.1016/S0166-1280(97)90379-1.
[28] M. Marcaccio, F. Paolucci, C. Fontanesi, G. Fioravanti, S. Zanarini, Electrochemistry and spectroelectrochemistry of polypyridine ligands: A theoretical approach, Inorganica Chim. Acta. 360 (2007) 1154–1162.
[29] A. Pozio, A. Masci, M. Pasquali, Nickel-TiO2 nanotube anode for
photo-electrolysers, Sol. Energy. 136 (2016) 590–596.
https://doi.org/10.1016/j.solener.2016.07.040.
[30] Y. Kuang, T. Yamada, K. Domen, Surface and Interface Engineering for Photoelectrochemical Water Oxidation, Joule. (n.d.). https://doi.org/10.1016/j.joule.2017.08.004.
[31] M. Rudolph, D. Stanescu, J. Alvarez, E. Foy, J.-P. Kleider, H. Magnan, T. Minea, N. Herlin-Boime, B. Bouchet-Fabre, M.-C. Hugon, The role of oxygen in magnetron-sputtered Ta3N5 thin films for the photoelectrolysis of water, Surf. Coat. Technol. 324 (2017) 620–625. https://doi.org/10.1016/j.surfcoat.2016.09.007.