O R I G I N A L R E S E A R C H
Higher blood pressure increases arterial stiffness
modi
fi
ed by blood glucose levels in a Chinese
community-based study
This article was published in the following Dove Press journal: Diabetes, Metabolic Syndrome and Obesity: Targets and Therapy
Xiaotong Dai1 Ying Yang2
Guan-Liang Cheng2 Jia Jia2
Fang-Fang Fan2 Jian-Ping Li2 Yong Huo2 Zhike Liu1 Dafang Chen1 Yan Zhang2
1Department of Epidemiology and Biostatistics, School of Public Health, Peking University, Beijing, People’s Republic of China;2Department of Cardiology, Peking University First Hospital, Beijing, People’s Republic of China
Background:Increased arterial stiffness measured by brachial-ankle pulse wave velocity is associated with cardiovascular disease. However, the rates at which brachial-ankle pulse wave velocity and blood glucose accelerate within individuals who differ in blood pressure levels are largely unknown.
Methods: This study was based on the baseline data of a Chinese community-based atherosclerosis cohort which included 7402 individuals. Using generalized linear regression models, the relationship between blood glucose levels and brachial-ankle pulse wave velo-city, and the relationship between blood pressure levels and brachial-ankle pulse wave velocity were examined.
Results:A marked interaction between hypertensive state and diabetic state was seen for brachial-ankle pulse wave velocity (P for interaction <0.001). The adjusted coefficient for subjects stratified by hypertensive groups and diabetic states showed that the highest brachial-ankle pulse wave velocity risk subjects were those who had both diabetes and hypertension (B=403.24; 95% CI: 372.43–434.05;P<0.001).
Conclusions: The participants with increased arterial stiffness demonstrate a high preva-lence of higher blood pressure. When high blood glucose levels co-occur with high blood pressure levels, there is a remarkable increase in arterial stiffness.
Keywords:communities, diabetes, hypertension
Introduction
Cardiovascular disease remains a major cause of health loss for all regions of the world.1 And epidemiological studies have demonstrated that increased arterial stiffness2,3is an independent risk factor for cardiovascular events. Degenerative stiff-ness of the arterial beds is referred as arteriosclerosis,4which results in cardiovascular events. An independent predictive value of arterial stiffness for cardiovascular events has been demonstrated in general as well as in selected populations. Increased arterial stiffness is also an independent risk factor for multiple organ damage5and dementia.6,7 Arterial stiffness is a shared consequence of diabetes mellitus type 2 (T2DM) and is causally involved in the progression of diabetes complication.8,9On the other hand, cross-sectional studies show that blood pressure (BP) is strongly associated with brachial-ankle pulse wave velocity (baPWV). BP is transmitted into the arterial wall, where its increase progressively stimulates the less distensible collagen fibers, thus resulting in a progressively stiffer artery.10This process may also lead to aortic root dilation.11Therefore, it is important to study arterial stiffness, which can be measured
Correspondence: Dafang Chen Department of Epidemiology and Biostatistics, School of Public Health, Peking University, No.38, Xueyuan Road, Haidian District, Beijing 100191, People’s Republic of China
Tel +86 108 280 2644 Fax +86 108 280 2644 Email dafangchen@bjmu.edu.cn Yan Zhang
Department of Cardiology, Peking University First Hospital, No.8 Xishiku St, Xicheng District, Beijing, People’s Republic of China
Tel +86 108 357 5728 Email drzhy1108@163.com
Diabetes, Metabolic Syndrome and Obesity: Targets and Therapy
Dove
press
open access to scientific and medical research
Open Access Full Text Article
Diabetes, Metabolic Syndrome and Obesity: Targets and Therapy downloaded from https://www.dovepress.com/ by 118.70.13.36 on 21-Aug-2020
by a simple, invasive, and accurate index of brachial-ankle PWV, and it has been clinically validated.12
However, the rates at which baPWV and blood glucose accelerate within individuals who differ in blood pressure levels are largely unknown, but their definition is required to unravel the conundrum of interactions of blood glucose levels and blood pressure levels as baPWV increases and is also required to correct power analyses. Therefore, understanding conundrum between blood glucose levels, blood pressure levels, and arterial stiffness is a major public health priority.
To address present gaps in understanding modification of blood glucose levels when the blood pressure level affects arterial stiffness, the relation of a comprehensive panel of blood pressure levels, blood glucose levels was assessed based on the baseline data of a Chinese commu-nity-based atherosclerosis cohort.
Materials and methods
Study subjects
The study has been conducted from December 2011 to April 2012 at the baseline of a Chinese community-based atherosclerosis cohort. At first, 9540 participants were recruited in Gucheng and Pingguoyuan communities in Shijingshan district of Beijing, China. The participants were recruited either by responding to recruitment posters that detailed the study or by invited phone calls if they had health medical records in community health centers. The study design and selection criteria have been introduced before.13 To avert the bias from the atherosclerosis or related diseases, the patients with a history of coronary heart disease, stroke/ transient ischemic attack, peripheral arterial disease (ankle-brachial index (ABI)<0.9), anemia, chronic kidney disease, and renal artery stenosis were excluded (n=1643). Then, miss-ing data were deleted, which included pulse wave velocity (PWV) (n=331), systolic blood pressure (SBP) or diastolic blood pressure (DBP) (n=97), fasting blood glucose (FBG) (n=1), 2-hr post-load glucose (2-h PG) (n=62), and ABI (n=4). Finally, 7402 eligible participants were involved in our ana-lyses. All of them offered written informed consent. The study protocol was approved by the ethics committee of Peking University First Hospital. The research was conducted accord-ing to the World Medical Association Declaration of Helsinki.
Data collection
The data were collected by trained research staff according to a standard operation procedure. Subjects were inter-viewed using a standardized questionnaire, including
demographic characteristics, health behavior, histories of drugs and diseases. Current drinking habit was defined as drinking once per week lasting at least half a year. Current smoking habit was defined as current active smokers with one cigarette per day lasting at least half a year. Body mass index (BMI) was calculated as weight (kg)/[height (m)]2.
Blood pressure tests
Seated blood pressure was obtained from the right arm with calibrated sphygmomanometer HEM 7117 device (Omron Healthcare Co Ltd) after the subjects had rested in the seated position for 5 mins in a quiet room. The average was calculated using three consecutive measure-ments separated by≥1 min interval. In light of 2013 ESC-ESH guidelines, participants were classified into three groups: optimal BP, SBP<120 mmHg, and DBP<80 mmHg without antihypertensive treatment; prehyperten-sion, SBP 120–139 mmHg, or DBP 80–89 mmHg without antihypertensive treatment; hypertension, SBP≥140 mmHg or DBP≥90 mmHg or antihypertensive drug usage.
Blood glucose tests
Overnight fasting blood samples at least 12 hrs were drawn from the antecubital vein using 4 mL coagulation-promoting vacuum tubes in the morning. Subsequently, the subjects underwent standard 75-g oral glucose tolerance test (or, dia-betes mellitus (DM) patients consumed equivalent bread) with 2 hr plasma glucose sampled. Biochemistry index in plasma, including fasting blood glucose, 2-hr post-load glucose, total cholesterol (TC), high-density lipoprotein cholesterol (HDL-C), and total triglycerides (TG) were examined by the auto-matic biochemical analyzer (Roche-C8000) according to a standard procedure. In line with the American Diabetes Association diagnostic criteria, participants were classified into three groups: normal glucose, FBG<5.6 mmol/L and 2-h PG <7.8 mmol/L without antidiabetics treatment; predia-betes, FBG 5.6–6.9 mmol/L or 2-h PG 7.8–11.0 mmol/L without antidiabetics treatment; diabetes, FBG≥7.0 mmol/L or 2-h PG≥11.1 mmol/L or any antidiabetics treatment.
Brachial-ankle pulse wave velocity
After 5 mins seated rest in a quiet room, the brachial-ankle pulse wave velocity (baPWV) measured from the partici-pants in the supine position was obtained by a noninvasive vascular screening device (BP-203RPE II device, Omron Healthcare, Kyoto, Japan) by trained technician according to standard procedures in the morning. Blood pressure and pulse waves velocity in bilateral brachial tibial arteries
Diabetes, Metabolic Syndrome and Obesity: Targets and Therapy downloaded from https://www.dovepress.com/ by 118.70.13.36 on 21-Aug-2020
were recorded simultaneously, placing four pneumatic pressure cuff in arms and ankles. The baPWV was the average of left and right baPWV due to the strong correla-tion between them (r=0.968, P<0.001).
Statistical analyses
All data were represented as mean±SD for continuous variables and proportion for categorical variables. ANOVA was used to examine intergroup differences of continuous variables. Chi-square test was performed for the comparison of the difference in categorical variables. Generalized linear regression models were applied to assess the association of different blood glucose level and blood pressure level with baPWV. For multiple gen-eralized linear regression models (adjusted models), age, sex, BMI, waist-to-hip ratio (WHR), physical exercise, current drinking, current smoking, TG, TC, high-density lipoprotein cholesterol (HDL), diabetic state, hypertensive
groups, antihypertensive drugs, antidiabetics drugs, lipid-lowering drugs were adjusted in corresponding models. Moreover, the interaction of diabetic state and hyperten-sive state on baPWV was detected by the generalized linear regression by adding a cross-product term with main effects and other covariates. Then, the joint effects were estimated after adjusting for covariates. The analyses were performed using SAS 9.3 and Empower(R) (www. empowerstats.com, X&Y solutions, Inc., Boston, MA) and R (http://www.R-project.org). A two-sided P-value<0.05 was considered statistically significant.
Results
Characteristics by different blood
pressure level
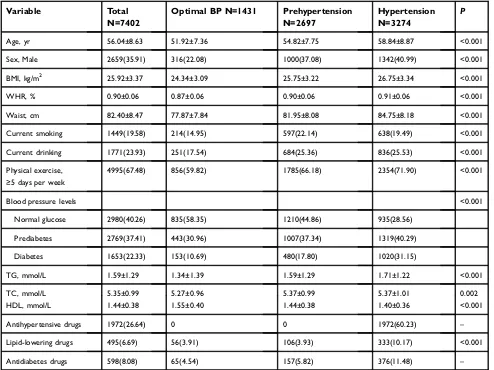
Characteristics of the study subject by different blood pres-sure level summarized in Table 1. The mean age of the
Table 1Characteristics by different blood pressure level
Variable Total N=7402
Optimal BP N=1431 Prehypertension N=2697
Hypertension N=3274
P
Age, yr 56.04±8.63 51.92±7.36 54.82±7.75 58.84±8.87 <0.001
Sex, Male 2659(35.91) 316(22.08) 1000(37.08) 1342(40.99) <0.001
BMI, kg/m2 25.92±3.37 24.34±3.09 25.75±3.22 26.75±3.34 <0.001
WHR, % 0.90±0.06 0.87±0.06 0.90±0.06 0.91±0.06 <0.001
Waist, cm 82.40±8.47 77.87±7.84 81.95±8.08 84.75±8.18 <0.001
Current smoking 1449(19.58) 214(14.95) 597(22.14) 638(19.49) <0.001 Current drinking 1771(23.93) 251(17.54) 684(25.36) 836(25.53) <0.001 Physical exercise,
≥5 days per week
4995(67.48) 856(59.82) 1785(66.18) 2354(71.90) <0.001
Blood pressure levels <0.001
Normal glucose 2980(40.26) 835(58.35) 1210(44.86) 935(28.56) Prediabetes 2769(37.41) 443(30.96) 1007(37.34) 1319(40.29)
Diabetes 1653(22.33) 153(10.69) 480(17.80) 1020(31.15)
TG, mmol/L 1.59±1.29 1.34±1.39 1.59±1.29 1.71±1.22 <0.001
TC, mmol/L 5.35±0.99 5.27±0.96 5.37±0.99 5.37±1.01 0.002
HDL, mmol/L 1.44±0.38 1.55±0.40 1.44±0.38 1.40±0.36 <0.001
Antihypertensive drugs 1972(26.64) 0 0 1972(60.23) –
Lipid-lowering drugs 495(6.69) 56(3.91) 106(3.93) 333(10.17) <0.001
Antidiabetes drugs 598(8.08) 65(4.54) 157(5.82) 376(11.48) –
Abbreviations:BMI, body mass index; BP, blood pressure; WHR,waist-to-hip ratio; TG, triglycerides; TC, total cholesterol; HDL, high-density lipoprotein cholesterol.
Diabetes, Metabolic Syndrome and Obesity: Targets and Therapy downloaded from https://www.dovepress.com/ by 118.70.13.36 on 21-Aug-2020
population was 56.04±8.63 years and 64.09% of them were women. There was 1431 (19.33%) normal BP, 2697 (36.44%) prehypertension, and 3274 (44.23%) hypertension. Age, sex, BMI, WHR, current smoking, current drinking, physical exercise, hypertensive groups, TG, TC, HDL, anti-hypertensive drugs, and lipid-lowering drugs were statisti-cally different among the three groups (P<0.05).
The effect of blood pressure levels and
blood glucose levels on increased baPWV
risk
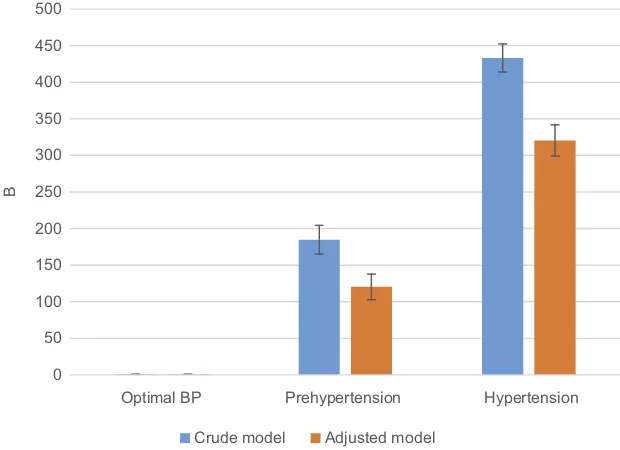
The effect of different blood pressure levels and blood glucose levels on increased baPWV risk from generalized linear regression was presented in Figures 1 and 2. In unadjusted model, both prediabetes and diabetes were sig-nificantly associated with an increased risk of baPWV compared with normal glucose (P<0.001). The associa-tions were attenuated after adjustment (B =43.62,
P<0.001; B =95.58, P<0.001, respectively). Similar to the association with diabetic state and baPWV risk, pre-hypertension and pre-hypertension were significantly asso-ciated with an increased risk of baPWV compared with optimal BP (P<0.001) in unadjusted model, and the afore-mentioned associations were attenuated after adjustment (B=120.34, P<0.001; B=320.35, P<0.001, respectively).
(Table S1.)
The effect of blood glucose levels on the
risk of baPWV by different blood
pressure level
As shown in the upper half of Figure 3, there was sig-nificantly higher baPWV risk in prediabetes and diabetes compared with normal glucose in all blood pressure levels. Prediabetes did not show a significantly higher baPWV risk compared with normal glucose in optimal BP group (P=0.459) after correcting for confounding variables.
(Table S2.)
Interaction of blood glucose levels and
blood pressure level on baPWV
For each blood pressure level, there was a high increase in baPWV with prediabetes and diabetes compared with normal glucose (Figures 4and5). When the participants were stratified by blood pressure levels (Table S3.), prediabetes did not have significantly higher baPWV risk for optimal BP group (P=0.705). However, a marked interaction between blood pressure levels and blood glucose levels was seen for baPWV (adjusted B=19.71; P for interaction<0.001). The adjusted coefficient for subjects stratified by categories of blood pressure levels and blood glucose levels (Table S3.) showed that the highest baPWV risk subjects were those who had both diabetes and hypertension (adjusted B=403.24;
P<0.001 compared with optimal BP/normal glucose).
0 50 100 150 200 250 300 350 400 450 500
Optimal BP Prehypertension Hypertension
B
Crude model Adjusted model
Figure 1The effect of blood pressure levels on the risk of baPWV. Adjusted for sex, BMI, WHR, physical exercise, current drinking, current smoking, TG, TC, HDL, antihypertensive drugs, antidiabetes drugs, and lipid-lowering drugs.
Abbreviations:baPWV, brachial-ankle pulse wave velocity; BMI, body mass index; BP, blood pressure; WHR,waist-to-hip ratio; TG, triglycerides; TC, total cholesterol; HDL, high-density lipoprotein cholesterol.
Diabetes, Metabolic Syndrome and Obesity: Targets and Therapy downloaded from https://www.dovepress.com/ by 118.70.13.36 on 21-Aug-2020
Discussion
In this study, we not only observe the association between different blood pressure levels and baPWV, different blood glucose levels and baPWV but alsofind out the modification of blood glucose levels when higher blood pressure level increases baPWV. To our knowledge, this study is first to
show the adverse and independent impact of high blood glu-cose on arterial stiffness, particularly in those with the higher blood pressure in Chinese community-based population.
Our study shows both prediabetes and diabetes are signifi -cantly associated with an increased risk of baPWV compared with normal glucose (P< 0.001). And several previous studies
-50 0 50 100 150 200 250
Normal glucose
Prediabetes Diabetes Normal
glucose
Prediabetes Diabetes
Crude model Adjusted model
B
Optimal BP Prehypertension Hypertension
Figure 3The effect of blood glucose levels on the risk of baPWV by different blood pressure level. Adjusted for sex, BMI, WHR, physical exercise, current drinking, current smoking, TG, TC, HDL, antihypertensive drugs, antidiabetes drugs, and lipid-lowering drugs.
Abbreviations: baPWV, brachial-ankle pulse wave velocity; BMI, body mass index; BP, blood pressure; WHR,waist-to-hip ratio; TG, triglycerides; TC, total cholesterol; HDL, high-density lipoprotein cholesterol.
0 50 100 150 200 250 300
Normal glucose Prediabetes Diabetes
B
Crude model Adjusted model
Figure 2The effect of blood glucose levels on the risk of baPWV. Adjusted for sex, BMI, WHR, physical exercise, current drinking, current smoking, TG, TC, HDL, antihypertensive drugs, antidiabetes drugs, and lipid-lowering drugs.
Abbreviations:baPWV, brachial-ankle pulse wave velocity; BMI, body mass index; WHR,waist-to-hip ratio; TG, triglycerides; TC, total cholesterol; HDL, high-density lipoprotein cholesterol.
Diabetes, Metabolic Syndrome and Obesity: Targets and Therapy downloaded from https://www.dovepress.com/ by 118.70.13.36 on 21-Aug-2020
have also shown an increase in fasting plasma glucose (FPG), even within the normal range, associated with aggravated arterial stiffness than the normoglycemia.14–16Prenner et al indicate that one of the most important components in the onset of diabetes is arterial stiffness, and before the development of overt diabetes, the endothelial dysfunction may even be accompanied by the early insulin resistance and impaired fast-ing glucose.8 Another study also finds blunted endothelial
function can lead to increased stiffness of the large arteries.17 Both endothelial NO dysregulation and advanced glycation end products (AGEs) play huge roles in development of arter-ial stiffness.8Inhibition of NO bioavailability contributes to the increase in BP.18AGEs is the production of proteins and lipids on exposure to the setting of hyperglycemia. And it can accel-erate the age-related vascular changes and the onset of cardi-ovascular events in both non-diabetic and diabetic
Optimal BP
Prehypertension Hypertension
0 100 200 300 400 500
Normal glucose
Prediabetes Diabetes
B
P for interaction<0.001
Optimal BP Prehypertension Hypertension
Figure 5The joint effect and interaction of blood pressure levels, blood glucose levels on baPWV in adjusted models. Adjusted for sex, BMI, WHR, physical exercise, current drinking, current smoking, TG, TC, HDL, antihypertensive drugs, antidiabetes drugs, and lipid-lowering drugs.
Abbreviations: baPWV, brachial-ankle pulse wave velocity; BMI, body mass index; BP, blood pressure; WHR,waist-to-hip ratio; TG, triglycerides; TC, total cholesterol; HDL, high-density lipoprotein cholesterol.
Normal glucose
Optimal BP
Prehypertension
Hypertension
Prediabetes Diabetes
1300 1400 1500 1600 1700 1800
b
a
PWV, cm/s
Figure 4Shown are adjusted least squares mean (standard error) for baPWV by diabetic state and hypertensive groups. Adjusted for sex, BMI, WHR, physical exercise, current drinking, current smoking, TG, TC, HDL, antihypertensive drugs, antidiabetes drugs, and lipid-lowering drugs.
Abbreviations: baPWV, brachial-ankle pulse wave velocity; BMI, body mass index; BP, blood pressure; WHR,waist-to-hip ratio; TG, triglycerides; TC, total cholesterol; HDL, high-density lipoprotein cholesterol.
Diabetes, Metabolic Syndrome and Obesity: Targets and Therapy downloaded from https://www.dovepress.com/ by 118.70.13.36 on 21-Aug-2020
populations.19–21 Furthermore, superoxide production increased and NO synthase activation impaired in the insulin-resistant state, leading to a reduction in NO bioavailability. Ultimately it will give rise to arterial stiffness and herald the development of microvascular changes.22–24
Another studies release that increased SBP, even in the prehypertension range, relates to the elevated PWV which persisted after adjusting for traditional cardiovascular risk factors.25,26 Similar to the result of our research: prehyper-tension and hyperprehyper-tension were significantly associated with an increased risk of baPWV compared with optimal BP (P<0.001). There is also a complex relationship between arterial stiffness and blood pressure. Some longitudinal studies indicate that higher SBP is associated with faster increase of PWV,25 and the results of other reports reveal that higher PWV may herald the longitudinal increase in SBP.27,28 The association between arterial stiffness and BP could be described as a vicious cycle. Nigam et al suggest the arterial wall structural alterations and mechanical stretch changes maybe the mechanisms of hypertension on aortic stiffening, such as increased collagen content and decreased elastin content.29 Because of the decrease in arterial com-pliance, the SBP is increased and the DBP is decreased, which contributes to the increase of the pulse pressure (PP). On the one hand, the vascular remodeling impacts BP.30 A stiffer wall gives rise to the higher PWV, and then causes the early arrival of reflection pressure waves. The above series of processes lead to the increase in SBP and PP.31 Circadian BP variability32 and chronic kidney disease also impact on BP variability.33 As noted in the Hypertension Branch and Vascular Biology review, the concordance of results in animal and clinical studies strengthens the support for the hypothesis that arterial stiffness plays a potential causal role in the development of hypertension and stresses the need to find molecular pathways that contribute to arterial stiffness and subsequent hypertension.34
Epidemiological studies have established that hyperten-sion and DM are independent risk factors for atherosclero-sis. However, there are few reports about mechanism of the interaction of blood pressure levels and blood glucose levels on arterial stiffness. Our study releases a marked modification of blood glucose levels when higher blood pressure level increases arterial stiffness (P for interac-tion<0.001). Ma et al indicate that the interaction of hyper-tension and T2DM aggravates endothelial dysfunction and impairs the smooth muscle function.35 Tsao et al demon-strate that both hypertension and DM give rise to increased monocyte adherence to the endothelium. Monocyte
chemotactic protein-1 expression and increased vascular superoxide production are associated with the above abnormality. In addition, there may be an additive interac-tion between hypertension and hyperglycemia in their effects on endothelial adhesiveness.36 The inflammation increases in arterial stiffness and thickness.37Smooth mus-cle cell proliferation, and deterioration of elastin may also result in arterial wall remodeling.38
Relatively large sample size, community-based popula-tion, and thefirst attempt to show the modification of blood glucose levels when higher blood pressure level increases arterial stiffness are strengths of this study. However, several limitations should be noted. The limitation of our analysis is its cross-sectional design. We can onlyfind the correlations between variables by regression analysis. More research is needed to reveal the cause–effect relationship. In our work, to avoid excessive collinearity that may make the models robust, we adjusted for some important confounding factors which could increase the arterial stiffness. But we did not control for the phase of the menstrual cycle in premenopausal women, this causes variations in blood pressure and vascular function. And we did not control for caffeine, alcohol con-sumption or any unaccustomed physical activity 24-h before each visit. This plays a role in vascular function.
Conclusion
In conclusion, the participants with increased arterial stiff-ness demonstrated a high prevalence of higher blood glu-cose, which was independently associated with baPWV. When blood pressure levels co-occurred with blood glu-cose levels, there was a remarkable increase in baPWV. The findings in our study raised the possibility of the modification of blood glucose levels when higher blood pressure level increases arterial stiffness that, if confirmed in future studies, may have important public health impli-cations for the prevention of arterial stiffness.
Abbreviation list
baPWV, brachial-ankle pulse wave velocity; T2DM, dia-betes mellitus type 2; BP, blood pressure; ABI, ankle-brachial index; PWV, pulse wave velocity; SBP, systolic blood pressure; DBP, diastolic blood pressure; FBG, fasting blood glucose; 2-h PG, 2-hr post-load glucose; BMI, Body mass index; DM, diabetes mellitus; TC, total cholesterol; HDL-C/HDL, high-density lipoprotein cholesterol; TG, total triglycerides; WHR, waist-to-hip ratio; AGEs, advanced glycation end products; PP, pulse pressure.
Diabetes, Metabolic Syndrome and Obesity: Targets and Therapy downloaded from https://www.dovepress.com/ by 118.70.13.36 on 21-Aug-2020
Ethics approval and consent to
participate
The study protocol was approved by the ethics committee of Peking University First Hospital. The research was conducted according to the World Medical Association Declaration of Helsinki. The adolescents who participated in this study agreed in writing to participate and their legal guardians signed an informed consent form.
Availability of data and materials
The data that support thefindings of this study are available from Peking University First Hospital, but restrictions apply to the availability of these data, which were used under license for the current study, and so are not publicly available. Data are however available from the authors upon reasonable request and with permission of Peking University First Hospital.
Acknowledgments
We really appreciate the staff of Gucheng and Pingguoyuan Community Health Centers and their research coordinators who participated in this survey and thank them for their assistance in data acquisition.
The study was supported by grants from the National Natural Science Foundation of China (81172768, 81872692), Beijing Municipal Natural Science Foundation (7182085) and the UM-PUHSC Joint Institute for Translational and Clinical Research (BMU20110177).
Author contributions
X Dai wrote the manuscript. Z Liu performed the statistical analyses. D Chen and Y Zhang revised the paper. All authors contributed towards data analysis, drafting and critically revis-ing the paper, gavefinal approval of the version to be pub-lished, and agreed to be accountable for all aspects of the work.
Disclosure
The authors declare that they have no competing interests in this work.
References
1. Roth GA, Johnson C, Abajobir A. Global, regional, and national burden of cardiovascular diseases for 10 causes, 1990 to 2015.J Am Coll Cardiol.2017;70(1):1–25. doi:10.1016/j.jacc.2017.04.052 2. Cui R, Yamagishi K, Muraki I. Investigators. C. Association between
markers of arterial stiffness and atrialfibrillation in the circulatory risk in communities study (CIRCS). Atherosclerosis. 2017;263:244–248. doi:10.1016/j.atherosclerosis.2017.06.918
3. Ohyama Y, Ambale-Venkatesh B, Noda C. Aortic arch pulse wave velocity assessed by magnetic resonance imaging as a predictor of incident cardiovascular events: the MESA (Multi-ethnic study of atherosclerosis). Hypertension. 2017;70:524–530. doi:10.1161/ HYPERTENSIONAHA.116.08749
4. Cavalcante JL, Lima JA, Redheuil A, Al-Mallah MH. Aortic stiff-ness: current understanding and future directions.J Am Coll Cardiol.
2011;57(14):1511–1522. doi:10.1016/j.jacc.2010.12.017
5. Scuteri A, Rovella V, Alunni FD, Tesauro M, Gabriele M, Di Daniele N. An operational definition of SHATS (Systemic hemody-namic atherosclerotic syndrome): role of arterial stiffness and blood pressure variability in elderly hypertensive subjects. Int J Cardiol.
2018;263:132–137. doi:10.1016/j.ijcard.2018.03.117
6. Scuteri A, Tesauro M, Guglini L, Lauro D, Fini M, Di Daniele N. Aortic stiffness and hypotension episodes are associated with impaired cognitive function in older subjects with subjective com-plaints of memory loss. Int J Cardiol. 2013;169(5):371–377. doi:10.1016/j.ijcard.2013.09.009
7. Scuteri A, Wang H. Pulse wave velocity as a marker of cognitive impairment in the elderly.J Alzheimers Dis.2014;42(Suppl 4):S401– S410. doi:10.3233/JAD-141416
8. Prenner SB, Chirinos JA. Arterial stiffness in diabetes mellitus. Atherosclerosis. 2015;238(2):370–379. doi:10.1016/j.atheroscleros is.2014.12.023
9. Xu M, Huang Y, Xie L, et al. Diabetes and risk of arterial stiffness: a mendelian randomization analysis.Diabetes.2016;65(6):1731–1740. doi:10.2337/db15-1533
10. Scuteri A, Morrell CH, Orru M, et al. Longitudinal perspective on the conundrum of central arterial stiffness, blood pressure, and aging. Hypertension. 2014;64(6):1219–1227. doi:10.1161/ HYPERTENSIONAHA.114.04127
11. Farasat SM, Morrell CH, Scuteri A, et al. Pulse pressure is inversely related to aortic root diameter implications for the pathogenesis of systolic hypertension. Hypertension. 2008;51(2):196–202. doi:10.1161/HYPERTENSIONAHA.107.099515
12. Sugawara J, Tanaka H. Brachial-ankle pulse wave velocity: myths, misconceptions, and realities. Pulse (Basel). 2015;3(2):106–113. doi:10.1159/000430771
13. Fan F, Qi L, Jia J, et al. Noninvasive central systolic blood pressure is more strongly related to kidney function decline than peripheral systolic blood pressure in a Chinese community-based population. Hypertension. 2016;67(6):1166–1172. doi:10.1161/HYPERTEN SIONAHA.115.07019
14. Paik JK, Kim M, Kwak JH, Lee EK, Lee SH, Lee JH. Increased arterial stiffness in subjects with impaired fasting glucose. J Diabetes Complications. 2013;27(3):224–228. doi:10.1016/j. jdiacomp.2012.10.012
15. Shin JY, Lee HR, Lee DC. Increased arterial stiffness in healthy subjects with high-normal glucose levels and in subjects with pre-diabetes. Cardiovasc Diabetol.2011;10:30. doi:10.1186/1475-2840-10-30 16. Rahman S, Ismail AA, Ismail SB, Naing NN, Rahman AR. Early
manifestation of macrovasculopathy in newly diagnosed never treated type II diabetic patients with no traditional CVD risk factors.Diabetes Res Clin Pract.2008;80(2):253–258. doi:10.1016/j.diabres.2007.12.010 17. Scuteri A, Tesauro M, Rizza S, et al. Endothelial function and arterial stiffness in normotensive normoglycemic first-degree relatives of diabetic patients are independent of the metabolic syndrome.Nutr Metab Cardiovasc Dis. 2008;18(5):349–356. doi:10.1016/j. numecd.2007.03.008
18. Scuteri A, Stuehlinger MC, Cooke JP, et al. Nitric oxide inhibition as a mechanism for blood pressure increase during salt loading in normotensive postmenopausal women. J Hypertens. 2003;21 (7):1339–1346. doi:10.1097/01.hjh.0000059082.43904.02
19. Sell DR, Monnier VM. Molecular basis of arterial stiffening: role of glycation - a mini-review. Gerontology. 2012;58(3):227–237. doi:10.1159/000334668
Diabetes, Metabolic Syndrome and Obesity: Targets and Therapy downloaded from https://www.dovepress.com/ by 118.70.13.36 on 21-Aug-2020
20. Kilhovd BK, Juutilainen A, Lehto S, et al. Increased serum levels of advanced glycation endproducts predict total, cardiovascular and
coronary mortality in women with type 2 diabetes: a
population-based 18 year follow-up study. Diabetologia. 2007;50 (7):1409–1417. doi:10.1007/s00125-007-0687-z
21. Nin JW, Jorsal A, Ferreira I, et al. Higher plasma levels of advanced glycation end products are associated with incident cardiovascular dis-ease and all-cause mortality in type 1 diabetes: a 12-year follow-up study.Diabetes Care.2011;34(2):442–447. doi:10.2337/dc10-1087 22. Du X, Edelstein D, Obici S, Higham N, Zou MH, Brownlee M.
Insulin resistance reduces arterial prostacyclin synthase and eNOS activities by increasing endothelial fatty acid oxidation.J Clin Invest.
2006;116(4):1071–1080. doi:10.1172/JCI23354
23. Paneni F, Beckman JA, Creager MA, Cosentino F. Diabetes and vascular disease: pathophysiology, clinical consequences, and medi-cal therapy: part I. Eur Heart J. 2013;34(31):2436–2443. doi:10.1093/eurheartj/eht149
24. Brillante DG, O’Sullivan AJ, Howes LG. Arterial stiffness in insulin resistance: the role of nitric oxide and angiotensin II receptors.Vasc Health Risk Manag.2009;5(1):73–78.
25. AlGhatrif M, Strait JB, Morrell CH, et al. Longitudinal trajectories of arterial stiffness and the role of blood pressure: the Baltimore long-itudinal study of aging. Hypertension. 2013;62(5):934–941. doi:10.1161/HYPERTENSIONAHA.113.01445
26. Lim J, Pearman ME, Park W, Alkatan M, Machin DR, Tanaka H. Impact of blood pressure perturbations on arterial stiffness. Am J Physiol Regul Integr Comp Physiol.2015;309(12):R1540–R1545. doi:10.1152/ajpregu.00368.2015
27. Najjar SS, Scuteri A, Shetty V, et al. Pulse wave velocity is an independent predictor of the longitudinal increase in systolic blood pressure and of incident hypertension in the Baltimore longitudinal study of aging. J Am Coll Cardiol. 2008;51(14):1377–1383. doi:10.1016/j.jacc.2007.10.065
28. Kaess BM, Rong J, Larson MG, et al. Aortic stiffness, blood pressure progression, and incident hypertension.Jama.2012;308(9):875–881. doi:10.1001/2012.jama.10503
29. Nigam A, Mitchell GF, Lambert J, Tardif JC. Relation between conduit vessel stiffness (assessed by tonometry) and endothelial function (assessed byflow-mediated dilatation) in patients with and without coronary heart disease.Am J Cardiol.2003;92(4):395–399. 30. Scuteri A, Chen CH, Yin FC, Chih-Tai T, Spurgeon HA, Lakatta EG.
Functional correlates of central arterial geometric phenotypes. Hypertension.2001;38(6):1471–1475.
31. Vulliemoz S, Stergiopulos N, Meuli R. Estimation of local aortic
elastic properties with MRI. Magn Reson Med. 2002;47
(4):649–654.
32. Scuteri A, Morrell CH, Orru’M, et al. Gender specific profiles of white coat and masked hypertension impacts on arterial structure and function in the SardiNIA study. Int J Cardiol. 2016;217:92–98. doi:10.1016/j.ijcard.2016.04.172
33. Di Daniele N, Fegatelli DA, Rovella V, Castagnola V, Gabriele M, Scuteri A. Circadian blood pressure patterns and blood pressure control in patients with chronic kidney disease. Atherosclerosis.
2017;267:139–145. doi:10.1016/j.atherosclerosis.2017.10.031 34. Galis ZS, Thrasher T, Reid DM, Stanley DV, Oh YS. Investing in
high blood pressure research: a national institutes of health perspective. Hypertension. 2013;61(4):757–761. doi:10.1161/ HYPERTENSIONAHA.111.00770
35. Ma L, Zhao S, Li J, Zhou Q, Gao M. Interaction of hypertension and diabetes on impairment of endothelial function.Chin Med J (Engl).
2001;114(6):563–567.
36. Tsao PS, Niebauer J, Buitrago R, et al. Interaction of diabetes and hypertension on determinants of endothelial adhesiveness. Arterioscler Thromb Vasc Biol.1998;18(6):947–953.
37. Scuteri A, Orru M, Morrell C, et al. Independent and additive effects of cytokine patterns and the metabolic syndrome on arterial aging in the SardiNIA study. Atherosclerosis. 2011;215(2):459–464. doi:10.1016/j.atherosclerosis.2010.12.023
38. Ganguly P, Alam SF. Role of homocysteine in the development of cardiovascular disease. Nutr J. 2015;14:6. doi:10.1186/1475-2891-14-6
Diabetes, Metabolic Syndrome and Obesity: Targets and Therapy downloaded from https://www.dovepress.com/ by 118.70.13.36 on 21-Aug-2020
Supplementary materials
Table S3Interaction of blood pressure levels, blood glucose levels on baPWV
Blood pressure levels Blood glucose levels Unadjusted Model Adjusted Model
B(95%CI) P B(95%CI) P
Optimal BP Normal glucose Ref Ref
Optimal BP Prediabetes 42.12(7.32,76.92) 0.018 5.96(−24.92,36.84) 0.705 Optimal BP Diabetes 148.61(96.54,200.68) <0.001 72.58(24.96,120.21) 0.003 Prehypertension Normal glucose 167.01(140.37,193.65) <0.001 111.01(87.14,134.89) <0.001 Prehypertension Prediabetes 222.48(194.76,250.19) <0.001 143.84(118.58,169.10) <0.001 Prehypertension Diabetes 312.29(278.38,346.20) <0.001 202.36(170.02,234.70) <0.001 Hypertension Normal glucose 353.49(325.30,381.69) <0.001 287.95(260.16,315.73) <0.001 Hypertension Prediabetes 476.12(449.94,502.31) <0.001 362.76(335.50,390.02) <0.001 Hypertension Diabetes 543(515.37,570.64) <0.001 403.24(372.43,434.05) <0.001 Interaction 21.15(8.79,33.51) <0.001 19.71(8.68,30.73) <0.001 Abbreviation:baPWV, brachial-ankle pulse wave velocity.
Table S2The effect of blood glucose levels on the risk of baPWV by different blood pressure level
Blood glucose levels Optimal BP Prehypertension Hypertension
B(95%CI) P B(95%CI) P B(95%CI) P
Unadjusted model
Normal glucose Ref Ref Ref
Prediabetes 42.12(19.83,64.40) 0.002 55.46(33.96,76.97) <0.001 122.63(91.79,153.47) <0.001 Diabetes 148.61(115.27,181.95) <0.001 145.28(118.08,172.48) <0.001 189.51(156.85,222.17) <0.001 Adjusted model
Normal glucose Ref Ref Ref
Prediabetes 7.55(−12.30,27.41) 0.459 33.42(14.38,52.46) <0.001 69.6(41.85,97.35) <0.001 Diabetes 53.48(16.13,90.83) 0.005 90.86(62.57,119.15) <0.001 110.16(76.45,143.88) <0.001 Abbreviations:baPWV, brachial-ankle pulse wave velocity; BP, blood pressure.
Table S1The effect of blood pressure levels, blood glucose levels on the risk of baPWV
Variables Crude model Adjusted model
B(95%CI) P B(95%CI) P
Blood pressure levels
Optimal BP Ref Ref
Prehypertension 184.65(164.88,204.41) <0.001 120.34(102.74,137.93) <0.001 Hypertension 433.01(413.86,452.16) <0.001 320.35(299.01,341.69) <0.001 Blood glucose levels
Normal glucose Ref Ref
Prediabetes 135.72(118.31,153.13) <0.001 43.62(29.33,57.90) <0.001 Diabetes 260.78(240.55,281.01) <0.001 95.58(75.85,115.32) <0.001 Abbreviation:baPWV, brachial-ankle pulse wave velocity.
Diabetes, Metabolic Syndrome and Obesity: Targets and Therapy downloaded from https://www.dovepress.com/ by 118.70.13.36 on 21-Aug-2020
Diabetes, Metabolic Syndrome and Obesity: Targets and Therapy
Dove
press
Publish your work in this journal
Diabetes, Metabolic Syndrome and Obesity: Targets and Therapy is an international, peer-reviewed open-access journal committed to the rapid publication of the latest laboratory and clinicalfindings in the
fields of diabetes, metabolic syndrome and obesity research. Original research, review, case reports, hypothesis formation, expert opinion
and commentaries are all considered for publication. The manu-script management system is completely online and includes a very quick and fair peer-review system, which is all easy to use. Visit http://www.dovepress.com/testimonials.php to read real quotes from published authors.
Submit your manuscript here:https://www.dovepress.com/diabetes-metabolic-syndrome-and-obesity-targets-and-therapy-journal
Table S4Interaction of physical exercise and the combined variable of blood pressure levels and blood glucose levels on baPWV
Blood pressure levels Blood glucose levels Inactive participants B(95%CI)
Sedentary participants B(95%CI)
Optimal BP Normal glucose Ref Ref
Optimal BP Prediabetes 13.69(−30.82,58.19) 0.31(−41.05,41.66)
Optimal BP Diabetes 49.67(−21.73,121.06) 82.35(20.06,144.64)
Prehypertension Normal glucose 113.53(79.10,147.95) 108.90(76.87,140.92) Prehypertension Prediabetes 139.80(173.56,275.59) 145.58(111.92,179.25) Prehypertension Diabetes 224.58(219.96,302.99) 193.12(151.61,234.62) Hypertension Normal glucose 261.47(281.07,365.38) 300.47(263.91,337.03) Hypertension Prediabetes 323.23(301.72,344.73) 377.40(342.01,412.80) Hypertension Diabetes 380.57(331.54,429.61) 410.17(370.66,449.69)
Pfor Interaction 0.083
Abbreviations:baPWV, brachial-ankle pulse wave velocity; BP, blood pressure.
Diabetes, Metabolic Syndrome and Obesity: Targets and Therapy downloaded from https://www.dovepress.com/ by 118.70.13.36 on 21-Aug-2020