489 |
P a g e
Islanding Detection in Microgrid Based on Impedance
Insertion
Vishal Pawar
1, Dr. Anoop Arya
2, Dr. Mukesh Kumar Kirar
31,2,3
M. Tech. Student, Electrical Engineering Department, MANIT Bhopal, (India)
ABSTRACT
In the present day there is anincreasing demand of the energy. To meet this demand renewable technology e.g. solar PV, wind, tidal, fuel cell etc. is coming into the picture and we are using this technology with the grid connected mode to increase the reliability and efficiency. As we are using this technology in the grid connected mode there are several parameter to be considered for secure operation of this microgrid. One of this is islanding of the renewable sources to the main grid. This paper present a novel islanding detection based on the impedance insertion. This method uses the concept of current measurement. This used method has several advantages over the other method and small Non Detection Zone (NDZ).
Keywords
-
Microgrid, NDZ, Islanding, Current measurement, Impedance insertion.
I. INTRODUCTION
As we know at present there is very high demand of the electricity. Besides very hard effort there is no access to electricity to every person of the nation. Our per capita consumption is very less when compared with the other countries per capita consumption. Also if we use the conventional method to increase the installing capacity of the power there will be increased concern over the environment issue. Thus we required to meet the demand without these drawbacks. So at present we are working on the high penetration of the renewable technologies in the power system. Thus this sources are increasing the reliability and the continuity of the power supply to the consumer as we are using this sources with the connection to the grid. This connection of the renewable resources to the grid is called the microgrid. These renewable sources are environment friendly and does not cause any harmful effect to the environment [1], [2]. As we are using this renewable sources in the grid connecting mode there are several technological issue to be considered forfrequency, voltage, power angle, power flow etc.
490 |
P a g e
the set threshold to detect the islanding. Remote method is based on the detection of the states of the breakers to detect the islanding in the power system. The remote method has several advantages over the other method e.g. it has no issue of the NDZ ( Non-Detection Zone ), no effect over the power quality as it does not insert the perturbation in the system to detect the islanding. Overall this method is very much effective over the other two counterpart but this method is costly to use for the small system [4].
II. PROPOSED METHOD
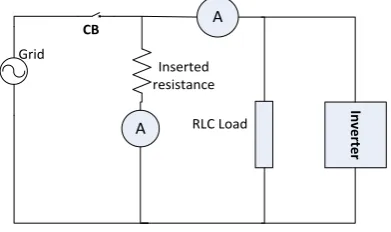
Basic proposed islanding detection circuit is shown in the below figure. At the one side the AC source represent the supply from the grid and other side the inverter output shows the DC to AC conversion from distributed sources like solar, wind etc. In case any fault occur toward the grid side than circuit breaker connected to the main grid opens in that condition main grid is disconnected from the microgrid and supply to the load only by the microgrid DERs. Prior to the circuit breaker opening the current in the both ammeter remains different but after the breaker opening the current in the inserted resistance branch becomes equal to the ammeter 1 i.e. both the current measured by the ammeter becomes equal [5].
Fig. 1 proposed islanding detection circuitry
Thus this method of the islanding detection is a passive method based on the current measurement and its comparison in case of the islanding. The proposed method has the following advantages [5]:
The impedance every time remain connected to the system, so other auxiliary like extra switches and other equipment are not necessary thus time delays are avoided. Thus this proposed islanding Detection Method is simple, fast and accurate.
The value of the inserted impedance are very large, so energy losses remains very less due to very low current flowing in the inserted resistance.
There are not any unwanted distortions and perturbations injected into the system or any equipment sensitive to perturbations.
The current measured by the high value of resistance acts as an indicator of the operating status of the microgrid whether it is connected or disconnected, thus this method is free from any communication overheads.
This method does not disturb the power quality of the remaining system and its effectiveness remain as it is, whatever be the mode in which inverter is operating, i.e. current Control or voltage Control mode (CC or VC).
It does not depend from operation of number of inverters in the MG and it gives satisfactory NDZ.
A
A
In
ve
rt
er
Grid
Inserted resistance
RLC Load
491 |
P a g e
This paper develops a model for the DC link with the help of the solar and wind power which is synchronized with the grid and islanding detection circuitry is used to detect the islanding condition in case of the fault toward the grid side. The simulation studied is performed on the MATLAB/ Simulink R2013a software.
III.SYSTEM DESCRIPTION
The system consist of the model of the solar panel and the wind turbine to form the DC link of the. To simulate the solar panel model, the basic equation of the single diode model of the solar panel is used. The following equivalent circuit of the solar panel is used to simulate the characteristics of the solar panel.
Iph
Rsh
Rse I
Fig. 2 single diode model of the solar panel [6]
In the figure shown below the general solar model consist of the photo current, a diode, a parallel resistance to express the leakage current and a series resistance shows the internal resistance to the current flow. The description of the basic equation of the modelling is shown below which satisfy all the characteristics of the solar panel [6] [7].
The solar panel V-I characteristic is given by the following equation [8]:
Where photocurrent of the solar cell, = saturation current of the solar cell, K= voltazman constant= 1.68×10^-23 J/K, q=1.6×10^-19 C, A= ideality factor of the cell, Rs= Series resistance, = shunt resistance, Tc= cell working temperature.
The photo current of the solar cell mainly depends on the insolation and the cell‟s working temperature is given by:
Where S= solar cell‟s insolation in KW/m^2, = cell‟s short circuit current temperature coefficient, = cell‟s reference temperature, = cell‟s short circuit current at 25˚C and 1 kW/m^2 insolation
492 |
P a g e
= cell‟s reverse saturation current at the reference temperature and the solar irradiance, Eg= band gap energy of the material used in the solar cell.
For an ideal PV cell, there is no series loss and there is no leakage current that means Rs=0, Rsh=∞, so V-I characteristic of the cell becomes
Since a general PV cell generates less than 2W at 0.5V approximately, the cells should be connected in series-parallel configuration on a big panel to produce high power. A PV array is a set of several PV modules which are electrically connected in form of series and parallel circuits to produce the required amount of current and voltage. If Np= number of cells in parallel & Ns= number of cells in series, then the equation of voltage and of the PV array becomes,
Using the above equations, the solar panel model is built in the Matlab/Simulink software which is used to simulate the generalized characteristics of the solar PV system as like as real physical panel. As we know that there will be maximum efficiency we will get from the solar panel if we operate this at the maximum power point so we required to operate the solar panel with the maximum power point technique [10]. So we are using the well-known perturb and observe method for the MPPT. MPPT output pulse is used to generate the switching pulse for the boost converter switching device [11].
As we know that the output voltage from the solar panel is very less so we required to boost the solar panel voltage with the help of the boost converter. The basic model with the design equation of the boost converter is shown below [12]:
DC
Cin
Sw
Cout
L
Vin
Vout
Fig. 3 basic circuit of the boost converter [13]
The design formula used for the boost converter is design is given below [13]: Duty cycle of the switching pulse is given by,
493 |
P a g e
Where is the inductor current ripple and is the maximum inductor current of the boost converter.
Where L is the inductor value calculations whichshould be inserted in the power stage of the boost converter and is the switching frequency of the semiconductor device used to make the boost converter.
Value for the output side capacitor which is used in the boost converter to increase voltage is given by the following formula:
is the maximum output current necessary in the application and is the desired output voltage ripple in the output stage of the boost converter.
These are the design parameter which is used to calculate the inductor and the capacitor value selection in the boost converter power stage. The input capacitor value is calculated by the provided datasheet of the design of the boost converter power stage. The solar PV we have taken to give the 500W output power. There are following value is taken to design the inductor and capacitor of the boost converter:
Voc= 66 V, Vm= 54.2 V, Isc= 25.44 A, Im= 23.25 A and fs= 5 KHz Following values we have obtained for the design of the boost converter:
D= 0.9 L= 0.1 H C= 0.02 F
For calculating the values of the filter we have taken1% ripple in the inductor current. The figure 4 shows the Simulink model for the solar panel used in our system.This panel consist of the MPPT algorithm based on the perturb and observe method. The switching pulse generated from the MPPT is used to switch the semiconductor device used in the boost converter to track the maximum power for the system. The design is based on the values which we have found from the above discussed parameter. The boost converter with the required parameter i.e. duty cycle, inductor and capacitor is employed to boost the voltage from the solar panel.
494 |
P a g e
We have used the Permanent Magnet Synchronous Generator (PMSG) to generate the electricity from the wind power. The wind turbine rotates the PMSG to generate the electricity from the wind power [15]. But the output voltage from the wind generator is AC in nature which required to be converted into DC for connecting it to the DC link therefore the output AC voltage of the wind generator is converted to DC with the help of VSC. The specifications of the wind turbine used in our model is given below:
Table 1: Wind turbine specifications
Parameters Values
Nominal mechanical output power
1.5 KW
Base wind speed 12 m/s Pitch angle 45 Power factor 0.9
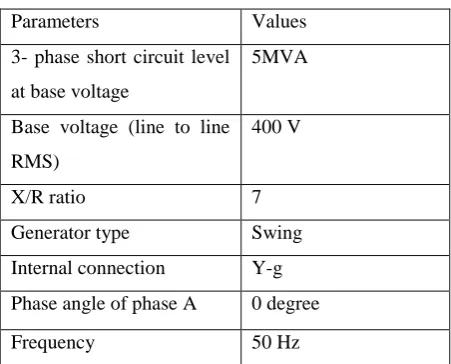
The output power from the wind turbine is used to rotate the PMSG generator which generate the electricity at required frequency and voltage. The generated voltage is AC in nature so we use the VSC to convert this to DC at 420V. Now the DC from the dc link is converted to AC by using the SPWM inverter for synchronizing with the grid voltage magnitude and frequency. There are following parameter we have taken of the connected generator toward the grid side:
Table 2: Parameter for connected generator
Parameters Values 3- phase short circuit level
at base voltage
5MVA
Base voltage (line to line RMS)
400 V
X/R ratio 7 Generator type Swing Internal connection Y-g Phase angle of phase A 0 degree Frequency 50 Hz
495 |
P a g e
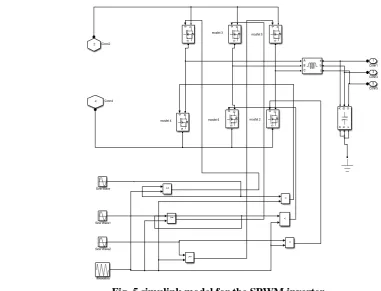
Fig. 5 simulink model for the SPWM inverter
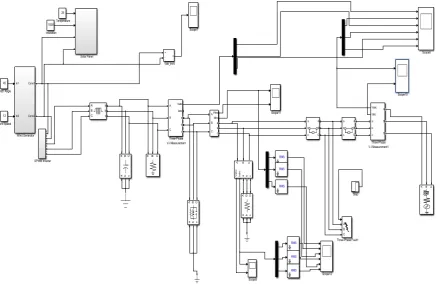
The Simulink model based on the islanding detection circuitry is shown in the figure 1 which is supplied by the inverter side and from the generator side is shown below. In which the value of the inserted resistance is 735Ω and the values of the RLC load is R= 3.28KΩ, L= 10.45 H and C= 0.968µF. the fault is applied on the phase A toward the grid side at t= 2 sec. The RMS current measurement is also done toward the inverter side and in the inserted resistance for comparison of the current to detect the islanding. This is done by inserting the RMS current measurement block of the Simulink in all the three phases at the inverter side of the grid and in the inserted resistance for islanding detection. Both the breaker toward the grid side is inserted to isolate the fault from the healthy microgrid side and isolate the generator from supplying the fault. This simulation model has been made on the MATLAB Simulink software R2013a to detect the islanding.
496 |
P a g e
Now all the system are combined to show the islanding phenomenon in the system and its detection through the proposed method.
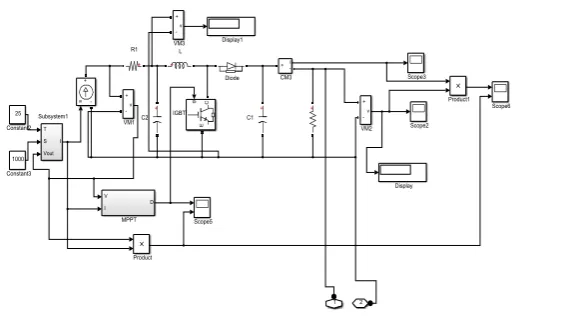
Fig. 7 simulink model for the islanding detection in the proposed microgrid
In the above model the subsystem consist of the solar panel model, wind generator model and the SPWM inverter as discussed is the above sections. The output of the solar is connected to the DC link and the output from the wind turbine is connected first to the VSC which is converted to the DC then connected to the DC link. Now the DC voltage is converter to the AC of proper frequency and voltage with the help of the SPWM inverter for synchronization to the grid. The islanding detection circuitry is connected between the grid side and the inverter side to detect the islanding phenomenon in the system.
IV. SIMULATION RESULTS
497 |
P a g e
0 0.5 1 1.5 2 2.5 3 3.5 4 4.5 5
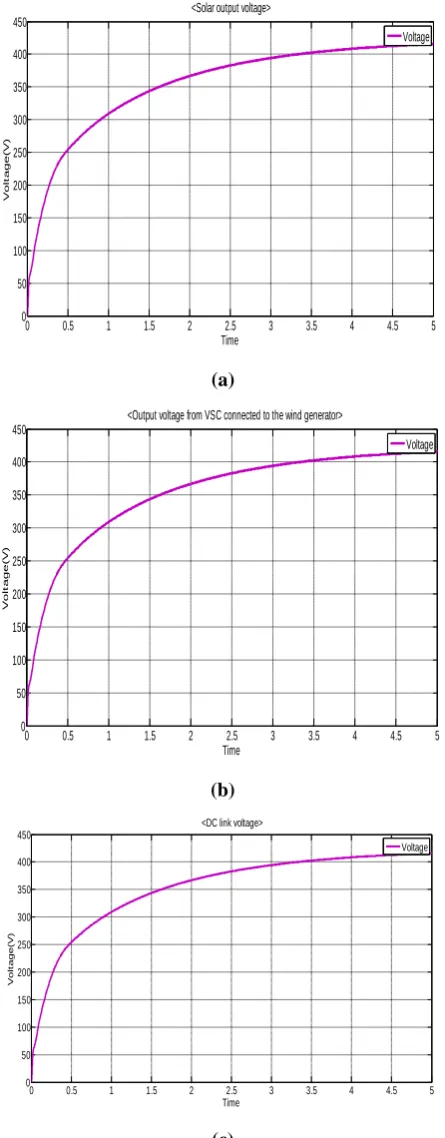
0 50 100 150 200 250 300 350 400 450 Time V o lt a g e ( V )
<Solar output voltage>
Voltage
(a)
0 0.5 1 1.5 2 2.5 3 3.5 4 4.5 5
0 50 100 150 200 250 300 350 400 450 Time V o lt a g e ( V )
<Output voltage from VSC connected to the wind generator>
Voltage
(b)
0 0.5 1 1.5 2 2.5 3 3.5 4 4.5 5
0 50 100 150 200 250 300 350 400 450 Time V o lt a g e ( V )
<DC link voltage>
Voltage
(c)
Fig. 8 (a) output voltage from the solar panel (b) output voltage from the VSC connected to wind
generator (c) DC link voltage
498 |
P a g e
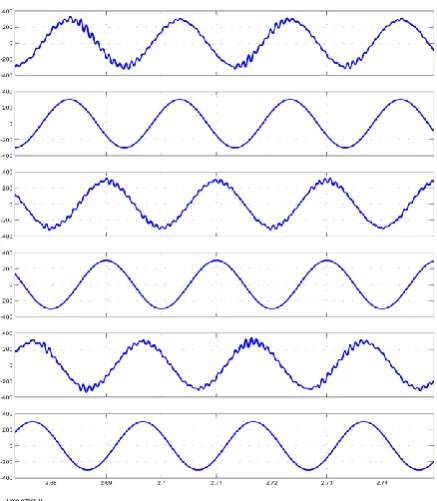
Fig.9 output voltage waveform at the inverter side and connected grid
In the above figure which contains the harmonics is the output waveform at the inverter side and the waveform which is pure sinusoidal is from grid side. Both the waveform is synchronized.
Now at t= 2 sec, a line to ground fault occur in the phase „A‟ at the grid side so the current in the phase „A‟ overshoot to its normal value at t=2 sec. This phenomenon has been shown in the figure 10 in which the current waveform of phase „A‟ i.e. Ia is increased beyond its normal value at time t= 2 sec. but the current in the other two phases remain in the normal limit. At t= 3 sec grid side breaker is operated thus current in phase „B‟ and phase „C‟ becomes zero but the fault is supplied by the generator as generator side breaker is not operated thus fault current remain as it is as the previous one. To isolate the fault in the phase „A‟ of the grid side at t= 4 sec the generator side breaker is operated and the fault current becomes zero at t= 4 sec. The current and the voltage waveform toward the grid side in high resolution is shown in the below figure:
2 2.2 2.4 2.6 2.8 3 3.2 3.4 3.6 3.8 4
-0.5 -0.4 -0.3 -0.2
-0.10
0.1 0.2 0.3 0.4 0.5
Time
cu
rr
e
n
t
(A
)
< High resolution current and voltage at grid side>
2 2.5 3 3.5 4
-500 -400 -300 -200
-1000
100 200 300 400 500
Time
vo
lt
a
g
e
(
V
)
Va Vb Vc Ia Ib Ic
499 |
P a g e
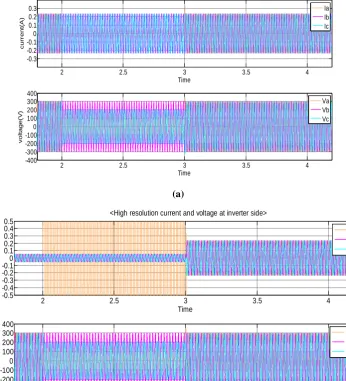
Before t= 3 second as both microgrid as well as grid connected in the system, the inverter side current will be different from the current in the inserted resistance. This shows that there is no islanding occur in the system but after t= 3 sec as the grid is isolated from the microgrid because of the breaker operation, the current in the inserted resistance becomes equal to the current toward the inverter side. This shows the islanding phenomenon in the system. The waveform for the islanding phenomenon is shown in the figure 11. Thus this is a passive method based on the current comparison of current in inserted resistance and inverter side.Thewaveform shown in figure 11 (a) is the current and voltage in the inserted resistance and the waveform in the figure 11 (b)is the current and voltage toward the inverter side in the high resolution.
2 2.5 3 3.5 4
-0.3 -0.2 -0.1 0 0.1 0.2 0.3 Time cu rr e n t( A )
<High resolution current and voltage at inserted resistance>
2 2.5 3 3.5 4
-400 -300 -200 -100 0 100 200 300 400 Time vo lt a g e (V ) Ia Ib Ic Va Vb Vc (a)
2 2.5 3 3.5 4
-0.5 -0.4 -0.3 -0.2 -0.10 0.1 0.2 0.3 0.4 0.5 Time cu rr e n t( A )
<High resolution current and voltage at inverter side>
2 2.5 3 3.5 4
-400 -300 -200 -100 0 100 200 300 400 Time vo lt a g e (V ) Ia Ib Ic Va Vb Vc (b)
Fig. 11 (a) current and the voltage waveform in the inserted resistance to detect the islanding (b) current
and voltage waveform toward the inverter side
500 |
P a g e
phenomenon shows that the islanding in the system has occurred at t= 3 sec. This can be shown with the help of the RMS values of the current more transparently. The waveforms for the RMS values of the current is shown below:
0 1 2 3 4 5 6 7 8 9 10
0 0.1 0.2 I i n v ( A ) ffggmail
0 1 2 3 4 5 6 7 8 9 10
0 0.1 0.2 I r e s ( A )
0 1 2 3 4 5 6 7 8 9 10
0 0.1 0.2 I i n v ( B )
0 1 2 3 4 5 6 7 8 9 10
0 0.1 0.2 I r e s ( B )
0 1 2 3 4 5 6 7 8 9 10
0 0.1 0.2 I i n v ( C )
0 1 2 3 4 5 6 7 8 9 10
0 0.1 0.2 Time I r e s ( C )
High resolution inverter and inserted resistance RMS current waveform
Fig. 12high resolution current waveforms in the phases A, B and C at the inverter side and in the inserted
resistance respectively
The above waveform easily explains the islanding phenomenon in the system. Before t= 3 sec there is a difference in the current at the inverter side and current in the inserted resistance because there is no islanding phenomenon occur in the system. But after t= 3 sec the both the current magnitude becomes equal which shows the islanding operation in the system. Thus this is a very simple method based on the current measurement to detect the islanding operation in the system. This method is able to detect the islanding operation without any delay as there is no use of any extra switches or any auxiliary in the islanding detection circuitry in system.
V. CONCLUSION AND FUTURE SCOPE
As this method is based on the current measurement and this is a passive method, this is very fast, simple and accurate method. Also this method have no issue of NDZ (Non Detection Zone). This method do not introduce the perturbation in the system unlike other detection method so this method is free from the power quality distortion in the system. This method also do not disturb by the overhead communication line. Thus overall this method is novel and have many advantages over other islanding detection methods to detect the islanding operation in the system.
501 |
P a g e
REFERENCES
[1] Ramon Zamora, Anurag K. Srivastava, “Controls for microgrids with storage: Review, challenges, and research needs”, Renewable and Sustainable Energy Reviews vol. 14, 2010 pp.2009–2018.
[2] R. Majumder, "Some Aspects of Stability in Microgrids," in IEEE Transactions on Power Systems, vol. 28, no. 3, pp. 3243-3252, Aug. 2013.
[3] Walling.A.R.; Miller.W.N.; “Distributed generation islanding implications on power system dynamic performance,” in IEEE Power Engineering Society Summer Meeting, vol.1, no., pp. 92-96, 2002
[4] P.Mahat, Z.Chen and B. Bak-Jensen, “Review of Islanding Detectionmethods for distributed generation,” Third International conference on electric utility deregulation and restructuring and powertechnologies 2008, DRPT2008, pp.2743-8, 6-9 April 2008.
[5] Papadimitriou CN, Kleftakis VA, Hatziargyriou ND. A novel islanding detection method for microgrids based on variable impedance insertion. Electric Power Systems Research. 2015 Apr 30;121:58-66.
[6] Saroja K. Sahoo, A. K. Sinha, N. K. Kishore “Modeling and Real-time Simulation of an AC Microgrid with Solar Photovoltaic System” IEEE INDICON 2015.
[7] Zhang YX, Zhao J, Deng ZY. “Modeling and simulation of photovoltaic grid-connected power system”. Gaodianya Jishu/ High Voltage Engineering. 2010 Dec; 36(12):3097-102.
[8] Abhinav Tripathi and Kishan Bhushan Saha, “Modeling & Simulation of Proposed Grid Connected 10 MW Solar PV Array Power Plant at Lucknow” 1 st IEEE International Conference on Power Electronics, Intelligent Control and Energy Systems (ICPEICES-2016).
[9] FahadRasool, MichealDrieberg, NasreenBadruddin and Balbir Singh Mahinder Singh, “Modeling of PV Panels Performance Based on Datasheet Values for Solar Micro Energy Harvesting” 978-1-5090-0845-2/2016 IEEE.
[10]Ranjan, Kshitijaa, and Narendra Kumar. "Modelling and simulation of Perturb and Observe algorithm on solar PV system using different converters in MATLAB/SIMULINK." Power Electronics, Intelligent Control and Energy Systems (ICPEICES), IEEE International Conference on. IEEE, 2016.
[11]Nedumgatt, Jacob James, et al. "Perturb and observe MPPT algorithm for solar PV systems-modeling and simulation." India Conference (INDICON), 2011 Annual IEEE. IEEE, 2011.
[12]Hasaneen, B. M., and Adel A. Elbaset Mohammed. "Design and simulation of DC/DC boost converter." Power System Conference, 2008. MEPCON 2008. 12th International Middle-East. IEEE, 2008.
[13]Texas Instrument application report, “Basic calculation of the power stage of the boost converter” January 2014. [14]Zhao, Qun, and Fred C. Lee. "High-efficiency, high step-up DC-DC converters." IEEE Transactions on Power
Electronics 18.1 (2003): 65-73.
[15]Al-Toma, Ahmed S., Gareth A. Taylor, and MaysamAbbod. "Modelling and simulation of load connected fixed blade wind turbine with permanent magnet synchronous generators." Power Engineering Conference (UPEC), 2015 50th International Universities. IEEE, 2015.
[16]Kim, Hong-Woo, Sung-Soo Kim, and Hee-Sang Ko. "Modeling and control of PMSG-based variable-speed wind turbine." Electric Power Systems Research 80.1 (2010): 46-52.
[17]Wang, Chia-Nan, Xuan-Khoa Le, and Wen-Chang Lin. "Modelling and Simulation of Autonomous Control PMSG Wind Turbine." Computer, Consumer and Control (IS3C), 2014 International Symposium on. IEEE, 2014.
![Fig. 2 single diode model of the solar panel [6]](https://thumb-us.123doks.com/thumbv2/123dok_us/7774408.1281450/3.595.207.396.234.350/fig-single-diode-model-of-the-solar-panel.webp)
![Fig. 3 basic circuit of the boost converter [13]](https://thumb-us.123doks.com/thumbv2/123dok_us/7774408.1281450/4.595.146.435.499.588/fig-basic-circuit-boost-converter.webp)