ABSTRACT
CLARK, NATALIE MINAKO. Gene Regulatory Networks Controlling Multicellular Development. (Under the direction of Dr. Rosangela Sozzani and Dr. Alun Lloyd).
Development in multicellular organisms requires not only the production of specialized
cell types but also mechanisms of coordination among them. Stem cells are ultimately the source
of all cell types, and the balance between self-renewal and differentiation of their progeny
regulates organ growth. Transcription factors and cell-to-cell signaling have a key role in
coordinating these processes; however, how these transcriptional networks control multicellular
development is not completely understood. Here, I investigate how we can use Gene Regulatory
Network (GRN) inference to identify the genes, and the relationships among them, that are
important for multicellular development.
First, I explore a GRN in the Arabidopsis root stem cells that involves the mobile
transcription factor SHORTROOT (SHR) and its binding partner SCARECROW (SCR). I use
scanning Fluorescence Correlation Spectroscopy (scanning FCS) techniques to quantify the
movement of SHR protein from the vasculature, where it is transcribed, to the endodermis and
Quiescent Center (QC), where it binds SCR. Using a combination of Raster Image Correlation
Spectroscopy (RICS) and Pair Correlation Function (pCF) analysis, I show that the movement of
SHR from the endodermis back to the vasculature is restricted by its binding to SCR.
Additionally, using Number and Brightness (N&B), I observed that SHR and SCR form two
different protein complex stoichiometries in the Cortex Endodermis Initials (CEI), but four
different stoichiometries in the QC. To unravel how differences in SHR-SCR complex formation
may affect its function in the CEI and QC, I build a mathematical model that predicts differences
in SHR and SCR dynamics between the CEI and QC. Using the model prediction and a
putative SHR activator and WUSCHEL RELATED HOMEOBOX 5 (WOX5) as a putative SHR
repressor. My model, which incorporates this upstream SHR regulation, shows that high levels of
the SHR-SCR complex trigger CEI division but repress QC division. This suggests new roles for
SHR and SCR in controlling CEI and QC division.
Next, I show how scanning FCS techniques can be used to study development in another
multicellular organism, namely Drosophila. In the Drosophila embryo, the transcription factor
Dorsal (Dl) acts as a mobile signal to control embryo patterning and development along with its
binding partner Cactus (Cact). Using RICS and pCF, I show that Dl movement is restricted on
the ventral side of the embryo. We further show that this restriction of Dl movement is correlated
with the proportion of Dl bound to DNA using cross-correlation RICS. Finally, using
mathematical modeling, we show that the dorsal-ventral gradient of Dl movement depends on
the proportion of Dl bound to DNA. Therefore, this combination of scanning FCS and
mathematical modeling reveals how mobile signals control development in different
multicellular organisms.
Finally, I show how computational methods can be used to predict GRNs from
transcriptional data. I specifically focus on a regression tree analysis pipeline, named Regression
Tree Pipeline for Spatial, Temporal, And Replicate Data (RTP-STAR), that can infer directed
networks from steady state transcriptional data. I present how I used RTP-STAR to infer a GRN
in Arabidopsis root hair cells. This inferred GRN led to a mathematical model which shows how
a negative feedback loop between two key genes controls proper root hair growth. This pipeline
has been incorporated into a graphical user interface named TuxNet that provides a simple
methodology for biologists to infer GRNs from transcriptional data. Taken together, these studies
important genes and regulatory networks that control cell division and patterning in both
© Copyright 2018 by Natalie Minako Clark
Gene Regulatory Networks Controlling Multicellular Development
by
Natalie Minako Clark
A dissertation submitted to the Graduate Faculty of North Carolina State University
in partial fulfillment of the requirements for the degree of
Doctor of Philosophy
Biomathematics
Raleigh, North Carolina
2018
APPROVED BY:
_______________________________ _______________________________ Dr. Rosangela Sozzani Dr. Alun Lloyd
Committee Co-Chair Committee Co-Chair
_______________________________ _______________________________
ii DEDICATION
To Dr. Stacey A. Hinderliter and Dr. James L. Clark. Thank you for always supporting my love
iii BIOGRAPHY
Natalie Minako Clark was born in Pittsburgh, PA and raised in Lynchburg, VA. She
earned her Bachelor of Science in Mathematics at the University of Richmond in 2013. During
her time working with Dr. Lester Caudill at UR, Natalie realized that she could combine two of
her passions, biology and mathematics, to address questions about development. This led her to
pursue a Ph.D. in Biomathematics at North Carolina State University. Despite disliking plant
biology, Dr. Rosangela (Ross) Sozzani convinced Natalie that plants are not so bad, leading
Natalie to join her lab in 2013. Natalie plans to continue her work by pursuing a postdoctoral
iv ACKNOWLEDGMENTS
First, I would like to thank the faculty mentors that have supported me throughout my
graduate studies. To my amazingly brilliant and supportive advisor, Dr. Ross Sozzani, thank you
for your invaluable advice and support throughout my entire Ph.D. You have truly encouraged
me to pursue an academic career in applying mathematics to plant biology. I would also like to
thank my co-chair, Dr. Alun Lloyd, for helping me jump through all of the administrative hoops
during my studies. Your mathematical advice is also greatly appreciated. Thank you to my other
committee members, Dr. Kevin Gross and Dr. Cranos Williams, for thoughtful discussions on
my research. I would have never considered pursuing study in biomathematics without
encouragement from my two undergraduate advisors. Dr. John Warrick, thank you for instilling
my love of genetics (and fruit flies) and supporting my switch from pure biology to
biomathematics. And, Dr. Lester Caudill, thank you for showing me how I can apply math to
biological questions.
In addition to my faculty advisors, I had the opportunity to collaborate with labs both at
NCSU and abroad. Dr. Greg Reeves, thank you for letting a converted plant biologist return to
her original favorite organism, the fruit fly. It was great to work with those little bugs again.
Hadel, thank you for all of your time and effort helping me collect images and caring for the
flies. You are a truly talented graduate student, and I know you are going to do great things.
Additionally, thank you to Dr. Keiko Sugimoto and Dr. Dolf Weijers, my international host
advisors in Yokohama, Japan and Wageningen, Netherlands, respectively. I had an amazing time
working in your labs on incredible projects. It was an experience I will truly never forget.
Next, I would like to thank everyone in the Sozzani Lab. To my fellow graduate students,
v Thank you to Angels: you were an amazing postdoctoral mentor and really helped me understand
network inference. Thank you to our lab technicians Marina, Loray, Cami, and Emily that helped
me with many experiments and were great company in the lab. I had the opportunity to mentor 4
amazing undergraduate students: Taylor, Tiara, Parnell, and Thomas. Thank you all for your
hard work, and I am so proud of all your accomplishments. Finally, thank you to Irena, our
amazing lab manager who poured more plates for me than I could count. Thank you for always
showing me adorable cat photos and bringing me flowers from your garden. I will truly miss
your company.
Surviving graduate school would not have been possible without an amazing support
system of friends. Thank you to Kelsey for teaching me about all of the struggles I would face
during my last year of grad school and getting Chinese food with me every month to ease the
pain. Thank you to Mary for making sure I left the house on a regular basis to paint or watch
movies. Thank you to Sadie, Bri, Jamie, Richard, and Brandon for dragging me away from my
work for fun board game nights. Thank you to Julian, Amanda, Ella, and the rest of the RuPaul’s
Drag Race crew for some of the most entertaining Thursday nights I’ve had in a long time. And,
thank you to Derek for your endless support and love. I am so happy that I found you during my
last year of graduate school. You are the best partner I could have asked for, and I look forward
to many more years together with our four crazy cats.
Finally, none of this would have been possible without my parents, who have supported
me since day one. Mom, you were right: I guess I am pretty good at this math stuff. Thanks for
always believing in me and letting me come home whenever I needed some comfort food and
lots of wine. Dad, thanks for your constant jokes and entertainment, and for all of your great
vi daughter get a Ph.D. and travel around the world all in the last few years. Maybe one day, I’ll get
vii TABLE OF CONTENTS
LIST OF TABLES ... ix
LIST OF FIGURES ... xi
Chapter 1: Introduction ... 1
Stem cell development in the Arabidopsis root ... 1
Drosophila embryonic development ... 5
Scanning Fluorescence Correlation Spectroscopy methodologies ... 5
Gene regulatory network inference methods ... 11
Overview ... 15
References ... 18
Chapter 2: Tracking transcription factor mobility and interaction in Arabidopsis roots with fluorescence correlation spectroscopy ... 26
Contribution ... 27
Abstract ... 28
Introduction ... 28
Results ... 30
Discussion ... 39
Materials and Methods ... 41
References ... 50
Chapter 3: Protein complex stoichiometry and transcriptional regulation are important predictors of cell division dynamics ... 59
Contribution ... 60
Abstract ... 61
Introduction ... 62
Results ... 65
Discussion ... 77
Methods... 81
References ... 92
Chapter 4: Dorsal/NF-κB exhibits a dorsal-to-ventral mobility gradient in the Drosophila embryo... 157
Contribution ... 158
Abstract ... 159
Introduction ... 160
Results ... 163
Discussion ... 170
STAR Methods ... 174
References ... 181
Chapter 5: GTL1 and DF1 regulate root hair growth through transcriptional repression of ROOT HAIR DEFECTIVE 6-LIKE4 in Arabidopsis ... 220
Contribution ... 221
viii
Introduction ... 222
Results ... 223
Discussion ... 227
Materials and Methods ... 229
References ... 231
Chapter 6: TuxNet: A simple interface to process RNA sequencing data and infer gene regulatory networks ... 245
Contribution ... 246
Abstract ... 247
Introduction ... 247
Results ... 249
Discussion ... 261
Methods... 263
Parsed Citations ... 269
APPENDICES ... 281
Appendix A: Measuring Protein Movement, Oligomerization State, and Protein–Protein Interaction in Arabidopsis Roots Using Scanning Fluorescence Correlation Spectroscopy (Scanning FCS) ... 282
Contribution ... 283
Abstract ... 284
Introduction ... 284
Materials ... 285
Methods... 286
Notes ... 296
References ... 298
Appendix B: Identifying differentially expressed genes using fluorescence-activated cell sorting (FACS) and RNA sequencing from low input samples ... 300
Contribution ... 301
Summary ... 303
Introduction ... 303
Materials ... 304
Methods... 308
Summary/Outlook ... 314
Notes ... 314
ix LIST OF TABLES
Chapter 2
Table 1. Recommended imaging conditions for RICS and N&B ... 32
Table 2. N&B parameters for SimFCS software analysis ... 36
Chapter 3 Supplementary Table 1. SHR oligomeric state in QC ... 115
Supplementary Table 2. SHR oligomeric state in CEI ... 115
Supplementary Table 3. SCR oligomeric state in QC ... 116
Supplementary Table 4. SCR oligomeric state in CEI ... 116
Supplementary Table 5. SHR-SCR complex stoichiometry in QC ... 117
Supplementary Table 6. SHR-SCR complex stoichiometry in CEI ... 117
Supplementary Table 7. Sensitivity analysis of mathematical model ... 117
Supplementary Table 8. Parameter values and model error for the first model that does not incorporate upstream SHR and SCR regulation ... 118
Supplementary Table 9. Parameter values and model error for the second model incorporating upstream SHR and SCR regulation ... 121
Supplementary Table 10. Time course expression and sign score of predicted SHR regulators... 122
Supplementary Table 11. Expression and q-values of differentially expressed genes in the seu-3 mutant ... 123
Supplementary Table 12. Yeast Two Hybrid on predicted SEU binding partners ... 123
Supplementary Table 13. Time course expression and sign score of putative SEU binding partners ... 135
Supplementary Table 14. Time course expression, spatial expression, and sign score of TFs enriched in stem cells ... 136
Supplementary Table 15. pCF analysis of WOX5:WOX5-GFP, 35S:GFP, and TMO5:3xGFP ... 138
Supplementary Table 16. Expression and q-values of differentially expressed genes in the wox5-1 mutant... 144
Supplementary Table 17. WOX5:GFP Corrected Total Cell Fluorescence (CTCF) in roots treated and not treated with NPA ... 144
Supplementary Table 18. pCYCD6:GUS-GFP CTCF in roots treated and not treated with NPA ... 145
Supplementary Table 19. Model parameters for final model incorporating SEU and WOX5, model error, and predicted fold change in SHR when removing SEU and/or WOX5 ... 146
Supplementary Table 20. Number of roots with pCYCD6:GUS-GFP expression at 4,5, and 6 days ... 147
Supplementary Table 21. Number of roots with QC divisions at 5 days and 6 days with and without BL treatment ... 149
Supplementary Table 22. CTCF of SHR:SHR-GFP in roots treated and not treated with BL ... 150
x Supplementary Table 24. Stoichiometry of SHR-SCR complex in
BL treated plants ... 152
Supplementary Table 25. CTCF of pCYCD6:GUS-GFP in seu-3 and wox5-1 mutants ... 152
Supplementary Table 26. S-factor of 35S:GFP ... 153
Supplementary Table 27. S-factor of UBQ10:mCherry ... 154
Supplementary Table 28. Monomer brightness of 35S:GFP ... 155
Supplementary Table 29. Monomer brightness of UBQ10:mCherry ... 156
Supplementary Table 30. Expression of SCR in the endodermis and QC from a root tissue dataset ... 156
Chapter 4 Table S1. Imaging parameters for RICS and pCF ... 218
Chapter 5 Table 1. Genes commonly regulated by GTL1, DF1 and RSL4 ... 228
Table S1. A list of genes transcriptionally regulated by GTL1 and DF1 in Arabidopsis root hairs ... 242
Table S2. A list of genes directly bound by GTL1 and DF1 in Arabidopsis roots ... 242
Table S3. Effects of edge threshold on precision of inferred GRN ... 242
Table S4. Parameter values used in the model ... 243
Table S5. A list of primers used in this study ... 244
Chapter 6 Supplemental Table 1. GENIST parameters ... 272
xi LIST OF FIGURES
Chapter 2
Figure 1. Diffusion coefficients obtained by performing RICS on SHR:SHR-GFP
in shr2 ... 31
Figure 2. Pair correlation function (pCF) analysis showing direction of SHR movement ... 33
Figure 3. N&B analysis of the SHR oligomeric state ... 35
Figure 4. Cross-N&B analysis of a SHR/SCR double-tagged line ... 38
Figure 5. Mathematical model simulations of SHR and SCR illustrate how reduction of SCR affects the formation of SHR homodimer and SHR-SCR complex ... 40
Figure 1 Figure Supplement 1. RICS analysis on the 35S:GFP line ... 53
Figure 2 Figure Supplement 1. Pair correlation function analysis of 35S:GFP, SCR:SCR-GFP, and TMO5:3xGFP... 54
Figure 4 Figure Supplement 1. Longitudinal confocal root sections of SHR:SHR-GFP/SCR:SCR-mCherry line ... 55
Figure 4 Figure Supplement 2. N&B analysis of UBQ10 and SCR oligomeric state ... 56
Figure 5 Figure Supplement 1. Sensitivity analysis of mathematical model of SHR and SCR ... 57
Figure 5 Figure Supplement 2. Functional form of k2 parameter in mathematical model ... 58
Chapter 3 Figure 1. A mathematical model of SHR and SCR incorporates SHR-SCR oligomeric state and stoichiometry in the QC ... 98
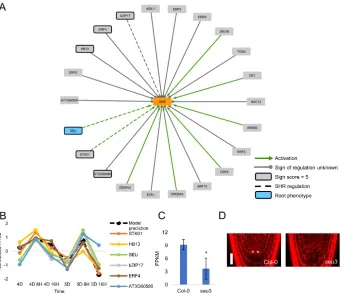
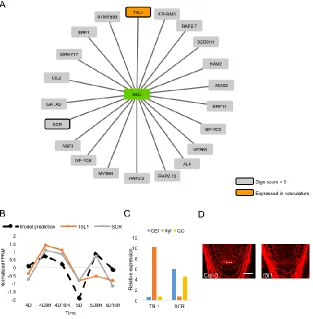
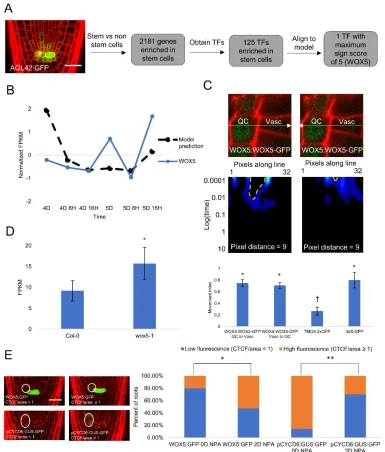
Figure 2. Model prediction identifies putative SHR activators ... 100
Figure 3. T5L1 is a vasculature-specific putative binding partner of SEU ... 101
Figure 4. Transcriptional profile of stem cells identifies candidate SHR repressor ... 102
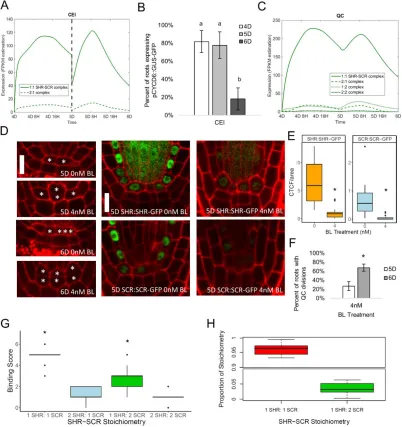
Figure 5. Model predicts that SHR-SCR complex promotes CEI but represses QC divisions ... 104
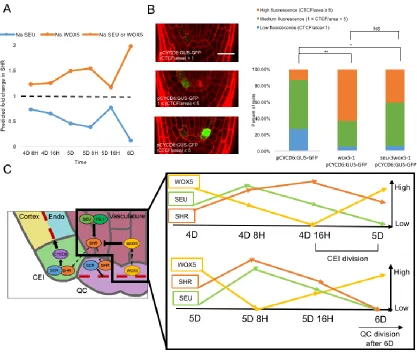
Figure 6. SEU and WOX5 regulation of SHR controls stem cell division ... 106
Supplementary Figure 1. SHR and SCR oligomeric state and SHR-SCR complex stoichiometry in the CEI ... 109
Supplementary Figure 2. Sensitivity analysis for model ... 110
Supplementary Figure 3. Model simulation with no upstream SHR and SCR regulation ... 111
Supplementary Figure 4. Confocal images of stk01 and bzip17 mutants ... 111
Supplementary Figure 5. mPSPI staining of seu-3 mutant ... 111
Supplementary Figure 6. Expression of SEU:SEU-GFP in the root ... 112
Supplementary Figure 7. Temporal and spatial expression of NAC13 in the root ... 112
Supplementary Figure 8. Transcriptional and translational markers of WOX5 expression ... 112
xii Supplementary Figure 10. S-factor and monomer brightness of 35S:GFP and
UBQ10:mCherry control lines ... 114
Chapter 4 Figure 1. RICS analysis reveals a dorsal-ventral asymmetry in the mobility of Dl ... 188
Figure 2. pCF analysis and FRAP reveal a dorsal-to-ventral asymmetry in nuclear export of Dl ... 189
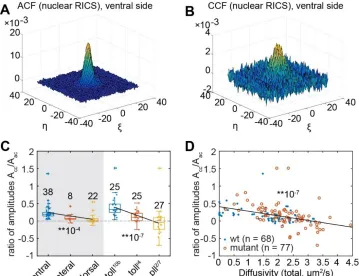
Figure 3. Cross-correlation RICS analysis of DNA-bound Dl ... 191
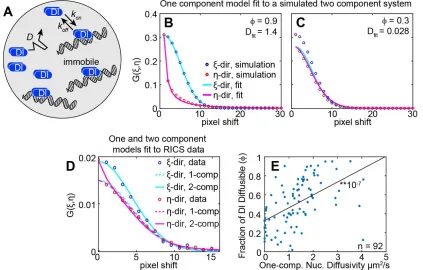
Figure 4. One- and two-component diffusion models quantify the relationship between DNA binding and mobility of Dl ... 192
Figure 5. Variation of Dl mobility along the DV axis ... 193
Figure S1. Representative RICS images and ACFs ... 214
Figure S2. pCF and FRAP measurements of movement of Dl-GFP in and out of the nucleus ... 216
Figure S3. Cross correlation between Dl-GFP and H2A-RFP ... 217
Figure S4. Fitting the one-component model to simulated ACFs from the two- and three-component models ... 218
Chapter 5 Fig. 1. GTL1 and DF1 repress root hair growth in Arabidopsis ... 223
Fig. 2. GTL1 and DF1 repress RSL4 expression in roots. ... 225
Fig. 3. GTL1 and DF1 directly bind the RSL4 promoter and regulate its expression ... 226
Fig. 4. GTL1 and DF1 regulate root hair growth in a parallel pathway to auxin signaling ... 227
Fig. 5. Modeling predicts that GTL1 and RSL4 form a negative-feedback loop and regulate a set of common targets ... 229
Fig. 6. A schematic diagram of the proposed transcriptional network regulating root hair growth in Arabidopsis ... 230
Fig. S1. Molecular genetic characterization of df1-1, gtl1-1 df1-1, pEXP7:GTL1-GFP and pEXP7:DF1-GFP plants ... 233
Fig. S2. Confocal images of GTL1-GFP and DF1-GFP in pGTL1:GTL1-GFP and pDF1:DF1-GFP roots ... 235
Fig. S3. GTL1 and DF1 regulate ploidy-independent root hair growth ... 236
Fig. S4. GTL1 represses the RSL4 and its own promoter in Arabidopsis cell culture ... 237
Fig. S5. Genes commonly regulated by GTL1, DF1 and RSL4 in root hairs ... 238
Fig. S6. Genes directly bound by GTL1 and DF1 in Arabidopsis roots ... 240
Fig. S7. Sensitivity analysis and phase-plane analysis of mathematical model ... 241
Chapter 6 Fig. 1. TUX tab of TuxNet shown with default parameters ... 250
Fig. 2. GENIST tab of TuxNet shown with default parameters ... 251
Fig. 3. RTP-STAR tab of TuxNet shown with default parameters ... 252
xiii Fig. 5. GENIST tab of TuxNet shown with input files and parameters used to
run the PAN network illustrated in Fig. 6. ... 257
Fig. 6. Network of PAN and its downstream factors inferred with GENIST ... 258
Fig. 7. RTP-STAR tab of TuxNet shown with input files and parameters used to run the PAN-ATHB13 network shown in Fig. 8. ... 259
Fig. 8. Network of PAN, ATHB13, and their downstream factors, inferred with RTP-STAR ... 260
Supplemental Figure 1. TUX tab of TuxNet showing an example of a manual input that can be typed in to run fastq-mcf and the Tuxedo pipeline ... 274
Supplemental Figure 2. Flowchart illustrating the output files generated during the intermediate steps of the TUX analysis ... 275
Supplemental Figure 3. GENIST parameter: Time lapse ... 276
Supplemental Figure 4. GENIST parameter: Discretization levels ... 277
Supplemental Figure 5. GENIST parameter: Reg Fold Change Threshold; RTP-STAR parameter: Time_threshold ... 278
Supplemental Figure 6. GENIST parameter: Reg Time Percent ... 279
Supplemental Figure 7. athb13 mutant allele ... 280
Appendices Appendix A Fig. 1. RICS analysis using the SimFCS software ... 288
Fig. 2. pCF analysis using the SimFCS software ... 289
Fig. 3. N&B analysis using the SimFCS software ... 292
Fig .4. Cross N&B analysis using the SimFCS software ... 294
Appendix B Figure 1. Fluorescence gates used for collecting positive cells ... 322
1 Chapter 1 - Introduction
Stem cell development in the Arabidopsis root
The Arabidopsis root tip contains a number of stem cell populations that divide
asymmetrically to form two daughter cells. One of the daughter cells becomes the new stem cell,
while the other daughter cell differentiates to form one or two specific tissue layers. The stem
cells are contained in a region of the root tip called the stem cell niche (SCN), which contains a
set of cells called the Quiescent Center (QC) that are surrounded by the stem cell populations.
Unlike the stem cells, which asymmetrically divide approximately every 24 hours, the QC is
relatively mitotically inactive and divides at less than half of the rate of the other stem cells 1.
The three stem cells adjacent to the QC divide shootwards to form the proximal root tissues. The
outermost of these initial populations, the Lateral Root Cap/Epidermis Initials, first divides
periclinally to produce the new stem cell. The second daughter cell then divides anticlinally to
form the two outermost cell layers, namely the lateral root cap and the epidermis. A similar
succession of two divisions occurs in the Cortex/Endodermis Initials (CEI), which first divide
anticlinally to form the new stem cell and then periclinally to form the two ground tissue layers,
namely the cortex and endodermis. Finally, the vasculature initials divide once anticlinally, and
their daughter cells go on to differentiate and form the numerous vascular tissues, which are the
innermost tissues of the root. In contrast, the distal root stem cell population, the Columella Stem
Cells (CSCs), divides once anticlinally in the rootward direction to form the columella layer.
Division of these stem cell populations is coordinated through cell-to-cell signaling mechanisms
that incorporate ligands or even transcription factors as signaling molecules 2,3. Thus, stem cell
2 Recent work has unraveled how two transcription factors, SHORTROOT (SHR) and
SCARECROW (SCR) regulate asymmetric division of the CEI as well as ground tissue
patterning. SHR was first identified, and named, due to a mutation in the gene that results in
extremely short roots. Further work on SHR revealed that the mutant additionally has only one
ground tissue layer that takes on an endodermal identity. Isolation of the SHR gene revealed that
it is a member of the GRAS family of putative transcription factors. A second member of this
family, SCR, was identified due to its mutant having a single ground tissue layer like the shr mutant. However, unlike the shr mutant, the scr mutant layer displays markers of both
endodermis and cortex identity 4–6. Taken together, these results suggested that SHR and SCR
control the asymmetric division of the CEI and the differentiation of the ground tissue layers.
Given the role of SHR and SCR in ground tissue patterning, it is expected that both genes
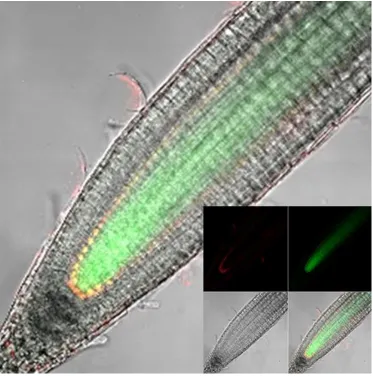
are expressed in the CEI, endodermis, and/or cortex. However, while SCR transcript is expressed
in the CEI, QC, and endodermis, SHR transcript is restricted to the vasculature 7 and its protein is
localized to the vasculature, CEI, QC, and endodermis 8. This suggests that SHR protein moves
from the vasculature to the CEI and endodermis to regulate asymmetric division and ground
tissue patterning. In order to move between cells, SHR needs to pass through the plasmodesmata,
which are channels in the cell walls that allow for cell-to-cell communication. Recent work has
shown that SHR likely depends on chaperones in order to shuttle through the plasmodesmata 9–
12. Once in the CEI and endodermis, SHR is able to form a protein complex with SCR. This
SHR-SCR complex can then activate SCR expression, creating a positive feedback loop that
increases complex production 10,13–15. Further, it has been shown that this complex formation
restricts SHR movement from the endodermis back to the vasculature. This control of SHR
3 results in ectopic ground tissue divisions 10,15. Thus, regulation of SHR movement is key for
proper ground tissue specification.
In the CEI, the SHR-SCR complex activates the gene CYCLIN D6 (CYCD6) which is
expressed immediately preceding the CEI division 13. The SHR-SCR complex specifically
activates CYCD6 in the CEI, and not the entire endodermal layer where it is expressed, due to
the auxin gradient in the root. Auxin is a plant hormone that has a maximum in the root tip and
decreases shootwards due to various auxin transport mechanisms 16. In the CEI, where auxin
levels are higher, auxin promotes CYCD6 expression and activates phosphorylation of another
transcription factor, RETINOBLASTOMA-RELATED (RBR). This phosphorylation of RBR
inactivates it and prevents it from binding to SCR, allowing SCR to bind SHR and further
increase CYCD6 expression to induce CEI division. Meanwhile, in the endodermis, where auxin
levels are lower, less CYCD6 is present, which results in more active RBR that can bind SCR.
These lower auxin levels therefore decrease levels of the SHR-SCR complex, so further CYCD6
activation does not occur, preventing division 1,14. SHR and SCR also control endodermis
patterning through regulating a downstream set of C2H2 transcription factors called BIRD
proteins. These BIRD proteins are expressed throughout the ground tissue layers, and single and
higher order mutants of these BIRDs have developmental phenotypes including ectopic
divisions, missing ground tissue layers, and misexpression of SHR and SCR 17,18. Therefore,
SHR and SCR are part of gene regulatory networks that control CEI division and ground tissue
maintenance. My current work aims at understanding the dynamics of SHR and SCR regulation
of cell division as well as identifying additional downstream targets and upstream regulators of
4 While SHR and SCR are also expressed in the QC, their role in this cell type is less
understood. However, recent work has uncovered other factors that maintain the QC. A subset of
AP2 transcription factors, called the PLETHORA (PLT) factors, have been shown to control QC
and root maintenance. Accordingly, double and triple mutants of PLT1, PLT2, and PLT3/AIL6
show stem cell niche defects. Further, a quadruple mutant of PLT1, PLT2, PLT3/AIL6, and
BABY BOOM (BBM) is rootless 19,20. Another transcription factor, WUSCHEL-RELATED
HOMEOBOX 5 (WOX5), has been implicated in QC maintenance as wox5 mutants show a disorganized stem cell niche with enlarged QC cells 21. It was originally assumed that WOX5 is a
QC specific factor given that its transcriptional fusion is localized exclusively to the QC 22.
However, a translational fusion of WOX5 protein shows expression in the surrounding stem cells
including the vascular initials, CEI, and CSCs 23. This suggests that WOX5 protein may act as a
mobile signal to maintain the surrounding stem cells in an undifferentiated state. In support of
this hypothesis, WOX5 overexpression lines have excessive layers of undifferentiated columella
cells. It was further shown that WOX5 represses the differentiation factor CYCLING DOF
FACTOR 4 (CDF4) to maintain the CSCs 23. Finally, transcriptional profiling of the QC has
identified a number of genes with putative roles in the QC. A recently developed gene regulatory
network (GRN) inference method predicted that PERIANTHIA (PAN), a known floral regulator,
has an important functional role in the QC. This role was validated by showing that pan mutants have a disorganized stem cell niche, while PAN overexpressors have ectopic QC divisions.
Further, a transcriptional profile of the pan mutant suggested that PAN may regulate known QC factors like the PLT family of genes and WOX5 24. My current work focuses on identifying
5 Drosophila embryonic development
Development of the Drosophila embryo is a spatiotemporally tightly regulated process.
After fertilization, the embryo undergoes 13 nuclear divisions. The first 7 divisions occur
synchronously, and then become asynchronous as regulatory networks activate and begin to
pattern the embryo 25. Genes activated early in embryonic development control anterior-posterior
patterning, while genes that appear later in the development regulate polar segmentation of the
embryo. Further, these early and late developmental genes transcriptionally regulate each other
to ensure that these stages of patterning occur at the correct time during the successive nuclear
cycles 26. One of the regulatory mechanisms occurring later in embryonic development,
specifically after the 9th nuclear division, is the Toll receptor signaling pathway, which controls
dorsal-ventral patterning. In the absence of Toll signaling, the transcription factor Dorsal (Dl) is
uniformly localized to the cytoplasm due to its interaction with the cytoplasmic tethering protein
Cactus (Cact) 27–32. On the ventral side of the embryo, Toll signaling acts through the Pelle
kinase to phosphorylate and degrade Cact, which releases Dl to move to the nucleus and regulate
gene expression 33. This results in a gradient of high, nuclear Dl expression on the ventral side of
the embryo to low, cytoplasmic Dl expression on the dorsal side 34–36. Other regulatory networks
in early and late embryo development depend on morphogen gradients, like the Dl gradient, to
properly communicate cell fate decisions 26. Therefore, my current work uses methods that can
quantify how these gradients change over space and time to further investigate how protein
movement and cell-to-cell signaling control pattern formation.
Scanning Fluorescence Correlation Spectroscopy methodologies
Both Arabidopsis root stem cell and Drosophila embryo patterning depend on gene
6 mathematical modeling can be used to quantify how gene expression changes over time, these
models will include unknown parameters such as diffusion coefficients and binding ratios of
proteins. Thus, to develop models that best recapitulate gene expression dynamics, methods are
needed to experimentally measure protein movement and binding in vivo. To this end,
Fluorescence Correlation Spectroscopy (FCS) methodologies have been developed to quantify
protein interactions and kinetics at a molecular level. FCS was originally developed to measure
fluorescence fluctuations at a single point in an observation volume. Based on the observation
that the cross-section of a laser beam follows a Gaussian distribution, an Autocorrelation
Function (ACF) of fluorescent molecules in the observation volume can be calculated. This ACF
measures how the fluorescent molecules correlate over space and time. Further, a diffusion
model can be fit to this ACF to determine the best-fitting, i.e. experimental, diffusion coefficient
37. Similarly, the distribution of photon counts follows a Poisson distribution, allowing the degree
of polymerization and aggregation of molecules to be calculated using the amplitude and spread
(mean and variance) of the intensity distribution 38,39. Therefore, single point FCS provides a way
to experimentally measure protein diffusion and oligomerization. Further, single point FCS can
be performed using confocal microscopy, which is a lower cost and less technically complex
imaging platform. However, the main drawback of single point FCS is that it encodes minimal
spatiotemporal information by focusing on only a small region of the observation volume.
In order to measure protein movement across cells, or differences in protein aggregation
between cell types, measurements need to be taken at many points in the observation volume. To
this end, scanning FCS was developed to measure protein dynamics in a focal volume at a pixel
resolution of ≤100nm. Instead of focusing on a single point, the laser scans across the focal
7 spends on each pixel, is between 5-20 microseconds such that the laser returns to the same
position before the fluorescent molecule leaves the focal volume. This is required to measure the
same particle over space and time to calculate the ACF. Since the ACF now incorporates 2
spatial dimensions rather than 1 spatial dimension as in single point FCS, the ACF is now a 3D
Gaussian function. Thus, instead of experimentally measuring the diffusion coefficient at a single
point, scanning FCS returns the average diffusion coefficient of the focal volume. This method
of raster scanning the focal volume to measure the ACF and fit the diffusion coefficient is termed
Raster Image Correlation Spectroscopy, or RICS 40–42. Thus, RICS allows for the measurement
of protein movement in different regions of a single cell, or in different cell types of a
multicellular organism.
One of the main drawbacks of RICS is that it returns an average diffusion coefficient for
the entire focal region. This means that RICS cannot detect if movement is restricted at barriers
within cells, such as the nuclear envelope or organelles, or between cells, such as cell membranes
and walls. In order to measure diffusion through a barrier, particles on one side of the barrier
must be spatiotemporally correlated as they pass through the barrier to the other side. This way,
if the barrier restricts protein movement, the autocorrelation of the particles will occur at a delay,
or if the barrier completely blocks protein movement, no autocorrelation will occur. To this end,
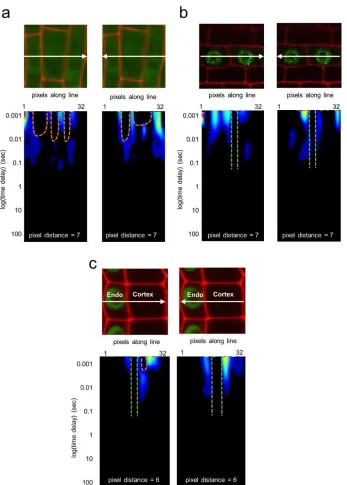
the Pair Correlation Function (pCF) was developed to measure protein movement through a
barrier. Unlike RICS, which uses raster scanning, pCF uses a single line scanned across the
potential diffusion barrier many (≥100,000) times. The pCF between pairs of pixels on either
side of the barrier is then calculated. Crucially, the pCF is affected by the distance between the
correlated pixels, so this distance must be chosen according to the size and position of the
8 carpet which shows how the autocorrelation varies over space (along the line scan) and time
(between the individual line scans). Qualitative and quantitative information can be obtained
from the carpet to determine if the protein is able to move through the barrier. A carpet showing
autocorrelation with no delay, or autocorrelation with a time delay, suggests that the protein can
pass the barrier. In contrast, if the carpet shows no autocorrelation occurring at the barrier, this
suggests that the protein cannot cross the barrier 43–45. Therefore, pCF can reveal if protein
movement within or between cells is restricted in any manner.
pCF on a line scan can only quantify protein movement through barriers in one
dimension (1D). However, proteins can encounter barriers in any direction. Thus, to better
quantify barriers to movement within an area, a 2D pCF needs to be calculated, which requires
correlating pairs of pixels in both the horizontal and vertical direction using a raster scan.
However, obtaining a raster scan at the resolution required for 2D pCF is difficult with a
traditional confocal microscope. Since the confocal microscope focuses the laser on a small focal
volume, photobleaching of the sample can occur within seconds. Thus, methods have been
developed to obtain a 2D pCF using Single Plane Illumination Microscopy (SPIM) and Total
Internal Reflection Fluorescence (TIRF) microscopy, which both illuminate a thin sheet of the
sample rather than a focal region, reducing photobleaching. Calculating the 2D pCF using these
imaging methods allows one to visualize barriers of protein diffusions in the focal volume 46. As
SPIM and TIRF methodologies become more accessible, 2D pCF could be used to better
visualize barriers to diffusion in multicellular organisms in the future.
Calculating the ACF across a raster scanned image also improves the spatiotemporal
information on protein aggregation. Using the same assumptions from single point FCS, the
9 region can be determined through a process called Number and Brightness (N&B). N&B
requires a monomeric fluorescent control to determine the brightness of a monomer and, in
non-photon counting setups, a region of the image containing autofluorescence and/or immobile
cellular structures to eliminate background fluorescence. Once the monomeric fluorescence is
set, the average and variance of the intensity distribution are used to determine if higher
oligomeric states are present. Further, since N&B returns the oligomerization state of the
proteins in each pixel of the image, the proportion of different oligomers can be quantified 47.
This results in a visualization of the distribution of different oligomeric states within and
between cells. Combined with RICS analysis, N&B can show if differences in diffusion between
cells could be due to the formation of higher oligomeric states. Additionally, if the oligomeric
state of a protein varies between different cell types, then it could be a factor in determining cell
function or fate.
Both RICS and N&B can be expanded to spatiotemporally measure the movement and
binding of two proteins tagged with two different fluorophores, such as GFP (green) and
mCherry (red). Measuring two proteins at once requires calculating not only the ACF of each
protein individually but also the cross-correlation between the two channels. Thus, it is important
that the two chosen fluorophores do not have overlapping emission spectrums, as otherwise this
can bias the cross-correlation calculation. Cross-correlation can be applied to RICS to determine
the cross-correlation RICS (ccRICS) of two proteins, which shows if protein binding affects the
movement of one or both proteins. For example, if one of the proteins restricts the movement of
the other protein, the ccRICS will inversely correlate with the diffusion coefficient of the
restricted protein 48. Additionally, cross-correlation N&B (cross N&B) can determine if two
10 of the two proteins varies the same over space and time, indicating that the proteins are bound to
each other. Further, cross N&B can incorporate the oligomeric states determined from single
channel N&B to quantify the number and proportion of different protein-protein complex
stoichiometries 49. Similar to single channel N&B, cross N&B provides a visualization of
different protein-protein complex stoichiometries across the focal region, allowing one to see if
different regions of a cell or cell types have variable stoichiometries.
While scanning FCS allows for greater spatiotemporal resolution than single point FCS,
it includes additional information that can bias the calculation of diffusion coefficients, protein
oligomerization and protein-protein binding. The major source of noise in scanning FCS images
comes from regions of the image that do not express fluorescence, which are commonly referred
to as background regions or immobile fractions. Since RICS calculates the average diffusion
coefficient across the entire image, including these background regions can decrease the
diffusion coefficient since they will have a diffusion equal to zero. Similarly, the background
regions can alter the calculation of higher oligomeric states during N&B analysis. Thus, a
moving average methodology has been introduced as an analytical approach to remove these
background regions from analysis. The moving average involves taking 3 to 5 frames (time
points) before and after the frame of interest and averaging their intensity. The average intensity
of the background is then subtracted from the frame of interest before using it to calculate the
ACF. This process is repeated for all of the frames in the raster scan. Since the intensity of the
background region should not change over time, applying the moving average effectively
removes any intensity that is not from the fluorescently tagged protein of interest 40,41. Thus,
11 the most accurate diffusion coefficient, oligomerization state, and/or protein-protein
stoichiometry.
Taken together, these scanning FCS methodologies can quantify protein movement and
binding within and/or between cells. Although scanning FCS was originally developed and used
on mammalian cell cultures 44,45,50,51, recent work has expanded these methods into multicellular
structures such as the Arabidopsis root 15 and the Drosophila wing disc 52. Given the importance
of morphogen gradients and protein binding in cell fate and function, my current work uses these
techniques to experimentally determine diffusion coefficients and protein binding parameters for
mathematical models that accurately predict gene expression in multicellular organisms.
Gene regulatory network inference methods
An emerging problem with the advent of affordable and accessible high throughput
sequencing is how to identify genes that have important and essential biological functions. Even
with stringent statistical conditions such as low false discovery rates (FDR/q-value) and high
fold change requirements, thousands of genes can be identified as differentially expressed
between two or more different samples. Further, choosing genes based solely on their q-value or
fold change often results in genes that do not show a phenotype. This can result in experimenting
on candidate genes that are not biologically important, rather than focusing on genes with
essential functions. Thus, finding an unbiased approach that can generate hypotheses about gene
function using high throughput sequencing data would greatly increase our efficiency at
identifying novel genetic regulators.
Recently, Gene Regulatory Networks (GRNs) have been proposed as a method for
identifying important candidate genes from large scale datasets across multicellular organisms
12 inferred network showing the most likely regulation between the genes of interest based on the
data. Different statistical methods are used to calculate the highest confidence edges
(regulations) between the nodes (genes) in the network based on assumptions about the data
(steady state, time course, etc.) and range from simple to mathematically complex. Thus, the
choice of GRN inference method depends on the types of data collected and the mathematical
methodologies needed to generate hypotheses that can be experimentally tested.
Some of the simplest GRN inference methods are information theory models, which use a
statistical measure to determine if two genes are able to regulate each other. Common statistical
measures include correlation coefficients 55 and mutual information indices 56,57. Since
information theory models only consider regulation between gene pairs, they can accurately infer
relationships between thousands of genes with very few data points. However, they are
undirected, meaning they cannot determine which gene is the regulator and which is the target,
and since they assume pairwise regulation, they do not account for scenarios where multiple
genes can regulate the same gene 53.
Methods that can infer directed networks are important for modeling gene regulation
given the prevalence of structures such as feedback and feedforward loops in biological systems.
Most methods that infer directed networks require time course data in order to predict
relationships between genes over time. Some of these methods, such as Boolean networks, treat
time course data as discrete time points and infer relationships between genes from one time
point to the next. In one commonly used method, called the threshold method, a gene is
classified as “on” (a value of 1) or “off” (a value of 0) at each time point based on if the
experimental gene expression increases (decreases) above (below) a certain threshold. Then, the
13 data 58–60. Since both gene expression and time are treated as discrete variables, Boolean
networks are easy to biologically interpret and test 53. However, while Boolean networks are one
of the simplest methods to infer a directed network, using discrete time points eliminates
temporal patterns in gene expression that could provide more information and result in more
accurate network predictions.
To incorporate temporal fluctuations in gene expression into network inference methods,
continuous time models are needed. A common way to model gene expression over time is using
Ordinary Differential Equations (ODEs), which describe changes in gene expression as a
function of the concentration of other genes plus kinetic parameters such as production and
degradation rates. In the context of network inference, an ODE is built for each gene based on
the predicted transcriptional regulators from the experimental data. Since ODEs provide
numerical values for gene expression, they quantitatively measure how the predicted
transcriptional regulation controls temporal expression dynamics. However, ODE models
contain a number of unknown parameters that must be experimentally determined or estimated
from experimental data. Further, the choice of parameter values can result in different outcomes,
especially in systems that exhibit bistability. Therefore, limited information about experimentally
determined parameter values can result in less accurate GRNs 53.
Both Boolean networks and ODEs require time course data for network inference.
However, there are methods that can infer directed networks from steady-state data, such as
regression tree inference, which assumes that gene expression can be described by a regression
model on the upstream regulators. One regression tree, which is a directed network that is
connected but cannot contain any loops, is built for each gene based on steady-state expression
14 combined, temporal aspects such as loops can form in the network as regulators can be shared
between trees 61–63. While the temporal features of the network are created from combining the
individual regression trees and not inferred directly from temporal expression data, regression
trees provide a useful GRN inference method when time course data is not available.
All of the previous methods assume that gene expression is deterministically controlled
by upstream regulators. However, recent advances in single cell sequencing have revealed that
gene expression can vary randomly between individual cells in the same population 64,65. These
results suggest that there may be a stochastic component to gene expression. Thus, GRN
methods have been developed that treat gene expression as random variables that follow a certain
probability distribution. The most common of these methods, Bayesian Networks (BN), assume
a prior distribution for gene expression that is then trained and updated using steady-state (static
BN) or time course (dynamic BN) expression data. The edges of the network are then inferred
based on the posterior probability distribution 24,66. While BNs work well for noisy or stochastic
gene expression data, they still require time course expression in order to infer networks with
temporal features such as loops 53.
After inferring GRNs using any of the various methods available, metrics can be
calculated to determine which genes in the network are most likely to have an important
biological function. For example, the outdegree (number of edges coming out) of a gene is
commonly used as a proxy for biological importance, and it has been shown that essential genes
have higher outdegrees than less essential genes 67,68. The use of outdegree stems from the
observation that many biological networks are scale-free, meaning that there are many genes
with low outdegree and few genes with high outdegree 69, although recently the prevalence of
15 the number of network motifs in which a gene participates. A network motif is any feature of a
network, such as a feedback or feed-forward loop, that is significantly more common in the
network than a randomly generated network of the same side. A number of network motifs
including loops and higher order structures, like diamonds and bifans, have been shown to
include essential genes 71–73. Therefore, applying these metrics to inferred networks could
identify candidate genes that are more likely to show a phenotype.
A number of these GRN inference methods have been used to infer networks in
multicellular organisms, specifically Arabidopsis. Using data on Arabidopsis root transcription
factors, a mutual information algorithm called ARACNE was able to recapitulate known
networks involving the BIRD transcription factors, which are involved in ground tissue
patterning, and the PLETHORA genes, which are involved in stem cell maintenance 74. A
stochastic Boolean model incorporating GLABRA3 and CAPRICE movement accurately
predicted root hair patterning in Arabidopsis 75. In another Arabidopsis root hair network, a
regression tree method called GENIE3 was used to predict that a feedback loop between two root
hair regulators, GTL1 and RSL4, controls proper root hair growth 76. A novel algorithm, CDAA,
was developed to infer GRNs from noisy time course data, and successfully predicted novel
regulators in iron homeostasis 77. Finally, spatial clustering has been combined with dynamic BN
inference to identify novel Arabidopsis root stem cell regulators 24. My current work uses these
GRN inference methods to generate hypotheses about gene regulation in multicellular organisms
which can then be experimentally validated.
Overview
Here, I describe how I used a combination of quantitative imaging methods,
16 Arabidopsis root stem cell development and Drosophila embryonic patterning. The next two
chapters (Chapters 2 and 3) focus on understanding how two transcription factors, SHR and
SCR, control stem cell division in the Arabidopsis root. In these chapters, I detail how we used
scanning FCS methods to understand how protein movement, oligomeric state, and
protein-protein complex stoichiometry affect SHR and SCR function in different cell types. Further, I
use the experimentally determined parameters from scanning FCS in a mathematical model of
SHR and SCR expression dynamics in two different cell types. This model predicts that there is a
different function of the SHR-SCR complex in each of these cell types, which we then validate
using biological data. Taken together, Chapters 2 and 3 provide new evidence for the role of
SHR and SCR in controlling stem cell division.
Chapter 4 focuses on using a similar approach in a different multicellular organism,
namely Drosophila. This chapter highlights how a gradient of Dl movement along the
dorsal-to-ventral axis of the embryo controls cell fate and embryonic patterning. Again, I use scanning
FCS methods to quantify Dl movement on the dorsal and ventral side of the embryo. By
incorporating ccRICS, we are able to show that the dorsal-to-ventral gradient in Dl movement
depends on the proportion of Dl bound to DNA. Further, we propose a two-component diffusion
model that incorporates cytoplasmic Dl and Dl bound to DNA. By adjusting the parameters in
this model that control the proportion of Dl bound to DNA, we can predict the dorsal-to-ventral
movement gradient that we see experimentally. These results provide new evidence for how
nuclear exclusion of Dl by its binding partner Cact controls Drosophila embryonic patterning.
Finally, Chapters 5 and 6 provide examples of how GRN inference can be used to
identify novel genes important for Arabidopsis root development. First, Chapter 5 shows how I
17 feedback mechanism between two root hair genes, GTL1 and RSL4. This network prediction
leads to a mathematical model of GTL1 and RSL4 that illustrates how their expression levels
control proper root hair growth. Further, the model predictions are supported by gene expression
data, giving new insight into root hair growth regulation in Arabidopsis. Chapter 6 provides more
detail on the implementation of this modified version of GENIE3, which I have named
Regression Tree Pipeline for Spatial, Temporal, And Replicate Data (RTP-STAR). Further, we
have incorporated RTP-STAR into a graphical user interface along with a RNAseq processing
pipeline, Tuxedo, and another inference method that uses time course data, GENIST. This
interface, called TuxNet, provides biologists a way to infer GRNs using a combination of steady
state and temporal data without requiring a bioinformatics background. We anticipate that use of
TuxNet in multicellular organisms will identify additional novel genes involved in cell division
18 References
1. Cruz-Ramírez, A. et al. A SCARECROW-RETINOBLASTOMA Protein Network Controls Protective Quiescence in the Arabidopsis Root Stem Cell Organizer. PLoS Biol. 11, e1001724 (2013).
2. Sozzani, R. & Iyer-Pascuzzi, A. Postembryonic control of root meristem growth and
development. Curr. Opin. Plant Biol.17, 7–12 (2014).
3. Fisher, A. P. & Sozzani, R. Uncovering the networks involved in stem cell maintenance
and asymmetric cell division in the Arabidopsis root. Curr. Opin. Plant Biol.29, 38–43 (2016).
4. Benfey, P. N. et al. Root development in Arabidopsis: four mutants with dramatically altered root morphogenesis. Development119, 57–70 (1993).
5. Scheres, B. et al. Mutations affecting the radial organisation of the Arabidopsis root display specific defects throughout the embryonic axis. Development121, 53–62 (1995). 6. Di Laurenzio, L. et al. The SCARECROW gene regulates an asymmetric cell division that
is essential for generating the radial organization of the Arabidopsis root. Cell86, 423– 433 (1996).
7. Helariutta, Y. et al. The SHORT-ROOT Gene Controls Radial Patterning of the Arabidopsis Root through Radial Signaling. Cell101, 555–567 (2000).
8. Nakajima, K., Sena, G., Nawy, T. & Benfey, P. N. Intercellular movement of the putative
transcription factor SHR in root patterning. Nature413, 307–311 (2001).
9. Sena, G., Jung, J. W. & Benfey, P. N. A broad competence to respond to SHORT ROOT
19 a single layer of endodermis in plants. Science316, 421–5 (2007).
11. Gallagher, K. L., Paquette, A. J., Nakajima, K. & Benfey, P. N. Mechanisms Regulating
SHORT-ROOT Intercellular Movement. Curr. Biol.14, 1847–1851 (2004). 12. Gallagher, K. L. & Benfey, P. N. Both the conserved GRAS domain and nuclear
localization are required for SHORT-ROOT movement. Plant J.57, 785–797 (2009). 13. Sozzani, R. et al. Spatiotemporal regulation of cell-cycle genes by SHORTROOT links
patterning and growth. Nature466, 128–132 (2010).
14. Cruz-Ramırez, A. et al. A Bistable Circuit Involving SCARECROW-
RETINOBLASTOMA Integrates Cues to Inform Asymmetric Stem Cell Division. Cell 150, 1002–1015 (2012).
15. Clark, N. M. et al. Tracking transcription factor mobility and interaction in Arabidopsis roots with fluorescence correlation spectroscopy. Elife (2016). doi:10.7554/eLife.14770 16. Clark, N. M., de Luis Balaguer, M. A. & Sozzani, R. Experimental data and
computational modeling link auxin gradient and development in the Arabidopsis root.
Front. Plant Sci.5, 1–7 (2014).
17. Long, Y. et al. Arabidopsis BIRD Zinc Finger Proteins Jointly Stabilize Tissue
Boundaries by Confi ning the Cell Fate Regulator SHORT-ROOT and Contributing to
Fate Specifi cation. Plant Cell27, 1185–1199 (2015).
18. Moreno-Risueno, M. A. et al. Transcriptional control of tissue formation throughout root development. Science (80-. ).350, 426–430 (2015).
19. Aida, M. et al. The PLETHORA genes mediate patterning of the Arabidopsis root stem cell niche. Cell119, 119–120 (2004).
20 Arabidopsis root development. Nature449, 1053–1057 (2007).
21. Sarkar, A. K. et al. Conserved factors regulate signalling in Arabidopsis thaliana shoot and root stem cell organizers. Nature446, 811–814 (2007).
22. Nawy, T. et al. Transcriptional Pro le of the Arabidopsis Root Quiescent Center. Society 17, 1908–1925 (2005).
23. Pi, L. et al. Organizer-Derived WOX5 Signal Maintains Root Columella Stem Cells through Chromatin-Mediated Repression of CDF4 Expression. Dev. Cell33, 576–588 (2015).
24. de Luis Balaguer, M. A. et al. Predicting gene regulatory networks by combining spatial and temporal gene expression data in Arabidopsis root stem cells. Proc. Natl. Acad. Sci. 114, E7632–E7640 (2017).
25. Campos-Ortega, J. A. & Hartenstein, V. A Summary of Drosophila Embryogenesis. in
The Embryonic Development of Drosophila melanogaster 1–9 (2013).
26. Perrimon, N., Pitsouli, C. & Shilo, B.-Z. Signaling mechanisms controlling cell fate and
embryonic patterning. Cold Spring Harb. Perspect. Biol.4, a005975 (2012).
27. Roth, S., Stein, D. & Nüsslein-Volhard, C. A gradient of nuclear localization of the dorsal
protein determines dorsoventral pattern in the Drosophila embryo. Cell59, 1189–1202 (1989).
28. Steward, R., Zusman, S. B., Huang, L. H. & Schedl, P. The dorsal protein is distributed in
a gradient in early drosophila embryos. Cell55, 487–495 (1988).
29. Belvin, M. P., Jin, Y. & Anderson, K. V. Cactus protein degradation mediates Drosophila
dorsal-ventral signaling. Genes Dev9, 783–793 (1995).
21 localization gradient of the dorsal morphogen in Drosophila. Mech. Dev. 60, 109–23 (1996).
31. Reach, M. et al. A gradient of Cactus protein degradation establishes dorsoventral polarity in the Drosophila embryo. Dev. Biol.180, 353–364 (1996).
32. Whalen, A. M. & Steward, R. Dissociation of the dorsal-cactus complex and
phosphorylation of the dorsal protein correlate with the nuclear localization of dorsal. J. Cell Biol.123, 523–534 (1993).
33. Daigneault, J., Klemetsaune, L. & Wasserman, S. A. The IRAK homolog Pelle is the
functional counterpart of IκB kinase in the Drosophila Toll pathway. PLoS One8, e75150 (2013).
34. Reeves, G. T. et al. Dorsal-ventral gene expression in the Drosophila embryo reflects the dynamics and precision of the dorsal nuclear gradient. Dev. Cell22, 544–57 (2012). 35. Carrell, S. N. et al. A facilitated diffusion mechanism establishes the Drosophila Dorsal
gradient. Development144, 4450–4461 (2017).
36. Liberman, L. M., Reeves, G. T. & Stathopoulos, A. Quantitative imaging of the Dorsal
nuclear gradient reveals limitations to threshold-dependent patterning in Drosophila. Proc. Natl. Acad. Sci. U. S. A.106, 22317–22 (2009).
37. Rigler, R., Mets, U., Widengren, J. & Kask, P. Fluorescence correlation spectroscopy with
high count rate and low background: analysis of translational diffusion. Eur. Biophys. J. 22, 169–175 (1993).
38. Qian, H. & Elson, E. L. Distribution of molecular aggregation by analysis of fluctuation
moments. PNAS87, 5479–5483 (1990).
22 EGFP In Vivo by Fluorescence Fluctuation Spectroscopy. Biophys. J.82, 133–144 (2002). 40. Digman, M. A. et al. Measuring Fast Dynamics in Solutions and Cells with a Laser
Scanning Microscope. Biophys. J.89, 1317–1327 (2005).
41. Digman, M. A. et al. Fluctuation Correlation Spectroscopy with a Laser-Scanning Microscope: Exploiting the Hidden Time Structure. Biophys. J.88, L33–L36 (2005). 42. Brown, C. M. et al. Raster image correlation spectroscopy (RICS) for measuring fast
protein dynamics and concentrations with a commercial laser scanning confocal
microscope. J. Microsc.229, 78–91 (2008).
43. Digman, M. A. & Gratton, E. Imaging Barriers to Diffusion by Pair Correlation Functions.
Biophys. J.97, 665–673 (2009).
44. Hinde, E., Cardarelli, F., Digman, M. A. & Gratton, E. In vivo pair correlation analysis of
EGFP intranuclear diffusion reveals DNA-dependent molecular flow. PNAS107, 16560– 16565 (2010).
45. Hinde, E. et al. The Impact of Mitotic versus Interphase Chromatin Architecture on the Molecular Flow of EGFP by Pair Correlation Analysis. Biophys. J.100, 1829–1836 (2011).
46. Malacrida, L., Hedde, P. N., Ranjit, S., Cardarelli, F. & Gratton, E. Visualization of
barriers and obstacles to molecular diffusion in live cells by spatial pair-cross-correlation
in two dimensions. Biomed. Opt. Express9, 303 (2018).
47. Digman, M. A., Dalal, R., Horwitz, A. F. & Gratton, E. Mapping the Number of
Molecules and Brightness in the Laser Scanning Microscope. Biophys. J.94, 2320–2332 (2008).
23 Complexes in Living Cells from Laser Scanning Confocal Image Sequences by the Cross
Correlation Raster Image Spectroscopy Method. Biophys. J.96, 707–716 (2009).
49. Digman, M. A., Wiseman, P. W., Choi, C., Horwitz, A. R. & Gratton, E. Stoichiometry of
molecular complexes at adhesions in living cells. PNAS106, 2170–2175 (2009). 50. Rossow, M. J., Sasaki, J. M., Digman, M. A. & Gratton, E. Raster image correlation
spectroscopy in live cells. Nat. Protoc.5, 1761–1774 (2010).
51. Vetri, V. et al. Fluctuation Methods To Study Protein Aggregation in Live Cells : Concanavalin A Oligomers Formation. Biophys. J. 100, 774–783 (2011).
52. Zhou, S. et al. Free extracellular diffusion creates the Dpp morphogen gradient of the Drosophila wing disc. Curr. Biol.22, 668–675 (2012).
53. Hecker, M., Lambeck, S., Toepfer, S., van Someren, E. & Guthke, R. Gene regulatory
network inference: data integration in dynamic models-a review. Biosystems.96, 86–103 (2009).
54. Krouk, G., Lingeman, J., Colon, A. M., Coruzzi, G. & Shasha, D. Gene regulatory
networks in plants: Learning causality from time and perturbation. Genome Biol.14, (2013).
55. Stuart, J. M., Segal, E., Koller, D. & Kim, S. K. R ESEARCH A RTICLES A
Gene-Coexpression Network. October302, 249–255 (2003).
24 R. Soc. Interface5, S85–S94 (2008).
59. Chen, K.-C., Wang, T.-Y., Tseng, H.-H., Huang, C.-Y. F. & Kao, C.-Y. A stochastic
differential equation model for quantifying transcriptional regulatory network in
Saccharomyces cerevisiae. Bioinformatics21, 2883–2890 (2005).
60. Rohlf, T. & Bornholdt, S. Criticality in random threshold networks: Annealed
approximation and beyond. Phys. A Stat. Mech. its Appl.310, 245–259 (2002). 61. Geurts, P., Irrthum, A. & Wehenkel, L. Supervised learning with decision-tree based
methods in computational and systems biology. Mol. Biosyst.5, 1593–1605 (2009). 62. Huynh-Thu, V. A., Irrthum, A., Wehenkel, L. & Geurts, P. Inferring regulatory networks
from expression data using tree-based methods. PLoS One5, e12776 (2010).
63. Huynh-Thu, V. A., Wehenkel, L. & Geurts, P. Gene Network Inference. Bioinformatics 9–32 (2013). doi:10.1007/978-3-642-45161-4
64. Efroni, I., Ip, P. L., Nawy, T., Mello, A. & Birnbaum, K. D. Quantification of cell identity
from single-cell gene expression profiles. Genome Biol.16, 1–12 (2015).
65. Shapiro, E., Biezuner, T. & Linnarsson, S. Single-cell sequencing-based technologies will
revolutionize whole-organism science. Nat. Rev. Genet.14, 618–630 (2013). 66. Zou, M. & Conzen, S. D. A new dynamic Bayesian network ( DBN ) approach for
identifying gene regulatory networks from time course microarray data. Bioinformatics 21, 71–79 (2005).
67. Koschützki, D. & Schreiber, F. Centrality analysis methods for biological networks and
their application to gene regulatory networks. Gene Regul. Syst. Bio.2008, 193–201 (2008).
25 eukaryotic protein-interaction networks. Mol. Biol. Evol.22, 803–806 (2005).
69. Barabasi, A. L. & Oltvai, Z. N. Network biology: Understanding the cell’s functional
organization [Review]. Nat. Rev. Genet.5, 101–113 (2004). 70. Broido, A. D. & Clauset, A. Scale-free networks are rare. (2018).
71. Alon, U. Network motifs: theory and experimental approaches. Nat. Rev. Genet.8, 450– 461 (2007).
72. Ingram, P. J., Stumpf, M. P. H. & Stark, J. Network motifs: Structure does not determine
function. BMC Genomics7, 1–12 (2006).
73. Milo, R., Shen-Orr, S., Itzkovitz, S. & Kashtan, N. Network Motif: Simple Building
Blocks of Complex Networks. Science (80-. ).298, 298. (2002).
74. Montes, R. A. C. et al. ARACNe-based inference, using curated microarray data, of Arabidopsis thaliana root transcriptional regulatory networks. BMC Plant Biol.14, (2014). 75. Savage, N. Saint et al. A mutual support mechanism through intercellular movement of
CAPRICE and GLABRA3 can pattern the Arabidopsis root epidermis. PLoS Biol.6, 1899–1909 (2008).
76. Shibata, M. et al. GTL1 and DF1 regulate root hair growth through transcriptional repression of ROOT HAIR DEFECTIVE 6-LIKE 4 in Arabidopsis. Development145, dev159707 (2018).
26 Chapter 2 - Tracking transcription factor mobility and interaction in Arabidopsis roots
with fluorescence correlation spectroscopy
Clark, N.M., Hinde, E., Winter, C.M., Fisher, A.P., Crosti, G., Blilou, I., Gratton, E., Benfey,
27 Contribution
The research article “Tracking transcription factor mobility and interaction in
Arabidopsis roots with fluorescence correlation spectroscopy” was published in the journal eLife
in 2016. As first author on this publication, I designed and performed all of the experiments
(with the exception of measuring SHR movement in the QC (Figure 1D)), analyzed all of the
experimental data, built and analyzed the mathematical model, prepared all of the figures, and