| INVESTIGATION
Discovering Complete Quasispecies in
Bacterial Genomes
Frederic Bertels,1Chaitanya S. Gokhale, and Arne Traulsen
Department of Evolutionary Theory, Max Planck Institute for Evolutionary Biology, 24306 Plön, Germany
ABSTRACTMobile genetic elements can be found in almost all genomes. Possibly the most common nonautonomous mobile genetic elements in bacteria arerepetitiveextragenicpalindromic doublets forming hairpins (REPINs) that can occur hundreds of times within a genome. The sum of all REPINs in a genome can be viewed as an evolving population because REPINs replicate and mutate. In contrast to most other biological populations, we know the exact composition of the REPIN population and the sequence of each member of the population. Here, we model the evolution of REPINs as quasispecies. We fit our quasispecies model to 10 different REPIN populations from 10 different bacterial strains and estimate effective duplication rates. Our estimated duplication rates range from 531029to 1531029duplications per bacterial generation per REPIN. The small range and the low level of the REPIN duplication rates suggest a universal trade-off between the survival of the REPIN population and the reduction of the mutational load for the host genome. The REPIN populations we investigated also possess features typical of other natural populations. One population shows hallmarks of a population that is going extinct, another population seems to be growing in size, and we also see an example of competition between two REPIN populations.
KEYWORDSREP sequences; mobile genetic elements; evolution; bacteria; quasispecies
R
EPETITIVE sequences are common in most bacterial ge-nomes, but rare compared to their prevalence in most eukaryotic genomes (Versalovicet al.1991; Jurkaet al.2007). A large proportion of repetitive sequences in bacterial genomes are the result of self-replicating DNA sequences. These sequences usually encode an enzyme called a transposase that specifically copies its own sequence (Mahillon and Chandler 1998). There are also repetitive sequences that do not encode a transposase themselves, but are copied by a transposase that is encoded elsewhere in the genome. These elements are referred to asminiature inverted repeat transposable elements (MITEs) (Wessler et al. 1995). MITEs were first described in plant genomes (Bureau and Wessler 1994) and later also in bacteria (Oggioni and Claverys 1999). Recently, it has been shown that repetitive extragenic palindromic (REP) sequences (Higginset al.
1982) or more specifically REP doublets forming hairpins (REPINs) (Bertels and Rainey 2011b), one of the most abun-dant repeat families in bacteria, are also MITEs (Nunvaret al. 2010; Bertels and Rainey 2011a,b; Ton-Hoanget al.2012).
REP sequences are25-bp-long, highly abundant se-quences in bacterial genomes (Higginset al.1982; Aranda-Olmedoet al.2002; Silbyet al.2009). They contain a short imperfect palindromic sequence that can form hairpins in single-stranded DNA or RNA. REP sequences mostly occur in noncoding DNA between genes and are part of REPINs. REPINs in mostPseudomonasstrains consist of two REP se-quences in inverted orientation separated by a highly diverse nucleotide sequence (Bertels and Rainey 2011b). REPINs are a replicative unit and are mobilized byREP-associated ty ro-sinetransposases (RAYTs) (Nunvaret al.2010; Bertels and Rainey 2011b; Ton-Hoanget al.2012). Although the struc-ture of REPINs inPseudomonasis well defined, for REPINs in Escherichia colithere has not been an extensive study on what exactly comprises the replicative unit. Nevertheless, RAYTs in E. colihave been shown to bind to REP sequences and cleave DNA once they are bound (Messinget al.2012; Ton-Hoanget al. 2012). Thus, in a fashion similar to IS200sequences (Barabas et al.2008; Ton-Hoanget al.2010) and almost every other known insertion sequence (Mahillon and Chandler 1998),
Copyright © 2017 by the Genetics Society of America doi:https://doi.org/10.1534/genetics.117.201160
Manuscript received February 13, 2017; accepted for publication June 8, 2017; published Early Online June 19, 2017.
Available freely online through the author-supported open access option.
Supplemental material is available online atwww.genetics.org/lookup/suppl/doi:10. 1534/genetics.117.201160/-/DC1.
1Corresponding author: Department of Evolutionary Theory, Max Planck Institute
RAYTs presumably transpose REPINs by cutting them out of the genome and pasting them into another part of the ge-nome. This implies that REPINs do not acquire additional mutations as they are copied, which is an important insight for modeling REPIN evolution.
The occurrence of REP sequences and associated functions have been described in many different bacterial genomes (Higginset al.1982; Aranda-Olmedoet al.2002; Silbyet al. 2009). REP evolution has not been studied in detail before the description of REPINs (Bertels and Rainey 2011a,b) and nothing is known about the duplication rates of REPINs. Although we know that closely relatedE. colistrains contain varying numbers of REP sequences, this may not be a direct result of replication. Instead it may be more likely that it is a consequence of the extremely dynamic genome composition ofE. coli(Touchonet al.2009), where REP sequences get deleted or inserted together with other parts of the genome. However, the lack of evidence for novel REPIN insertions probably means that duplication rates are low, despite the presence of hundreds of REPINs in some genomes (Bertels and Rainey 2011b).
As it is difficult to study the evolution of the complete REPIN sequence due to the highly diverse loop region (which is probably strongly affected by recombination), we model the evolution of the most conserved 25 bp at each end of the REPIN. The beauty of studying REPINs in bacterial genomes is that we know the exact composition of the population at the time of genome sequencing, something that is impossible to achieve for almost any other population study.
We model the evolution of REPINs with a quasispecies model. To infer duplication rates, wefirstfit the equilibrium of our quasispecies model for a REPIN population from Pseudo-monasfluorescensSBW25 and later for nine other bacterial genomes. Our results show that despite the large divergence between the bacterial strains, our inferred effective duplica-tion rates are very similar and very low. All rates fall into a narrow margin between one REPIN duplication in653106
and 2083106 host divisions. Hence, if a bacterium were to
divide every 40 min, it would take5000 years for a specific REPIN duplication tofix in the population. The astonishing rarity of these events may explain the lack of evidence for novel REPIN insertions in bacterial genomes.
Materials and Methods
Quasispecies model
The quasispecies model describes the mutation–selection bal-ance of a set of similar sequences that evolve on a fitness landscape. Sequences with highfitness leave many offspring, sequences with low fitness leave few offspring. Thefitness landscape is traversed by acquiring mutations (Eigen 1971; Eigen and Schuster 1977; Nowak 1992).
The quasispecies model has been applied previously, mostly to model viral populations (Seifertet al.2015; Domingo and Schuster 2016). Here, we model REPIN sequences that mutate
and duplicate: the fitness in the quasispecies model corre-sponds to the REPIN duplication rate, and the model’s muta-tion rate to the genome mutamuta-tion rate (Figure 1). We assume that the REPIN population in our genome is a quasispecies in equilibrium. The most abundant sequence in our population is our master sequence. With increasing genetic distance to the master sequence,fitness changes. For our model, we assume five discrete mutation classes (Supplemental Material,File S10). The zeroth class contains the master sequence. Se-quences differing in one, two, or three positions are in the next three classes. All remaining sequences are in the fourth mutation class. The frequencies of the sequences belonging to each of these classes i are given by xi:The population
evolves to a mutation–selection balance as described by the standard quasispecies equation (Page and Nowak 2002; Bull et al.2005)
_
xi¼
Xn
j¼0
xjfjqji2xif: (1)
In our case,nequals 4. Thefitness of sequences belonging to each classjis given byfjand the averagefitness of the
pop-ulation is given byf¼Pni¼0xifi:The probability that a
se-quence from classjmutates into classiis given byqji:In our
model, sequences can only acquire a single mutation per time step. Hence,Qis a tridiagonal matrix with nonzero entries in the main diagonal (no mutation), the first diagonal above (sequence acquires an additional mutation), and thefirst di-agonal below (sequence loses a mutation and reverts to the previous class). For a mutation ratemand a sequence length L, the probability of transitioning to the next mutation class iþ1 ismL2ðimÞ1=3 and to the previous mutation classi21 isðimÞ1=3:For the fourth mutation class, we assume a back mutation rate of zero. We also assume that the mutation rate of REPINs only depends on the host mutation rate. Mutations that occur during the duplication process are assumed to be negligible.
Parameterizing the quasispecies model
We set thefitness of the highest mutation class to one:f4 ¼1:
For a given set of equilibrium sequence frequencies, we can then calculate the relativefitness of the remaining four mu-tation classes for a given mumu-tation rate (seeFile S6andFile S7). For all our bacteria we assume a host mutation rate of 8:9310211;which was inferred forE. coli (Wielgosset al.
2011). The duplication ratesliforfitness valuesfiare then
li¼fi21: (2)
Stochastic simulations
evolution for the genome mutation rate, we adjusted our fitness values tofit a mutation rate of 1024:With the new
mutation rate, each discrete time step corresponds to g¼1024=8:9310211106bacterial generations. The
equi-librium frequencies for the new mutation rate remain similar if we scale up thefitness values toðfiÞg;which holds as long as gu1 (File S8).
We start the simulation with a clonal population of the master sequence at carrying capacity, which is set to the number of REPINs observed in the genome. The number of offspring each sequence leaves in each generation is equal to the sequence’sfitness. If the number of offspring exceeds the carrying capacity, a random selection of the same size as the carrying capacity survives to the next time point. We simu-lated a total of 105generations.
To infer confidence intervals for ourfitness estimates, we computedfitness values from sequence frequencies at various time points during the simulation. We sampled the sequence frequencies of each mutation class every 100 time steps, starting from time point 1000 and ending at time step 20,000 in our simulations.
We repeated each simulation 100 times and measured the proportion of simulations where the zeroth mutation class did not persist (i.e., the master sequence had completely decayed).
Determining REPIN populations
We extracted REPIN populations from 10 bacterial genomes in the following manner: For each of the genomes we deter-mined the most common 25-bp-long sequence. We then re-cursively searched the entire genome for all sequences that have a Hamming distance of up to two to all identified sequences until no more sequences were found. We call these sequences REP sequences. For all REP sequences, we deter-mined whether they were part of a sequence cluster by checking whether there were any additional occurrences in a vicinity of 130 bp. From these sequence clusters we extracted REPINs. REPINs consist of two adjacent REP sequences that are found in opposite directions (one on the positive and one on the negative DNA strand, also called inverted repeats) in the DNA sequence. The REPINs we found were extracted and joined together. REP sequences found as direct repeats or as singlets in the genome were also extracted (as single se-quences). We added another 25 bp of adenine nucleotides at the end of each REP singlet in our data to make them easily comparable with REPINs. Hence the Hamming distance be-tween REP singlet and REP doublet is at least 25.
Clustering REPIN sequences
REPIN populations can be represented as sequence networks. In these networks, each node represents a sequence. An edge between nodes exists if the Hamming difference between the sequence pair is one. Because REPIN populations in Pseudo-monas do not always evolve on a single peak due to the presence of multiple RAYTs (transposases) in the genome, we extracted subpopulations clustered around the master
sequence. We determined these subpopulations for all Pseu-domonasstrains by applying a Markov clustering algorithm implemented in the MCL package (van Dongen 2000) with the inflation parameter set to 1.2 to the sequence network. The MCL algorithm simulates random walks on a stochastic graph by alternating between expansion and inflation oper-ations, where larger inflation parameters will lead to more fragmented networks.
We used the largest REPIN cluster for our analyses. Since these clusters exclude decayed sequences far from the master sequences, we also included all sequences with a Hamming distance of up to two to any sequence in the cluster. Of the sequences identified in the last step, we only included in-stances that occurred less than three times in the genome. Sequences that occur more than three times in the genome are likely to have been duplicated by other RAYTs.
Inferring an error threshold
The error threshold defines a critical point in a quasispecies where, with the givenfitness values and mutation rate, it is impossible to maintain the master sequence for a single peakedfitness landscape. Here we deviate slightly from this definition as we define the error threshold as the point where the master sequence cannot be maintained at a relative frequency of .1%. To determine the duplication rate at which we reach our error threshold, we reduced allfitness values in decrements of 1310212:As soon as one of thefive
fitness parameters reaches one, this parameter will remain constant for the remainder of the procedure. We performed this procedure for the fitness landscape of each species separately.
Data availability
All genomes are publicly available on GenBank (https:// www.ncbi.nlm.nih.gov/genbank/) under the accession num-bers listed in Table 1.
Results and Discussion
REPINs in P.fluorescens SBW25
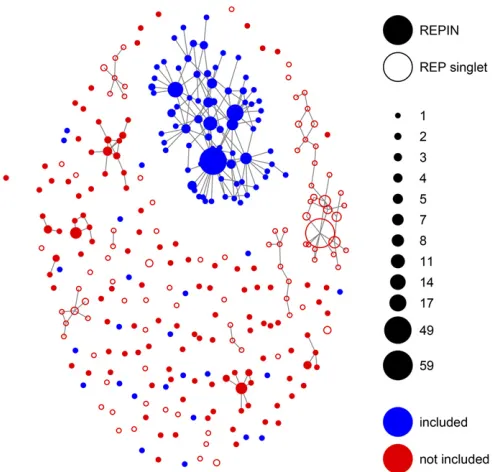
In P. fluorescens SBW25, REPINs consist of two inverted highly conserved sequences that are 25 bp in length and are separated by a sequence of varying length that shows low levels of conservation (Bertels and Rainey 2011a,b). The processes that lead to the varying levels of conservation in REPINs are not well understood. Hence, we focus our anal-ysis only on the most conserved 25 bpflanking the REPIN. These sequences were discovered a long time ago inE. coli and have been called REP sequences (Sternet al.1984). The most common 25-bp-long sequence occurs 265 times in the SBW25 genome and is usually part of a REPIN (Bertels and Rainey 2011b). If we allow for nucleotide changes in the REP sequence, we end up with a REP population that contains 932 REP sequences. For all these 932 sequences, we deter-mined whether they were part of a REPIN or not and dis-played the resulting sequences as a sequence network and (Figure 2).
The population network in Figure 2 has many sequence hubs distantly related and not connected to the master se-quence. Instead of a very rugged activity landscape of a single RAYT (the transposase responsible for duplicating REPINs), we hypothesize that it is more likely that these hubs were manifested by the concurrent activities of multiple RAYT transposases (the SBW25 genome contains three RAYT genes). As it is impossible to accurately model this complexity for small REPIN populations, we decided to reduce the REPIN population to all sequences that are part of the largest cluster as well as all sequences that are at most 2-bp different from any sequence that is part of the cluster.
The“included”subpopulation selected in Figure 2 has 243 members. We model this subpopulation as a quasispecies, withfive sequence classes, that are 0, 1, 2, 3, and.3 mu-tations away from the master sequence. Modelingfive mu-tation classes is optimal for our data sets, as it represents a trade-off between robustness and accuracy of the inferred fitness values (seeFile S10). To inferfitness values for our quasispecies model in SBW25, we assume that the popula-tion is in equilibrium and the frequencies of the sequences we observe are steady state frequencies (Table 2).
The quasispecies equation provides us with a set offitness values that perfectly recapitulate the observed frequencies for infinitely large populations (Figure 3A). However, REPIN populations are relatively small, which means that popula-tion size will have a strong effect during REPIN evolupopula-tion. To estimate stochastic effects, we used the calculated fitness parameters for each mutation class to perform a stochastic simulation with a maximum of 243 individuals (Figure 3B). Our simulation shows that the distributions of the mutation classes are wide, particularly for the master sequence, which is an effect of the small population size (Figure 3C).
Inferred duplication rates of REPINs are low
The rate at which duplications occur can be calculated from the inferredfitness values (see Equation 2). The duplica-tion rate we inferred for the master sequence in SBW25 is 10:931029per generation and per sequence. However, this
means that for the third mutation class, we infer negative duplication rates (Table 2). Unless there is an active deletion process for these mutation classes, these duplication rates are unlikely to be accurate. Alternatively, it is possible that mem-bers of the fourth mutation class are more likely to replicate than members of the third mutation class. This could be true as it is possible that these sequences are also recognized by a second RAYT transposase in the SBW25 genome. To alleviate
Figure 1 Exemplar results for a quasispecies model. For a mutation rate of m¼8:9310211; and thefitnesses as given in Table 2 (1 + scaled duplication rate), we illustrate the equilibrium distribution of the relative frequencies ofP.fluorescensSBW25 REPINs. The radii of the circles in-dicate the duplication rate (see Equation 2). Note that the actualfitness differences are extremely minute at the level of 1029:The cartoon merely illustrates the architecture of thefitness landscape. The mutation proba-bilities are given byðqijÞwhile self-replication occurs with probabilityqii: Table 1 List of accession numbers for genomes used in this study
Species name NCBI accession no. P. syringaepv.tomatoDC3000 NC_004632.1 P. synxanthaBG33R CM001514
P.fluorescensA506 NC_017911
P.fluorescensSBW25 NC_012660.1
P. putidaGB1 NC_010322.1
E. coli536 NC_008253.1
E. coliK-12 MG1655 CP014225.1 E. coliUTI89 NC_007946.1 E. coliB REL606 NC_012967.1 E. coliUMN026 NC_011751.1
this problem, we can scale up all mutation classes so that the lowestfitness is one. This scaling does not affect the equilib-rium frequencies of the different mutation classes. The rescaledfitness values result in a higher duplication rate of the master sequence’s mutation class of 11:331029
instead of 10:931029(Table 2).
Our data also show that the duplication rates of mutation class 4 is very lowð0:431029Þcompared to that of mutation
classes 0, 1, and 2 ð11:331029 to 7:131029Þ:This raises
the possibility that these values are not significantly different from zero. To test this possibility, we inferred duplication rates for mutation class frequencies at 200 time points during our simulation. We then inferred fitness values for each of these 200 samples, which allowed us to determine confi -dence intervals for our duplication rates (Table 2). The con-fidence intervals show that both mutation classes 3 and 4 are not significantly different from zero and may not actively be duplicated in the genome.
To understand how low the inferred mutation rates are, we can calculate how long it would take for a single REPIN duplication to spread through a large bacterial population. If we assume one cell division takes 40 min and novel REPIN insertions to be selectively neutral, then it would take 7000 years until a novel REPIN master sequence fixes in the SBW25 population. This would explain, why, to our knowledge, there is no report of novel REPIN inser-tions within genomes of experimental SBW25 (or other
bacterial) populations. It may also explain why REPINs can be maintained for long times within a genome without being selected against. Due to the rarity of duplication events, the negativefitness effects resulting from transposition [e.g., transposition is likely to disrupt genes because88% of the SBW25 genome are coding regions (Silbyet al.2009)] are probably negligible.
Limitations of our quasispecies model
As for any mathematical model of a complex biological system there are also limitations for our quasispecies model.
For example, we cannot inferfitness values for any specific sequence except for the master sequence. For all other mu-tation classes, our model only infers averagefitness values. Across one mutation class there may be many reasons for why the fitness of one sequence may be different to another sequence’s fitness. For example, biochemical interactions could make it more likely that some sequences within a mu-tation class are more likely to duplicate than others.
Another complication not taken into account by our model is the fact that the SBW25 genome contains three different RAYT genes, each associated with a specific REPIN (Bertels and Rainey 2011b). Although associated with three distinct master sequences, these three RAYT genes may also trans-pose a set of sequences in parallel, which could lead to a more ruggedfitness landscape.
Furthermore, our quasispecies model only estimates ef-fective duplication rates, which is the fraction of duplications that do not incur a significantfitness cost to the host and are therefore selected against at the level of the host. The fact that we only observe a fraction of the duplications is evident in the almost exclusive presence of REPINs in extragenic space (Bertels and Rainey 2011b). This is presumably because a REPIN insertion into a gene would immediately destroy the open reading frame of the gene, which would have detrimen-talfitness effects for the host. To estimate the proportion of the genome that is permissive of REPIN insertion, we can rely on recent estimates of neutrally evolving sites in the extra-genic space of a bacterial genome (Thorpeet al.2016). If these estimates are similar among bacteria and also hold for REPIN insertions, then it is safe for REPINs to transpose into4% of the genome. If there is no mechanism to in-crease the likelihood of inserting into neutral sites [there is some evidence that such mechanisms may exist (Bertels and Rainey 2011a)], then the true duplication rate would be 25 times higher than the one we inferred with our quasispecies model.
The inferred duplication rates also depend on the choice of the mutation rate. A higher mutation rate will lead to higher duplication rates and vice versa. The mutation rate we chose is conservative at the lower end of the scale forE. coli. Other studies have inferred higher mutation rates forE. colias well as most other bacteria (Lynch et al.2016). However, these measurements determine mutation rates for one particular strain with a certain genetic background at one particular point in time. Over evolutionary timescales the mutation rate
of a particular strain can change significantly (Wielgosset al. 2013). This may also be true for duplication rates. So the inferred values should serve as an orientation to compare REPIN populations with each other, but also to get an idea about the approximate scale of the duplication rates.
REPIN duplication rates in other bacteria
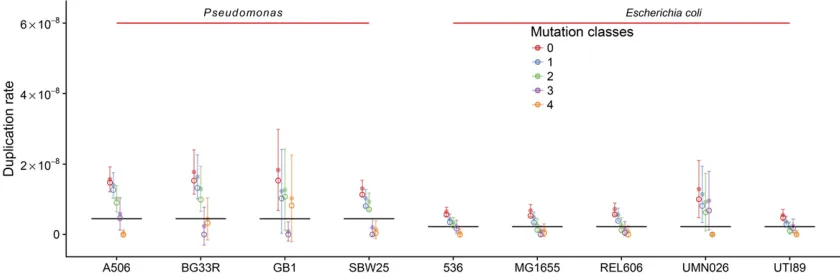
We also calculated duplication rates for four more Pseudomo-nasstrains andfive moreE. colistrains. TheE. colistrains we chose were quite distantly related to each other and belong to phylogroups A, B2, and D. ThePseudomonasstrains we chose are very distantly related to each other as well as toE. coli (Figure 4A). To get an idea about how distantly related the individual strains are, we gauge the time that has passed since the strains diverged by measuring the 16S ribo-somal DNA (rDNA) divergence (Ochman and Wilson 1987; Ochmanet al.1999). Ochmanet al.(1999) estimated that it takes50 MY for the 16S rDNA to diverge by 1%. According to these estimates, the most recent common ancestor (MRCA) of theE. colistrains lived15 MYA. The MRCA of the Pseudomonas strains lived 100 MYA and E. coli and Pseudomonasdiverged600 MYA. Hence, the REPIN popu-lations in our selected bacteria have been evolving indepen-dently of each other for a very long time. RAYTs, the genes that mobilize REPINs in E. coliand Pseudomonas, are also very different inE. coliandPseudomonasand belong to two different gene classes (Bertels and Rainey 2011b). There is no detectable sequence conservation in the nucleotide se-quence and very little sese-quence conservation in the amino acid sequence apart from the catalytic center of the protein.
Divergent bacteria have divergent REPIN populations
The divergence between the different bacterial strains is also reflected in the similarity between the most abundant 25-bp-long sequences (REP sequences). The most common se-quences inE. coliare almost all identical, except for that of UTI89, where the most common sequence is shifted by 1 nt with respect to the otherE. colisequences (File S2). But all E. coliREP sequences are very different to all of the Pseudo-monasREP sequences. Among thePseudomonasstrains, the REP sequences from P.fluorescens A506 and P.fluorescens BG33R are almost identical (again shifted by 1 nt), which are also the most closely related strains. Despite this sim-ilarity, the population sizes and structures are completely
different between the two strains (see population networks inFile S3). This observation highlights the opportunity to study the evolution of entire populations. As bacterial populations diverge, the REPIN populations diverge. In one bacterial lineage, a certain REPIN population may prosper whereas in another, it declines.
Not only do REPINs differ in their sequences, the popula-tions inPseudomonasandE. colialso differ in the population structure. In contrast toPseudomonas, REPIN populations in E. coliform relatively simple networks, consistent with a sin-glefitness peak (see sequence networks inFile S3). The dif-ferences in the complexity of the sequence network may stem from the fact that there is only a single RAYT gene encoded in E. coli, but there are usually multiple RAYT genes in Pseudo-monas (Bertels and Rainey 2011b). If we assume that the activities of multiple RAYT genes can interfere with each other, then generalist sequences that can be moved by mul-tiple RAYT genes will evolve, and give rise to a complex se-quence network.
Although the divergence betweenE. coliandPseudomonas is very large and the differences between the structure of the REPIN (File S4; the REPIN is symmetric inPseudomonasbut is asymmetric inE. coli) and the corresponding transposase are tremendous (Bertels and Rainey 2011b), the inferred REPIN population sizes are surprisingly similar (Figure 4B). REPIN populations in E. coli range between 165 (UMN026) and 242 (MG1655) members. REPIN populations inPseudomonas are spread more widely and range between 23 (DC3000) and 309 (A506) members. The population size has a strong effect on whether the master sequence can persist for long times within the population, or whether it will die out. Our simulations show that among allPseudomonasREPIN populations, only that of P. fluorescens A506 and P. fluorescens SBW25 are large enough to persist over long periods of time. InE. coli, in contrast, most populations persist over 105time steps (Figure 4C).
Small REPIN populations in Pseudomonas
P. syringaeDC3000 is different from the otherPseudomonas strains. The REPIN population is particularly small (only 23 members), which leads to a particularly unstable REPIN population (Figure 4C). Another notable feature of the DC3000 REPIN population is that a large part of the repetitive sequences does not form REPINs (File S4). Furthermore, the only RAYT in DC3000 is not flanked by the most common
Table 2 Inferred REPIN duplication rates inP.fluorescensSBW25
Mutation class
Inferred duplication
rateli(31029)a Scaled duplicationratel~i (31029)b Mean duplicationrate (simulation) rate (simulation)SD duplication
0 10.9 11.3 13.1 2.4
1 7.6 8.1 10.3 2.5
2 6.7 7.1 9.4 2.4
3 20.4 0 2.0 2.5
4 0.0 0.4 1.4 2.5
aWe identified the master sequence 59-ATGTGGGAGGGGGCTTGCCCCCGAT-39in the data and inferred the frequency of the different mutation
classes. We use the equilibrium of our quasispecies model to calculate the associatedfitness valuesfiand setf4to 1, whereliisfi21: bThe scaled duplication rate is:~l
25-bp-long sequence in the genome, which is the case for all other population we have analyzed (File S2) and has been a defining feature of the REPIN–RAYT system (Bertels and Rainey 2011b). This suggests to us that the DC3000 REPIN population may be a dead or dying population, which is slowly disintegrating due to genetic drift. Hence the popula-tion is probably not in equilibrium, which means that the inferred duplication rates may not be accurate.
The populations found in BG33R and GB1 are also too small to persist for extended periods of time. However, in contrast to DC3000, they are also the two populations with the highest inferred duplication rate, and in both cases the most common 25-bp-long sequence doesflank a RAYT gene and both pop-ulations consist mostly of REPINs (File S4). Hence there is no sign of population disintegration. High duplication rates are likely to evolve for small populations, because the mutation load is comparatively small. This suggests that these two populations may be growing.
REPIN populations in competition
The population network in BG33R is particularly interesting as it contains two similar sized populations (126 and 147
members) and the REPIN master sequence consists, in both cases, of two identical 25-mers that both occur exactly 160 times in the genome and differ in 5 nt positions (i.e., the REPIN master sequence differs in 10 positions). When inferring thefitness of the master sequence for both populations, then we also get very similar and extremely high duplication rates of1531029. One would expect the evolution of high
du-plication rates not only for growing populations but also for populations that are competing for space in the genome. With space we are referring to regions in the genome that, when inserted into, incur nofitness cost.
REPIN populations in E. coli
InE. coli, the most abundant 25-bp-long sequences do not form symmetric REPINs as observed in Pseudomonas (File S4). This could lead us to the conclusion, as for DC3000, that E. coli does not contain REPIN populations that are alive. However, there are a few differences to DC3000. First of all, RAYTs inE. coli are very distantly related to RAYTs in mostPseudomonas, which leaves the possibility that REPINs in E. coli are structured differently to REPINs in Pseudomonas. Second, there is not a single instance of a REPIN in any of the
Figure 3 Inferred and observed steady state REPIN frequencies inP.fluorescensSBW25. (A) The observed frequencies of each mutation class are identical to the equilibrium frequencies for our quasispecies model at a mutation rate of 8:9310211(observed). We adjusted time to allow us to do simulations at a mutation rate of 1024;i.e., each time step lasts long enough to allow for1024mutations to occur for an underlying mutation rate of 8:9310211 (adjusted quasispecies). The resulting adjusted quasispecies equilibria agree almost perfectly with the observed frequencies. A simulation of a simulation (105 generations) with the samefitness values allows us to infer the variation of these frequencies (simulated). (B) Relative frequencies obtained from the simulation using the adjustedfitness values for 105generations. (C) Density plot of the relative frequencies of the mutation classes from our simulation.
fiveE. colipopulations. IfE. coliREPIN populations were dying populations, then all populations in E. coliwould already be dead. This either happened15 MYA, when the last common ancestor of thefiveE. colistrains lived, or it happened recently simultaneously. If it happened 15 MYA, then we would expect the population to have vanished by now and not consist of up to 242 members. It also seems unlikely that it happened recently in all strains at the same time and within the same time frame. Finally, the most common 25-bp-long sequences in the five strains does still flank the RAYT gene, something that is not the case for DC3000 but is for all other REPIN populations in our study (File S2). Hence REPIN populations inE. coli, in con-trast to DC3000, are very likely alive and replicating.
REPIN duplication rate is close to the error threshold
The duplication rates of the master sequences are in the range of 531029 and 1531029: Considering that the rates were
inferred for very different species and the species contain very different transposases that disperse the REPIN populations, these values are very similar. This may be due to at least two reasons. First, the duplication rate is very close to its lower possible limit, because the number of mutations that occur on average between two duplication events is between 0.29 and 0.45 for 50-bp-long REPINs inPseudomonas, and between 0.22 and 0.46 for 25-bp REP(IN)s inE. coli. If one or more mutations occur between consecutive duplication events then it is im-possible to maintain a master sequence; this occurs when du-plication rates fall below 2:231029(E. coli) or 4:431029for
Pseudomonas(Figure 5 andFile S5). Hence, if REPIN duplica-tion rates were much lower, then REPIN populaduplica-tions would very quickly go extinct.
Second, each duplication event is equivalent to an insertion introduced at a random position in the genome. Therefore, an increase in the duplication rate would also increase the
mutational load for the host organism. Hence, similar to selection for replicationfidelity (Lynchet al.2016), selection will favor organisms with decreased REPIN duplication rates. The REPIN duplication rates we inferred are probably the result of these two opposing forces.
Maintenance of the REPIN–RAYT system
The low duplication rate we inferred for all REPIN populations also suggests that REPIN sequences have been part of bacterial genomes for a very long time. This again raises the question of how and why they are maintained. There are two explana-tions: (1) the REPIN–RAYT system is frequently transmitted horizontally, or (2) the REPIN–RAYT system provides a ben-efit to the host organism (Bichselet al.2013).
It is possible that the REPIN–RAYT system does get horizon-tally transferred from time to time. However, horizontal trans-fers are likely to be rare, because to establish a novel REPIN population in a new host both the transposase (RAYT) and the REPIN have to be transferred. This process is probably facili-tated by the fact that RAYTs are usuallyflanked by REPINs (Bertels and Rainey 2011b). However, the rarity of these events is consistent with the observation that the establishment of a population that is as diverse as the REPIN population in SBW25 will take thousands of years. Hence it seems unlikely that horizontal transfers are frequent enough to explain the ubiquitous presence of the REPIN–RAYT system in bacteria.
Alternatively, the REPIN–RAYT system may be maintained because it provides a selective advantage to the host bacte-rium (Bertels and Rainey 2011a,b; Bertels et al. 2017;). There have been many studies on potential benefits for indi-vidual REP sequences (Higginset al.1988; Espéliet al.2001; Lianget al.2015). Similar to why bacterial mutator popula-tions are not maintained in constant environments over long periods of time (Wielgoss et al. 2013), local benefits of
REPINs cannot explain the maintenance of the REPIN–RAYT system over long periods of time. Hence the REPIN–RAYT system probably possesses a function other than the disper-sion of REPINs that is beneficial for the host bacterium.
Acknowledgments
We thank Paul Rainey for his insightful comments on the manuscript. All authors acknowledge generous funding from the Max Planck Society.
Literature Cited
Aranda-Olmedo, I., R. Tobes, M. Manzanera, J. L. Ramos, and S. Mar-qués, 2002 Species-specific repetitive extragenic palindromic (REP) sequences in Pseudomonas putida. Nucleic Acids Res. 30: 1826–1833. Barabas, O., D. R. Ronning, C. Guynet, A. B. Hickman, B. Ton-Hoang et al., 2008 Mechanism of IS200/IS605 family DNA transposases: activation and transposon-directed target site se-lection. Cell 132: 208–220.
Bertels, F., and P. B. Rainey, 2011a Curiosities of REPINs and RAYTs. Mob. Genet. Elements 1: 262–268.
Bertels, F., and P. B. Rainey, 2011b Within-genome evolution of REPINs: a new family of miniature mobile DNA in bacteria. PLoS Genet. 7: e1002132.
Bertels, F., J. Gallie, and P. B. Rainey, 2017 Identification and characterization of domesticated bacterial transposases. bioRxiv 119735. doi:https://doi.org/10.1101/119735.
Bichsel, M., A. D. Barbour, and A. Wagner, 2013 Estimating the
fitness effect of an insertion sequence. J. Math. Biol. 66: 95–114. Bull, J. J., L. A. Meyers, and M. Lachmann, 2005 Quasispecies
made simple. PLOS Comput. Biol. 1: 450–460.
Bureau, T. E., and S. R. Wessler, 1994 Stowaway: a new family of inverted repeat elements associated with the genes of both mono-cotyledonous and dimono-cotyledonous plants. Plant Cell 6: 907–916. Domingo, E., and P. Schuster (Editors), 2016 Quasispecies: From
Theory to Experimental Systems(Current Topics in Microbiology and Immunology, Vol. 392). Springer, Berlin.
Eigen, M., 1971 Selforganization of matter and the evolution of biological macromolecules. Naturwissenschaften 58: 465–523. Eigen, M., and P. Schuster, 1977 The hypercycle. a principle of
natural self-organization. part a: emergence of the hypercycle. Naturwissenschaften 64: 541–565.
Espéli, O., L. Moulin, and F. Boccard, 2001 Transcription attenu-ation associated with bacterial repetitive extragenic BIME ele-ments. J. Mol. Biol. 314: 375–386.
Higgins, C. F., G. F.-L. Ames, W. M. Barnes, J. M. Clement, and M. Hofnung, 1982 A novel intercistronic regulatory element of prokaryotic operons. Nature 298: 760–762.
Higgins, C. F., R. S. McLaren, and S. F. Newbury, 1988 Repetitive extragenic palindromic sequences, mRNA stability and gene expres-sion: evolution by gene conversion?—a review. Gene 72: 3–14. Jurka, J., V. V. Kapitonov, O. Kohany, and M. V. Jurka, 2007 Repetitive
sequences in complex genomes: structure and evolution. Annu. Rev. Genomics Hum. Genet. 8: 241–259.
Liang, W., K. E. Rudd, and M. P. Deutscher, 2015 A role for REP sequences in regulating translation. Mol. Cell 58: 431–439. Lynch, M., M. S. Ackerman, J.-F. Gout, H. Long, W. Sunget al.,
2016 Genetic drift, selection and the evolution of the mutation rate. Nat. Rev. Genet. 17: 704–714.
Mahillon, J., and M. Chandler, 1998 Insertion sequences. Micro-biol. Mol. Biol. Rev. 62: 725–774.
Messing, S. A. J., B. Ton-Hoang, A. B. Hickman, A. J. McCubbin, G. F. Peasleeet al., 2012 The processing of repetitive extragenic palindromes: the structure of a repetitive extragenic palindrome bound to its associated nuclease. Nucleic Acids Res. 40: 9964–9979. Nowak, M. A., 1992 What is a quasispecies? Trends Ecol. Evol. 7:
118–121.
Nunvar, J., T. Huckova, and I. Licha, 2010 Identification and charac-terization of repetitive extragenic palindromes (REP)-associated tyrosine transposases: implications for REP evolution and dy-namics in bacterial genomes. BMC Genomics 11: 44.
Ochman, H., and A. C. Wilson, 1987 Evolution in bacteria: evi-dence for a universal substitution rate in cellular genomes. J. Mol. Evol. 26: 74–86.
Ochman, H., S. Elwyn, and N. A. Moran, 1999 Calibrating bacte-rial evolution. Proc. Natl. Acad. Sci. USA 96: 12638–12643. Oggioni, M. R., and J.-P. Claverys, 1999 Repeated extragenic
se-quences in prokaryotic genomes: a proposal for the origin and dynamics of the RUP element in Streptococcus pneumoniae. Microbiology 145: 2647–2653.
Page, K. M., and M. A. Nowak, 2002 Unifying evolutionary dy-namics. J. Theor. Biol. 219: 93–98.
Seifert, D., F. Di Giallonardo, K. J. Metzner, H. F. Günthard, and N. Beerenwinkel, 2015 A framework for inferring fitness land-scapes of patient-derived viruses using quasispecies theory. Ge-netics 199: 191–203.
Silby, M. W., A. M. Cerdeño-Tárraga, G. S. Vernikos, S. R. Giddens, R. W. Jackson et al., 2009 Genomic and genetic analyses of diversity and plant interactions of Pseudomonas fluorescens. Genome Biol. 10: R51.
Stern, M. J., G. F.-L. Ames, N. H. Smith, E. C. Robinson, and C. F. Higgins, 1984 Repetitive extragenic palindromic sequences: a major component of the bacterial genome. Cell 37: 1015– 1026.
Thorpe, H. A., S. C. Bayliss, L. D. Hurst, and E. J. Feil, 2016 The large majority of intergenic sites in bacteria are selectively con-strained, even when known regulatory elements are excluded. bioRxiv 069708. doi:https://doi.org/10.1101/069708. Ton-Hoang, B., C. Pasternak, P. Siguier, C. Guynet, A. B. Hickman
et al., 2010 Single-stranded DNA transposition is coupled to host replication. Cell 142: 398–408.
Ton-Hoang, B., P. Siguier, Y. Quentin, S. Onillon, B. Martyet al., 2012 Structuring the bacterial genome: Y1-transposases asso-ciated with REP-BIME sequences. Nucleic Acids Res. 40: 3596– 3609.
Touchon, M., C. Hoede, O. Tenaillon, V. Barbe, S. Baeriswyl et al., 2009 Organised genome dynamics in the Escherichia coli species results in highly diverse adaptive paths. PLoS Genet. 5: e1000344. van Dongen, S., 2000 A cluster algorithm for graphs. Report - Inf.
Syst. 10: 1–40.
Versalovic, J., T. Koeuth, and J. R. Lupski, 1991 Distribution of repetitive DNA sequences in eubacteria and application tofi nger-printing of bacterial genomes. Nucleic Acids Res. 19: 6823–6831. Wessler, S. R., T. E. Bureau, and S. E. White, 1995 LTR-retrotransposons and MITEs: important players in the evolution of plant genomes. Curr. Opin. Genet. Dev. 5: 814–821.
Wielgoss, S., J. E. Barrick, O. Tenaillon, S. Cruveiller, B. Chane-Woon-Minget al., 2011 Mutation rate inferred from synony-mous substitutions in a long-term evolution experiment with Escherichia coli. G3 (Bethesda) 1: 183–186.
Wielgoss, S., J. E. Barrick, O. Tenaillon, M. J. Wiser, W. J. Dittmar
et al., 2013 Mutation rate dynamics in a bacterial population reflect tension between adaptation and genetic load. Proc. Natl. Acad. Sci. USA 110: 222–227.