Abstract
FISHER, SARAH MARIE.
A Method for the Encapsulation of
MicroSpherical Particles. (Under the Direction of Dr. M. K.
Ramasubramanian).
Presently used single outlet air-driven droplet generators are incapable of
producing sufficient numbers of microparticle-containing droplets in a sufficiently
short time-period. A droplet generator was designed and fabricated, which
increases the production rate by simultaneously producing multiple droplets.
The encapsulator consists of several modular parts to produce the working
system. A parametric study was done to study the effects of process
parameters on the microcapsule geometry and uniformity. Microcapsules were
produced with low-viscosity high-guluronic acid (LVG) at concentrations of 1.5 %
and 1.8%, the gelled in a BaCl2 cross-linking bath. The samples produced were
done so with alginate alone and with polystyrene microspheres at a
concentration of 500 beads per cubic milliliter. Microcapsules with diameters
ranging from 0.4 to 0.9 mm were produced for both sets of samples. The
polymorphism present varied between 20 and 75%. Although the testing
included only a one-hole and six-hole configuration, the concept can be
A Method for the Encapsulation for MicroSpherical
Particles
by
Sarah M. Fisher
A thesis submitted to the Graduate Faculty of
North Carolina State University
in partial fulfillment of the
requirements for the Degree of
Master of Science
Mechanical and Aerospace Engineering
Raleigh, North Carolina
2006
APPROVED BY:
________________________ _________________________ Dr. William L. Roberts Dr. Kara J. Peters
(Advisory Committee Member) (Advisory Committee Member)
Biography
The author, Sarah M. Fisher was born on June 20, 1980 in Fayetteville,
North Carolina. She was raised with her younger sister, Shannon Leah Fisher, in
Moore County by her parents Barton and Cheryl Fisher. She graduated from
Union Pines High School in May 1998. Upon graduation from high school, Sarah
chose to attend North Carolina State University to pursue a degree in Mechanical
Engineering. In May of 2003, she completed her Bachelor’s degree with a minor
in mathematics. During her undergraduate studies, she worked as a teacher and
an engineering intern at various companies in Wake County.
Sarah chose to continue her education at North Carolina State University
in pursuit of a Master of Science degree in Mechanical Engineering, immediately
following the completion of her undergraduate degree. She had the opportunity
to gain extensive teaching experience through teaching each of the
undergraduate laboratories, including the senior design class. At the conclusion
of the first year of her graduate program, Sarah received the Teaching
Fellowship for the Future Award and Scholarship. She also had the pleasure of
serving as the Graduate Student Representative for the Mechanical Engineering
Department Lab Committee for two consecutive terms.
These experiences and her research in microencapsulation for the drive to
cure diabetes, further emphasized Sarah’s desire to work in the biomedical
industry.
Acknowledgements
I would first like to thank my advisor, Dr. M. K. Ramasubramanian. He
gave me a chance to work on this remarkable project, and supported me
throughout the research. Though we had problems along the way, he has
always showed me respect. I am truly thankful for his understanding and
guidance throughout my thesis work.
Since I started my degree in mechanical engineering, there has been one
professor, Dr. William Roberts, who has been a constant teacher, mentor, and
friend. He exposed me to the breadth of engineering through his teachings in
and outside the classroom. Dr. Roberts was an inspiration with his knowledge
and guidance throughout my studies. He was a true friend, showing honesty and
understanding. I will always be grateful for his constant encouragement and
support.
I would like to acknowledge my family most of all. To my parents, Barton
and Cheryl Fisher: Thank you for always believing in me, supporting all of my
dreams, inspiring me to believe in myself, showing me unconditional love and
understanding, teaching me to show respect and love for others, and always
showing me that you are always there for me. Mom, you made me the person I
am today. Daddy, you are my strength. To my sister, Shannon: You are my best
friend. Thank you for always being there for me through the good times and bad,
being truly optimistic for me, showing me unconditional love, spending time with
person in my life. You are a true inspiration to me. You and I have always found
those true moments together, and I will treasure them always. Thank you for
giving me courage. To my love, Robert Hughes, thank you for giving me the
courage to stand up for myself, believing in my abilities even when I do not, your
endless love and commitment, our life together, and the future we will make
together. Robert, I look forward to each and every day we spend together.
Table of Contents
List of Tables...vi
List of Figures ...vii
1. Introduction...1
2. Background...3
2.1. Diabetes ...3
2.2. Islet Tissue ...3
2.3. Cure for Diabetes ...4
2.4. Microencapsulation...5
3. Literature Review...7
3.1. Chemical Compositions ...7
3.2. Size, Shape, and Degree of Imperfections ...9
3.3. Design Parameters and Size Control of Alginate Beads...12
4. Materials and Methods ...24
4.1. Alginate Preparation ...24
4.2. Cross-linking Solution ...29
4.3. Polystyrene Microspheres ...31
4.4. Microscopy ...32
4.5. Statistical Analysis ...33
5. Microencapsulation System Design ...34
5.1. Manual Piston Pump ...34
5.2. Encapsulation Method ...36
6. Results...46
6.1. Variables...47
6.2. Sample Results ...48
6.3. Microcapsule Examples...50
6.4. Result Analysis ...59
6.5. Alginate Microspheres ...60
6.5.1. 1.5% LVG through Cell Ejector Plate with 1 Hole ...60
6.5.2. 1.8% LVG through Cell Ejector Plate with 1 Hole ...67
6.5.3. 1.5% LVG through Cell Ejector Plate with 6 Holes ...72
6.5.4. 1.8% LVG through Cell Ejector Plate with 6 Holes ...74
6.6. Microencapsulation of Polystyrene Microspheres...77
6.6.1. 1.5 % LVG with Polystyrene Microspheres...78
6.6.2. 1.8% LVG with Polystyrene Microspheres...80
6.7. Bead Diameter Comparisons across Experimental Sets ...83
7. Conclusions ...88
8. References ...90
9. Appendices ...94
9.1. Compumotor 6K8 Onboard Programmable I/O’s...95
9.2. S Drive Connections to 6K8 Controller ...96
List of Tables
Table 4-1: Viscometer model LV, Spindle #2...27
Table 4-2: Properties of Alginates investigated...28
Table 6-1: Samples Taken for Examination ...49
Table 6-2: Class level information for 1.5% LVG through 1 hole cell ejector plate ...60
Table 6-3: ANOVA Analysis for 1.5 % LVG through 1 hole cell ejector plate...62
Table 6-4: Class level information for 1.8% LVG through 1 hole cell ejector plate ...67
Table 6-5: ANOVA Analysis for 1.8 % LVG through 1 hole cell ejector plate...67
Table 6-6: Class level information for 1.5% LVG through 6 hole cell ejector plate ...72
Table 6-7: ANOVA Analysis for 1.5 % LVG through 6 hole cell ejector plate...73
Table 6-8: Class level information for 1.8% LVG through 6 hole cell ejector ...74
Table 6-9: ANOVA Analysis for 1.8 % LVG through 6 hole cell ejector plate...75
Table 6-10: Class level information for 1.5% LVG, polystyrene microspheres....78
Table 6-11: ANOVA Analysis for 1.5 % LVG, polystyrene microspheres...79
Table 6-12: Class level information for 1.8% LVG, polystyrene microspheres....81
Table 6-13: ANOVA Analysis for 1.8 % LVG, polystyrene microspheres...82
List of Figures
Figure 1-1: Islet Microencapsulated [5] ...2
Figure 2-1: Single Islet [6] ...4
Figure 3-1: Alginate Droplet Generator [19] ...13
Figure 3-2: Influences affecting the flow rate (—) and beads size (---). The 25G needle (○—○) and 22G needle (◊—◊) are also shown. Data is given in mean + sem of five experiments [19]...14
Figure 3-3: JetCutter [12] ...15
Figure 3-4: Effects of Electrostatic Potential on the Average Bead Diameter [22] ...18
Figure 3-5: The numbers of islets per milliliter alginate have an effect on the adequacy of islet encapsulation in capsules of 500 µm (filled symbols) and 800 µm (open symbols). Data is presented as mean + sem of five experiments [27]. ...22
Figure 4-1: Brookfield Viscometer...26
Figure 4-2: Spindles...27
Figure 4-3: Dynamic Viscosity measurements based on samples...29
Figure 4-4: Changes in diameters of Ba++ -alginate microspheres during 14-day saline incubation at 37°C. Data represents mean+SEM of the percentage change in diameter with respect to initial measurements on day 0 (n=5) [10]. ...30
Figure 4-5: Changes in diameters of Ca++ -alginate microspheres during 14-day saline incubation at 37°C. Data represents mean+SEM of the percentage change in diameter with respect to initial measurements on day 0 (n=5) [10]. ...31
Figure 4-6: 5mm Reticle scale as seen through microscope eyepiece ...32
Figure 5-1: Syringe extrusion system with a pneumatic cylinder ...35
Figure 5-2: Transparent Microencapsulator Model ...37
Figure 5-3: Encapsulator...38
Figure 5-4: Cell Slide section ...39
Figure 5-5: Plunger ...40
Figure 5-6: Bead Ejector Plate with 1 Hole ...42
Figure 5-7: Bead Ejector Plate with 6 Holes ...43
Figure 5-8: Image of individual hole ...44
Figure 6-1: Alginate spheres with and without a tail (M = 4). ...50
Figure 6-2: Alginate sphere without a tail (M = 4, d ~ 0.54 mm). ...51
Figure 6-3: Alginate sphere with a tail (M = 4, d ~ 0.64 mm). ...51
Figure 6-4: Microencapsulation example #1. ...52
Figure 6-5: Microencapsulation example #2. ...53
Figure 6-6: Microencapsulation example #3 with tailing...54
Figure 6-7: Microencapsulation example #4 with fragmentation. ...55
Figure 6-10: Polystyrene microsphere after encapsulation without a tail (M =
8.75, d ~ 0.47 mm)...57
Figure 6-11: Polystyrene microspheres after encapsulation with a tail (M = 8.75). ...58
Figure 6-12: Polystyrene microspheres after encapsulation without a tail, and multiple beads (M = 8.75, d ~ 0.53 mm). ...58
Figure 6-13: Polystyrene microspheres after encapsulation from a sample (M = 4). ...59
Figure 6-14: Mean Diameter as a function of Acceleration for Upstroke = 2 and 6. (1.5% LVG) ...63
Figure 6-15: Mean Diameter as a function of Acceleration for Upstroke = 4 and 8. (1.5% LVG) ...64
Figure 6-16: Beads without Tails as a function of Acceleration for Upstroke =2 and 6. (1.5% LVG) ...65
Figure 6-17: Beads without Tails as a function of Acceleration for Upstroke =4 and 8. (1.5% LVG) ...66
Figure 6-18: Mean Diameter as a function of Acceleration for Upstroke = 2 and 6. (1.8% LVG) ...68
Figure 6-19: Mean Diameter as a function of Acceleration for Upstroke = 4 and 8. (1.8% LVG ...69
Figure 6-20: Beads without Tails as a function of Velocity for Acceleration. (1.8% LVG) ...70
Figure 6-21: Beads without Tails as a function of Upstroke for Velocity =0.2, 0.6, and 1.0. (1.8% LVG) ...71
Figure 6-22: Mean Diameter as a function of Acceleration all values of Upstroke and Velocity. (1.5% LVG, through 6 holes)...73
Figure 6-23: Mean Diameter as a function of Velocity, for Upstroke and Acceleration. (1.8% LVG, through 6 holes)...76
Figure 6-24: Mean Diameter as a function of Upstroke, for Velocity = 0.6 and 1.0. (1.8% LVG, through 6 holes) ...77
Figure 6-25: Mean Diameter as a function of Upstroke, for Velocity. (1.8% LVG, through 6 holes)...80
Figure 6-26: Mean Diameter as a function of Acceleration, for Velocity and Upstroke. (1.8% LVG, polystyrene microspheres) ...82
Figure 6-27: Mean Diameter as a function of Upstroke. (1.5 % LVG) ...84
Figure 6-28: Mean Diameter as a function of Upstroke. (1.8 % LVG) ...85
Figure 6-29: Mean Diameter as a function of Upstroke. (1 hole plate)...86
1. Introduction
Due to the shortage of organs needed for transplantation, many patients
die while waiting for an organ from a human donor. Those who receive an organ
or tissue face serious issues related to the side effects of immunosuppression
drugs administered to prevent organ rejection. Transplantation of cells and
tissue rather than the whole organ has become an attractive option for
increasing the chance of success and simplifying the surgical procedure to a
minimally invasive one [1]. Further, in order to eliminate the organ shortage, use
of tissues and organs from other species, known as xenotransplantation, has
become very attractive for the treatment of life-threatening diseases. In order to
avoid immunosuppression drugs, the tissue should be protected from attack by
the host immune system while allowing the organ to function inside the host in a
totally compatible manner. The process of entrapment of mammalian cells and
tissue in biocompatible microcapsules, known as microencapsulation, has
become the most popular technique for immunoprotection of cells [2]. This
technique has shown promise in various systems of cell therapy for a wide
spectrum of diseases.
The most promising application of this technology is the development of a
reliable bioartificial pancreas in the form of microencapsulated islets, for the cure
of diabetes mellitus [3]. Another important application is the development of a
bridge to orthotopic liver transplantation for patients with fulminant hepatic failure
[4]. While the technique of encapsulation of cells and tissue has been shown to
work through transplant studies with small animals and primates, and limited
clinical trials, the barrier to offering the technique for human patients as a routine
procedure is the lack of a mass production technique for the microencapsulation
of cells to meet the demand (Figure 1-1).
2. Background
2.1. Diabetes
Diabetes is a disease of carbohydrate metabolism defined by elevated
blood sugar. There are two types of diabetes. In type 1 diabetes, the body has
mistakenly destroyed its own islet cells of from the pancreas, which are the cells
that produce insulin in response to glucose levels in the blood. This is known as
the “Insulin-Dependent Diabetes Mellitus (IDDM).” In type 2 diabetes, the body
has not destroyed its cells, but rather, cannot effectively use the insulin they are
producing. This is known as the “Non-Insulin-Dependent Diabetes Mellitus
(NIDDM).” Regardless, the end result is that the body is unable to regulate
sugar levels in the blood due to lack of insulin production.
2.2. Islet Tissue
Islets are cells clusters located in the pancreas. It consists primarily of
beta cells, alpha cells, delta cells, and pancreatic polypeptide cells. Roughly
there are about ten thousand individual cells in an islet cluster. Beta cells are
the most abundant, about 80%, in islet cells and they are the only cells in the
body that make insulin. Alpha cells make glucagons, which is another hormone
that affects the amount of glucose in the bloodstream. Delta cells make another
would mean that people with type 1 diabetes would no longer need to take
insulin shots [6]. About a million islet cells are needed for a human transplant.
In general, four to six donor pancreas are needed for one human transplant as
the islet comprise of only about 2% of all the tissue in a pancreas [3]. The
process of isolating viable islet tissue from a donor pancreas is not efficient to
capture all the islets since the process is a selective enzyme digestion of the rest
of the organ. Porcine islets are available in abundance and are an attractive
option to meet the demand.
Figure 2-1: Single Islet [6]
2.3. Cure for Diabetes
There are four general approaches that might accomplish a cure for
diabetes [7]. The first is the complete pancreas and islet transplantation. In this
case, a donor pancreas is implanted into a diabetic or islet cells from a donor are
infused into a vein that drains in the pancreas. In this case, the primary problem
is organ rejection. In order to prevent organ rejection, immunosuppression
drugs have to be administered and their side effects and complications have to
blood sugar level is measured using an embedded sensor and a microcomputer
determines the amount of insulin needed and pumps the metered quantity into
the blood stream from a reservoir. This method is still in its early stages of
offering and faces a host of issues involving reliability and safe operation. The
third approach is to genetically engineer the cells to evade the immune system
of the host and avoid immunosuppressive drugs. This is not currently developed
far enough to make an assessment of the effectiveness and side effects. The
fourth approach is the use of encapsulated islets; bio-artificial pancreas has
living, functional islets or cells in an artificial biocompatible material. This
method has been shown to work when microencapsulated islets were
transplanted into small animals and primates [8]. The transplantation of the
organs and tissue across species boundaries is known as xenotransplantation.
In the case of finding a cure for diabetes, the bioartificial pancreas seems to hold
the most promise.
2.4. Microencapsulation
Microencapsulation of cells is a technique designed to entrap viable cells
within the confines of semi-permeable membranes that are permeable to small
molecules, such as nutrients and oxygen, which are essential for cell survival,
but impermeable to large molecules, such as antibodies and immune cells [2,
pancreas replaces nonfunctional islets of Langerhans. It responds to changing
blood composition with release of hormones including insulin. A bio-artificial
pancreas is implanted into the peritoneal cavity of the diabetic and contains two
to three million cells.
Microencapsulation has become a technique of significant interest in cell
therapy for a variety of pathophysiologic conditions, including kidney failure, liver
failure, CNS insufficiencies, and diabetes mellitus [2].
In the past, industry has used a number of techniques for the
microencapsulation of cells. The two most widely used devices are the
air-syringe pump droplet generator and the electrostatic bead generator. Each of
these devices is fitted with a single syringe in which cells are suspended in
alginate solution. The mixture is pushed through a single needle producing
cross-linked spherical beads. Though each system has been proven to
generate spherical beads without polymorphisms and relatively controllable
diameter, there is one main drawback. They are incapable of producing
sufficient numbers of microcapsules in a short time period to permit mass
production of encapsulated and viable cells for transplantation in large animals
and humans.
The focus of this research is to develop a device for the mass production
of alginate microsphere encapsulations, and to determine the optimal conditions
for the consistent production of alginate microsphere encapsulations. After
better understand the variables that affect the sphericity and polymorphism of
the microspheres produced.
3.
Literature Review
After deciding upon a research objective, a summary is developed of the
tasks required to achieve that objective. First, the chemical composition of the
mixing solutions required for optimal sphere viability is studied. Next, the factors
influencing the properties and performance of microcapsules are studied. These
factors are important to examine to better understand how the previous
procedures can be applied. Finally, design parameters of each
microencapsulation method are studied. The various parameters that control
the size of the spheres from the previous methods are determined. Each of
these areas are summarized and presented in the following sections.
3.1. Chemical Compositions
The swelling and shrinkage of microcapsules are important factors to
investigate. The functional properties of alginates are based on the mannuronic
acid and guluronic acid. The mechanical and swelling properties of alginate gel
beads depend strongly on the mannuronic composition and block structure of
and an increase in the polymer concentration relative to the alginate solution.
Swelling, defined as the increase in nominal diameter of a microcapsule, leads
to an increase in the shell concentration and increases the chances of the core
shrinkage. Both shrinkage and swelling are expected with any alginates, but
minimizing these problems is the ultimate goal.
A variety of sodium alginates, differing in mannuronic acid and viscosity
have been studied for the purpose of encapsulating a variety of cell types [10].
Four different major groups that have been studied include:
o Low viscosity high-mannuronic acid (LVM)
o Medium viscosity high-mannuronic acid (MVM)
o Low viscosity high-guluronic acid (LVG)
o Medium viscosity high-guluronic acid (MVG)
These samples were gelled by cross-linking with 1.1% solution of either BaCl2 or
CaCl2 [10]. From their results, major differences were found between the four
different samples. The high M alginate samples (LVM and MVM) were more
prone to swelling than the high G (LVG and MVG) samples. The swelling was
determined by studying the samples over a period of sixteen days. The Ba++ and Ca++ both cause swelling, but the Ba++ is less potent for this parameter [10]. The study also revealed that the mannuronic acid-rich alginate beads swell more
than the guluronic acid-rich alginate beads. While these properties have an
important effect on the swelling, the viscosity did not have an effect on this
Alginates with high mannuronic acid (high M) or high guluronic acid (high G)
content have been studied for additional mechanical properties [11]. The
alginates with high-G materials, such as LVG and MVG, offer higher capsule
stability [11]. From this study, they found that the capsules are more durable,
shrink less, and provide permeability to the inner core [11].
Sodium alginates are important to study as a preparatory encapsulation
medium. As shown from previous research, the chemical composition has a
more significant effect than the physical properties on the bead swelling [10]. If
swelling occurs, permeability decreases, and the chances that encapsulated
islets will die increases [11]. From a similar study on sodium alginates, differing
in molar mass and structural composition, were examined [12]. The chemical
composition, specifically the guluronic acid content, was more significant than
the molar mass for both mechanical and transport properties [12]. Capsules
were produced using both high and low guluronic acid. Their results show that
the high-G acids shrink less than the low-G acid materials.
3.2. Size, Shape, and Degree of Imperfections
The basic chemical composition has stronger effects than the physical
properties, such as viscosity, on the mechanical strength and stability of beads
for both long and short term periods [13]. After studying the chemical
viscosity levels affect the formation of beads. Finding the most favorable
viscosity range can optimize the size and uniformity of the beads. Depending
on the methods used to produce the beads, the alginate type and concentration
will vary. Some examples of the methods used are gas shear, conventional
“drip,” and vibration. The gas shear method uses a concentric air stream to
shear a drop from a needle tip. The drag force from the concentric flow of gas
contributes to the gravitational force to shear the drop from the tip. The
conventional, or drip, method allows the drop to fall from the needle tip
randomly. With this method, the bead diameter is determined by the weight of a
drop at the needle tip. Once the weight of the drop overcomes the surface
tension forces, the drop detaches from the surface. The last method uses
vibration as a mechanical disturbance to induce a controllable breakup of a
liquid jet into droplets. The theory of capillary jet instability is used with this
method. A wavelength of disturbance is applied to the jet, inducing the drop
formation process [14]. The viscosity was studied as a property to measure for
correlation to bead characteristics. Despite various chemical compositions, for
the vibration method, the optimal viscosity range is 150-500 cP [14]. The goal of
most studies is to produce microcapsules that are small in size. Initial studies
show bead production of 300 - 500 µm in diameter. Production of inadequate
microcapsules, partially enclosed capsules, is inversely related to capsule
diameter [15]. Imperfections can have adverse effects on the viability of
encapsulated islet transplants. These imperfections are difficult to quantify, but
duration of storage of alginate samples may have negative effects on its ability
to form spherical microcapsules [15]. Good spherical microcapsules are
produced with a fresh batch of alginate, but after prolonged storage,
polymorphism is observed, as its viscosity is reduced [15]. Therefore, viscosity
of an alginate sample affects the morphology of microcapsules produced. An
additional factor that can create imperfections is the amount of shear stress
involved in the encapsulation process. When these stresses are too high,
microartifacts are produced inside and outside the microcapsules [15].
An additional problem found in past research with the microcapsule
production process is swelling, as covered in the previous section. The studies
have shown that after treating the microcapsules with Na2SO4, the diameter will
be held to less swelling [16]. Investigators have argued that solid gel
microcapsules with perm-selectivity may be more stable than semi permeable
microcapsules. This is argumentative at this point, but studies have shown that
the Na2SO4 coating helps stabilize both types. An additional coating that has
been shown to help the stability of microcapsules is isotonic sodium chloride
solution (INaCIS) [17]. Washing the spheres once makes the microspheres
more compact during incubation and keeps the final diameter of the
microcapsules smaller. These steps are an important part of the
microencapsulation process, but at this point, the most important factors are the
3.3. Design Parameters and Size Control of Alginate Beads
The various devices used for microencapsulation are important to
examine to better understand the various parameters that affect the size, shape,
and morphology of the beads created. The first of these devices produced
droplets through syringe pump extrusion, sometimes called an AirJet device
[18]. This technique was used to encapsulate islets from adult Wistar rats. The
steps taken include the following: (i) pancreatic islets are embedded in alginate
droplets; (ii) droplets are transformed into rigid beads by cross-linking with
calcium chloride; (iii) the beads are coated with polylysine and alginate, forming
semipermeable capsules; and (iv) alginate core is liquefied with isotonic sodium
citrate solution [18]. These steps are followed for each of the studies
considered, with alterations for viability studies of the final microcapsules.
A droplet generator is composed of a droplet sizer and an alginate
solution reservoir (Figure 3-1). The sizer consists of a cylindrical chamber
holding the alginate nozzle. Air is applied to the alginate reservoir forcing the
solution of a blunt hypodermic needle [19]. The alginate drops into a calcium
Figure 3-1: Alginate Droplet Generator [19]
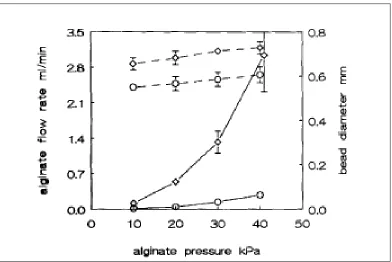
This aperture can be altered to produce various bead sizes, but there is
some standard deviation for any sample measured [19]. The diameter range is
from 3.0 mm to 0.5 mm. In this study there were number a variables such as the
air flow rate through the air jacket to the needle tip, the length, and wall
thickness of the nozzle that were examined. The diameter of the nozzle and the
pressure on the alginate solution in the syringe were found to be important
factors that influenced the bead size. This technique used the gas shear
methods discussed earlier to force the droplets to detach from the orifice. The
Figure 3-2: Influences affecting the flow rate (—) and beads size (---). The 25G needle (○— ○) and 22G needle (◊—◊) are also shown. Data is given in mean + sem of five experiments
[19].
Based on their results, they concluded the following [19]:
o As the air flow rate increases, bead diameter increases
o The length of the shaft had minimal influence on the diameter
o An increase in air flow rate through the air jacket at the nozzle tip
compares with a decrease in the diameter of the beads
o Decreasing the diameter of the nozzle, decreases the size of the
beads
o Standard deviations ranged from 2.2% up to 4.9% in these
These results are consistent for most of the experimentation done with this type
of apparatus [15]. Additional studies showed smaller alginate microcapsules
can be produced.
The JetCutting method of bead generation has been shown to be useful
for microencapsulation of particles. A reservoir containing the material to be
encapsulated is pressed through a nozzle and cut into identical cylinders [20].
The cylinders were cut using a rotating cutting tool. After the cutting procedure,
the liquid cylinders become spherical and fall into a bath containing the
crosslinking solution (Figure 3-3).
There were many advantages to this method. For one, the alginate solutions
used for microencapsulation were wide in variety. Another advantage was that
the extrusion and bead formation steps were controlled by mechanical
components. Therefore, the viscosity was not an important factor for this
method because the steps are mechanically enforced. The two most influential
variables were the nozzle and the fluid velocity speed. For small nozzle
diameters, a low fluid velocity must be used to inflict minimum shear stress on
the particles upon extrusion. The results of this study show that 60% of the
beads were within the range of 295-325 µm. Other conclusions that were made
from this study are as follows [20]:
o The beads can withstand the mechanical stress induced during the
procedure.
o Bead size is dependent on the fluid flow velocity, nozzle diameter,
number of cutting wires, and the number of nozzles used.
o Bead size reduction may be achieved by decreasing the size of the
nozzle.
o The flow velocity and the speed of the cutting tool may be
increased to increase the bead production, though the bead viability may
decrease as well.
The basic production capacity of this technology was 5200 beads/s or
was developed in 2000 [14], and was also used in manufacturing practices for
hydrogel production [14].
A similar study shows that the JetCutting method had the highest flow
rate capabilities in comparison to the free-fall dropping, electrostatic, vibration,
and other methods used in the bead production research [21, 22]. By varying
the cutting frequencies, viscosity, and nozzle diameter, the mean diameter of the
beads could be generated. The mean diameters ranged from 0.15 up to 3.0
mm.
While the previous studies considered used syringe-pump or mechanical
technologies, another technique to use is called an electrostatic potential bead
generator [21, 22]. This technique is similar to the syringe-pump setup in that it
also uses an alginate-particle reservoir and a droplet sizer. The reservoir is a
syringe, and the sizer is a steel needle commercially produced for computer
plotters. This instrument uses an electrostatic potential to pull droplets from a
needle tip. Based on the free-fall techniques that allow the drops to fall due to
its own weight, the diameters are too large [14]. By using a high voltage, the
droplet size can be more controllable. The droplets are pulled from the needle
tip by using an electrostatic potential. The voltage is applied between the needle
and the solution below. The solution is electroconductive and contains gelling
ions, usually Ca++. For this technique the variables considered during the study included the flow rate from the reservoir, needle diameter, and electrostatic
molecular weight distribution. The experiments performed for this study
consider each variable separately, in order to predict the effects on the bead
diameter (Figure 3-4).
Figure 3-4: Effects of Electrostatic Potential on the Average Bead Diameter [22]
These results lead to the following conclusions:
o Bead diameter decreases with electrostatic potential until reaching
a minimum threshold.
o For an alginate solution with low-G composition, the beads will be
o With increases in alginate solution concentration, which includes
an increase in viscosity, the bead diameter will increase as well.
o The relationship between bead diameter and flow rate is shown to
be linear.
With this study, and similar studies in this area, the mean diameter produced at
optimal settings was approximately 300 µm. The final results show that the
molecular weight of the alginate samples had little influence on the size of the
final beads measured. But as discussed earlier, there were other variables to
consider with this type of bead generation.
Using this same technique, and similar alginate solutions, comparable
results have been found in other studies. By varying the electrostatic voltage for
2 needle diameters, the bead diameters were wide-ranging. In the previous
study utilizing electrostatic potential, bead diameters for a 0.40 mm needle
ranged from 2000 down to 600 µm, and diameters for a 0.18 mm needle ranging
from 1200 to 300 µm. The reported needle diameters are the inner diameter.
The bead diameter decreased with the electrostatic potential/distance to bath
ratio. In the second study, beads were produced using approximately the same
size needles. For a 0.40 mm and a 0.2 mm needle, the bead diameter ranges
were 775 to 525 µm, and 250 to 200 µm, respectively [24]. In both studies the
electrostatic voltage was varied in approximately the same range. The second
study also found a linear relationship between bead diameter and flow rate [23].
with various differences, this technique still requires the use of a syringe-needle
model, similar to that of the free-fall and syringe-pump models.
Utilizing the laminar jet break-up technique, and incorporating an
electrostatic potential can produce beads produced in a wide size distribution.
For this design a range of 50-1000 µm nozzles can be applied, depending on
the capsule diameter desired [25]. This technique has been used extensively in
microencapsulation research, and also aids in understanding the variables that
affect the bead diameters.
There are advantages and disadvantages for each of the three major
techniques used for microencapsulation. Each of the three methods produce
uniform spherical beads. While the vibrating nozzle method requires a relatively
low viscosity (<0.2 Pa/s), the AirJet and JetCutter devices both work well with
alginate of higher viscosity [26]. It is well known that beads with a small
diameter, less than 300 µm, are more difficult to produce than beads with a large
diameter, greater than 500 µm. There are advantages to producing smaller
beads such as better oxygenation of encapsulated cells, smaller implant volume,
and easier applications to organs [27]. Even with these advantages, cells must
undergo high mechanical shear stress during the encapsulation process.
Further stress is induced when using low viscosity alginate solutions, which lack
mechanical stability in the alginate itself. In order to compensate for this
problem, the beads must be covered with more alginate layers, protective
techniques, production of uniform spherical beads can be optimized, and with
further research, the process can be used to produce beads on a large scale.
After studying the various techniques used for single droplet generation, it
is important to consider upscaling the process. Transplantation of pancreatic
islets into diabetic animals has been successful and it shows a promising
technique for humans. In order for the human islet transplantation to work, one
million islets would be required. At this rate, with the current designs, it would
require over 100 hours of production time with approximately 1000 islets per
milliliter. In order to increase this production rate multineedle generators have
been studied. Using the AirJet technology, a four-needle device has been
constructed and tested (27). The studies were completed with alginate-islet
suspensions of 1000, 2000, 4000, 6000, and 10000 islets per milliliter alginate.
Each solution was made using 3% alginate solution. As with any of these
studies, there were inadequate capsules with each sample taken. Microscopic
examination was performed to identify these inadequacies. The experiments
were performed with beads of diameter of 500 and 800 µm. At the lowest
number islets per milliliter, 1000, this portion amounts to 33 + 3.4 and 6.7 + 2.2
% viable encapsulations for 500 and 800 µm, respectively. As the number of
islets per milliliter alginate is increased, the percentage of inadequate capsules
increases as well (Figure 1-3). This is evident for both sizes of beads, though
the percentage of inadequate capsules is lower for the larger beads. When
range for 1000 to 6000 islets per milliliter alginate. With the 800 µm beads, the
portion of inadequate beads is much lower with 500 µm capsules, but it starts to
rise significantly higher with 4000 or more islets per milliliter alginate are used.
As stated previously, a human patient will need over one million islets. With any
clinical trial an accurate assessment of the amount injected into a patient is
important. It is viable to understand how many viable microencapsulated islets
can be produced per milliliter.
Figure 3-5: The numbers of islets per milliliter alginate have an effect on the adequacy of islet encapsulation in capsules of 500 µm (filled symbols) and 800 µm (open symbols).
Data is presented as mean + sem of five experiments [27].
This procedure is not fully developed since approximately 50% of the capsules
with the diameter of 800 µm are empty [27]. By increasing the islet
variable, there is an optimal threshold. And since the purpose of this research is
to produce high quality microcapsules, the lower concentrations should be
utilized. Even with the lower concentrations, the production time is reduced from
earlier times required. The focus is also to produce smaller capsules, less than
500 µm. From this study using the 500 µm beads can produce the maximum
number of islets per milliliter alginate, because from the same volume of alginate
approximately three times more 500 µm than 800 µm capsules can be produced
[19]. Now, with this in mind, this study shows that staying with the smaller
beads, and lower islet concentrations, the process can be optimized.
A similar approach was taken when a multinozzle system was designed with the
idea to produce large batches of microcapsules [20]. The device has 13 nozzles
to which can be changed to produce beads within the 0.2-1 mm range [28]. The
nozzles used in this experiment were 200 µm in diameter. The nozzles consist
of a precision drilled sapphire stone on the tip of a stainless steel cone. With
this device beads can be formed that are smaller than 340 µm, and the mean
diameter of the viable beads is 0.368 mm. This is smaller than the other
devices. The major problem with this device is coalescing of droplets in air
before reaching the gelling solution. The problem with these results is particles
with double volume, or ‘twin particles’ joined together. Though this is a new
variable to consider, the range of error is low compared to the production
distribution. From the samples taken, the error particles represented are
technique with this research, and from these tests, it may be an option for mass
production.
Not only is the bead diameter dependent on the variables considered during the
encapsulation procedure, the incubation period is also considered. Each study
may use a different incubation medium, but they all show dependence with this
variable. After a certain period of time, the beads will start to decrease in size
and deteriorate [13, 15, 24, 25, 28, 29]. For any given alginate suspension used
in the bead formation, the hardening bath used is either CaCl2 or BaCl. Both
chemicals are used for the crosslinking phase. The divalent cations bind to G
blocks. This selective binding of cations to alginate accounts for its capacity for
ionotropic gels. The gel formation is based on the length of the G blocks of the
alginate solution. Various studies have been done over a period of time to study
the effects of gelling cations on bead swelling and viability. The mean diameter
is a function of the incubation time; therefore, it should be limited.
4. Materials and Methods
4.1. Alginate Preparation
The encapsulation material used in this study was alginate, which
consists of alginic acid and saline. The alginic acid used in these experiments,
also known as sodium salt, is extracted from macrocystis pyrifera, which is a
type of kelp. The alginate, or M. pyrifera, was obtained from Sigma, St. Louis,
PA. The alginate types are low-viscosity high-guluronic acid (LVG), from Sigma;
medium-viscosity mannuronic acid (MVM); and medium-viscosity
high-guluronic acid (MVG); where the second two samples are from FMC
BioPolymer. The molecular structure depends on the sequencing of the
mannuronic acid (M) and the guluronic acid (G). The monomers are arranged in
a pattern of blocks along a chain. The blocks may have different combinations
such as MG, MM, or GG. The functional properties of the alginate as an
immobilization matrix are in question, the composition and block structure are
important to examine. The intrinsic inflexibility of the alginate molecules in
solution increases in order MG<MM<GG [13]. The viscosity depends mainly on
the molecular size, but the binding of cations and the gel-forming properties
depend on composition and sequence. Macrocystis pyrifera is frequently used
for immobilization, and yields gels with good strength and stability.
The samples were prepared using buffered saline, with 0.85% W/V
isotonic Sodium Chloride solution from Fisher Scientific, Middletown, VA. Each
sample was prepared by suspending the polymer of choice in the saline solution.
A magnetic stirrer stirred each suspension for at least 6 hours. Once the
samples were prepared, they were stored at room temperature.
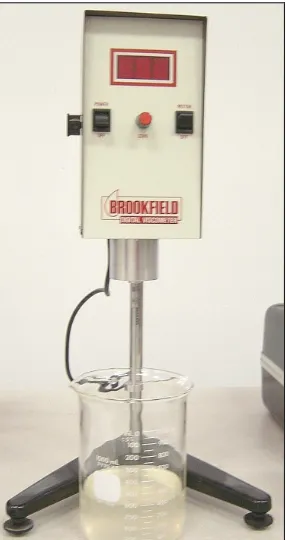
After each sample was prepared, testing was done to find the dynamic
viscosity and density. In order to do this testing, a Brookfield digital viscometer,
LV model, was used (Figure 4-1). The readout on the viscometer was used to
was used. Based on the viscometer model, spindle used (Figure 4-2), and
RPMs, the scale factor is found.
Poise ityincenti Vis
Factor ading
DialRe × = cos
The spindle used in this experiment was number 2. The speeds correlating with
the scale factor are listed below (Table 4-1).
Figure 4-2: Spindles
Table 4-1: Viscometer model LV, Spindle #2
Speed (RPM) Scale Factor
0.3 1M
0.6 500
1.5 200
3.0 100
6.0 50
12 25
30 10
60 5
Testing was completed on 600 mL samples, and the results are based on mean
of five experiments (Table 4-2). The density was approximately the same for
each sample. The important variable to examine is the viscosity. The viscosity
increases with concentration for each sample, which includes LVM, MVM, and
Spindle #2
viscosity will work in the encapsulator, therefore, only the minimum and
maximum viscosities are tested for each sample.
Table 4-2: Properties of Alginates investigated
Sample
Concentration
[%] TYPE
Density (g/mL) Dynamic Viscosity (cP) Kinematic Viscosity (P*cm3/g)
1.5 LVG 0.9956 40.00 0.4018
1.6 LVG 0.9948 45.10 0.4534
1.7 LVG 0.9940 48.00 0.4829
1.8 LVG 0.9946 58.90 0.5922
2.0 LVG 0.9959 77.50 0.7782
1.5 MVM 0.9940 222.50 2.2385
1.6 MVM 0.9950 275.50 2.7688
1.7 MVM 0.9969 352.90 3.5399
1.8 MVM 1.0002 433.10 4.3303
2.0 MVM 1.0005 492.00 4.9176
1.5 MVG 1.0016 346.00 3.4546
1.6 MVG 1.0005 426.50 4.2630
1.7 MVG 0.9959 528.00 5.3016
1.8 MVG 0.9905 636.40 6.4249
Figure 4-3: Dynamic Viscosity measurements based on samples
4.2. Cross-linking Solution
The cross-linking solution can either be made from calcium chloride or
barium chloride. Either chemical works well with the alginate, but in this study
the barium chloride is used in order to maintain bead durability and size for a
the encapsulation model (Figures 4-4 and 4-5). By using barium chloride, the
samples are will have a constant diameter over a longer period of time [9]. The
cross-linking solution is barium chloride dihydrate, 10% W/V from LabChem Inc,
Pittsburg, PA. The alginate microspheres were made using the
micro-encapsulation procedure and cross-linked in the barium chloride bath. In order
to keep the polystyrene beads from agglomerating, a 0.1% solution of
Triton-X100, (name of company), was prepared and the beads were dispersed in the
solution before adding to the alginate solution prior to encapsulation.
Figure 4-4: Changes in diameters of Ba++ -alginate microspheres during 14-day saline incubation at 37°C. Data represents mean+SEM of the percentage change in diameter
Figure 4-5: Changes in diameters of Ca++ -alginate microspheres during 14-day saline incubation at 37°C. Data represents mean+SEM of the percentage change in diameter
with respect to initial measurements on day 0 (n=5) [10].
4.3. Polystyrene Microspheres
Polystyrene microspheres were obtained for the microencapsulation
testing. The microspheres are 0.106 to 0.125 mm in diameter. The samples
were obtained from PolySciences, Inc., Warrington, PA. Samples were made
using the 1.5 % and 1.8 % LVG alginate, with a concentration of 500 beads/mL.
The microspheres used in this application are spherical with a continuous wall
surrounding the core. These samples were run with the microencapsulation
4.4. Microscopy
The microspheres were studied using the Meiji EMZ-TR microscope from
Meiji Techno CO., LTD., Santa Clara, CA. The microscope was fitted with a
reticle in order to measure the bead diameters (Figure 4-6).
Figure 4-6: 5mm Reticle scale as seen through microscope eyepiece
A reticle is a flat piece of glass printed with a specific pattern. The glass
is mounted in the microscope eyepiece, and the pattern is superimposed over
the image of the specimen being studied. The reticle fitted for this particular
microscope is 25 mm outer diameter, with a linear scale. The scale is a total 5
mm divided into 100 units. In order to accurately measure the bead diameters,
4.5. Statistical Analysis
From each sample, approximately 25 to 35 beads were measured
manually. The diameter was measured, and observations were made on each
bead to determine if a tail was present. The data was collected for each sample,
and compiled for statistical analysis. The data, expressed as diameter (mm) and
tail/no tail, was used for statistical analysis of variations between samples taken.
Statistical evaluation of data was performed using an analysis of variance
(ANOVA) computer program (SAS). The ANOVA was performed with
Bonferroni correction for multiple comparisons to determine the significance of
differences among groups of beads, and between sample variables. In all cases,
a value of p<0.05 was accepted as significant. The p-value, probability value or
observed significance level, is the probability of obtaining an F statistic greater
than the computed F statistic when the null hypothesis is true. Therefore, with a
5. Microencapsulation System Design
The first system tested consisted of a syringe attached to a pneumatic
cylinder. This system is similar to the syringe pump extrusion systems [11].
Needles of various gauges were attached to the syringe, and alginate was
extruded through the needle. After studying the previous designs and this
simple system, a large scale encapsulator was designed and fabricated. The
various problems and variables of consideration are explained in the following
sections.
5.1. Manual Piston Pump
The manual piston was used to understand how the plunging technique
would produce beads, as opposed to a continuous pressure being applied to a
syringe. By attaching a simple syringe to a pneumatic cylinder, the plunging
motion was generated (Figure 5-1). By plunging, the syringe is compressed,
and retracted in a single cycle. The syringe was fitted with a hypodermic needle
at the exit.
This method can produce droplets, with some complications. The force
from the cylinder causes bending in the needle, and the system leaks around the
fitting between the syringe and the needle. With this simple setup, a few
Figure 5-1: Syringe extrusion system with a pneumatic cylinder
From this investigation, the process is adapted into a large encapsulator. By
using the basic syringe design, the large encapsulator is designed and
5.2. Encapsulation Method
The encapsulator consists of several modular parts to produce the
working system. These parts are as follows: Cell Chamber, drive rod, plunger,
cell slide, bead ejector plate, and linear actuator (Figure 5-2 and 5-3). To create
a closed system the cell chamber is attached and sealed to the cell slide by a
static o-ring (Figure 5-2). The piston uses a dynamic o-ring to seal the inside
cell chamber bore. Lastly the cell ejector plate is bolted to the cell slide and
Figure 5-2: Transparent Microencapsulator Model
Connects to Linear Actuator Drive Rod
Cell Chamber
Cell Ejector Plate
Figure 5-3: Encapsulator
Ba2Cl Bath Distance to
Bath Down and Up Strokes
Alginate and Microspheres
Figure 5-4: Cell Slide section
In order to purge air from the system, a hole was drilled through the plunger, and
Figure 5-5: Plunger
Two cell ejector plate setups were used for this study. The working
thickness of cell ejector plates was 0.05 inches, and the hole diameters used
were 0.0156, 0.009, and 0.007 inches. Two different hole patterns were used.
second was a plate with five holes on a 5/8 inch bolt circle with one hole in the
center (Figures 5-6 and 5-7). Images were taken of the individual holes drilled
for each plate using a scanning electron microscope (Figure 5-8). Each hole
was countersunk and drilled manually. For further accuracy these holes should
Figure 5-8: Image of individual hole
The system is controlled by using a software package called Motion
Planner (Parker Hannifin). For this apparatus, a program was written to drive
the plunger in the vertical direction. The parameters that are directly controllable
or parameters that you can specify are: number of cycles, downstroke distance
from datum, upstroke distance, velocity, and acceleration of the plunger in both
Cycle: Number of complete down and upstroke per run.
Downstroke: The distance the plunger travels down, relative to the absolute
position of the plunger from the previous cycle. This variable input is setup for a
scaling factor of 1000, and the units are in inches. For example, for an input of
12, the distance down will be 0.012 inches.
Upstroke: The distance the plunger travels up after each downstroke, relative
to the zero position. This variable input is also setup with a scaling factor of
1000, and units in inches.
Velocity: The speed at which the plunger moves on each down and up stroke.
The units on this variable are rev/s.
Acceleration: The rate at which the plunger changes its velocity. The units for
this variable are rev/s/s. For example, an acceleration of 200 will approach the
set velocity slower than an acceleration of 800.
Each of these variables is considered during the parametric study with the
encapsulator. As a result, the minimums and maximums for each variable are
determined. Due to the viscosity and hole diameter, when the internal pressure
exceeds the maximum motor output force, the stepper motor cannot stay in
phase, and produces motor slippage. If the motor starts slipping, then the beads
created are no longer valid, because then the variables are not met by the
motor. Motor slippage can be determined during testing by the closed loop
The parametric study considerers the variables listed above. The range
for each variable is case sensitive. Therefore, each variable must be varied for
each constant of the other variables. The case studies considered numbered
over 500, but not all of the studies showed bead formation. Each case study
that produced viable beads is reported with specific bead diameter and whether
polymorphism, a tail, is present.
6. Results
Spherical bead diameter and polymorphism was studied with respect to
each of the variables stated earlier. Polymorphism is described as a tail that
forms on a bead upon exiting the encapsulator. These tails may cause
problems for bead durability and stability; therefore, it is a variable to consider.
Each parameter was studied to bette\r understand the effects on the bead
production. Along with the parameters listed earlier, the distance from the
encapsulator to the barium chloride bath was studied. After preliminary tests
were completed, it was determined that some of the variables could be held
constant for the study. The number of cycles only determines the number of
beads that will be produced through one test. Since this is not part of the study,
this variable is held constant. The second variable that is held constant is the
distance to the bath. Previous studies have shown that a cross-linking bath
must be placed under the encapsulation device so that the beads will not reach
bath can be placed at four inches from the cell ejector plate. This is the distance
from the exit to the surface of the bath. The volume of the barium chloride bath
is 75 mL. Throughout the parametric study, this variable was held constant.
The other variables, which include: downstroke, upstroke, acceleration, velocity,
hole diameter, and hole frequency, are varied.
5.1. Variables
The variables each have an acceptable range to consider. In order to find
this range, each alginate sample was run through the encapsulator, using the
plate with a single 1/64 inch hole. The samples were taken and examined with
the microscope. Based on the sample observations, the variable range was
optimized. The first range considered was as follows:
Downstroke and Upstroke: 12, 11, 10, 9, 8, 7, 6, 5, 4, 3, 2, 1, 0
Acceleration: 200, 400, 600, 800, 1000, 1200, 1400, 1800, 2000, 3000, 4000,
5000, 6000, 7000, 8000
Velocity: 0.1, 0.2, 0.3, 0.4, 0.5, 0.6, 0.7, 0.8, 0.9, 1.0, 1.2, 1.4
Cycle: 10
Each of the possible combinations of these variables was considered. The
observations varied with each sample, but the bad samples consisted of intense
sample has the lowest viscosity; therefore it should be the easiest to push
through the outlet.
After these tests were completed, the variables were condensed. With
these combinations, each sample concentration was tested with the
encapsulator, through each cell ejector plate.
5.2. Sample Results
The viscosity was the variable that determined whether a sample could
be used for the parametric study. For the higher viscosities, the sample could
not be used to produce beads. The LVG alginate had viscosities ranging from
40 to 78 centiPoise. The other two types of alginate, MVM and MVG, were too
viscous to use in the parametric study. None of the alginate samples could be
used to produce beads for the cell plates with hole diameters of 0.007 and 0.009
inches. Therefore, the two plates used in this study both have hole diameters of
0.015 inches. The final combination of samples observed is given below (Table
6-1).
These problems are attributed to two variables that need to be considered at a
later time. The linear motor used in this study pushes 75 lbf. If the linear motor
is changed to allow for a higher force, then this problem may not arise. The
other variable to consider is the number of holes. If the number of holes is
increased, then the sample viscosity range can be increased as well. Despite
these problems, the parametric study showed promising results with the LVG
Table 6-1: Samples Taken for Examination
Class Levels Values
Cycles (#) 2 5, 10
DownStroke (x 1/1000 inch) 1 12
Upstroke (x 1/1000 inch) 4 2, 4, 6, 8
Velocity (rev/s) 3 0.2, 0.6, 1.0
Acceleration (rev/s/s) 3 800, 4000, 8000
Sample Type 1 LVG
Concentration (% weight) 2 1.5, 1.8
Hole Diameter (inches) 1 0.015
Hole Pattern (#) 2 1, 6
Samples Encapsulated 2
5.3. Microcapsule Examples
In order to better understand visually how the microcapsules are
examined, pictures were taken of various samples throughout the
experimentation. Examples of the alginate spheres with and without tails are
given below (Figures 6-1 through 6-3). Each image is taken at a magnification
level. For a magnification level of 2, the defined magnification factor is 4. For a
sample reading of 80.0 lines, the actual reading is
mm
00 . 1 05 . 0 4
0 . 80
= ×
The images below are taken using a Scanning Electron Microscope (Figures 6-4
through 6-8). The images show good spherical shapes as well as some
fragmentation and tailing effects.
Figure 6-8: Microencapsulation example #5 with fragmentation.
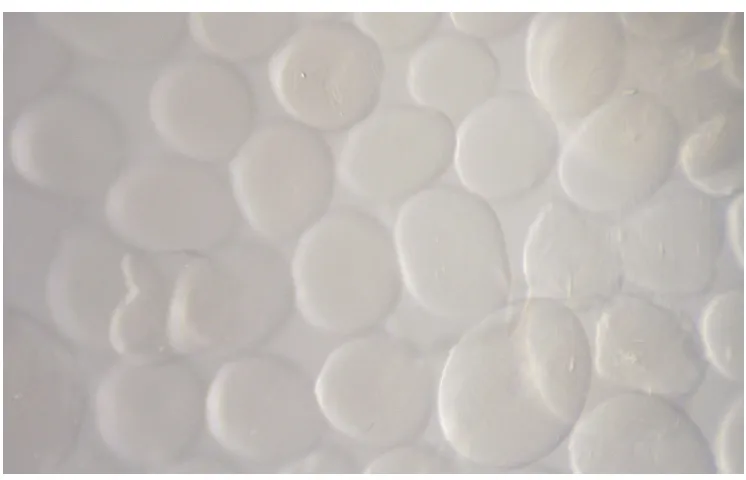
For the polystyrene microspheres encapsulated in alginate, the beads range
from 1 to 3 beads in a good spherical bead. Some of the samples show that the
non-spherical beads contain more beads than normal, but these beads are not
measured for the sample. A single polystyrene microsphere is shown below
before encapsulation (Figure 6-9). Examples of the polystyrene microspheres
after encapsulation are shown below (Figures 6-10 through 6-13). Beads that
seem to be “out of focus” are actually in another plane within the same
Figure 6-11: Polystyrene microspheres after encapsulation with a tail (M = 8.75).
Figure 6-13: Polystyrene microspheres after encapsulation from a sample (M = 4).
6.4. Result Analysis
The results are quantified below according to the variables considered.
Each section includes the ANOVA analysis and the variable interactions, which
govern the bead diameters measured. The variables that are analyzed include:
o DF is the degrees of freedom for each variable or combination of
variables.
o P-value measures the consistency by calculating the probability of
o Least Square Means, or adjusted means, are the means that have
been corrected for imbalances in other variables.
6.5. Alginate Microspheres
Empty alginate microspheres were produced with LVG alginate concentrations
of 1.5 and 1.8 %. The samples were run with the test parameters described
above, using both cell ejector plates (Table 6-1). The bead diameters were
measured, and the polymorphism was observed. With each sample, the beads
were selected randomly for measurement.
6.5.1. 1.5% LVG through Cell Ejector Plate with 1 Hole
The LVG alginate is used to run through the encapsulation process using
the cell ejector plate with a single 0.015 inch hole. The variables considered are
velocity, upstroke, and acceleration, while the cycle is constant. From the
ANOVA analysis, the levels of variation are listed by variable (Table 6-2).
Table 6-2: Class level information for 1.5% LVG through 1 hole cell ejector plate
Class Levels Values
Velocity 3 0.2, 0.6, 1
Upstroke 4 2, 4, 6, 8
The results of the analysis show the interactions between variables
(Tables 6-3). By using the type III sum of squares, the differences between the
predicted bead diameters over a balanced velocityXaccelerationXupstroke
sample or population. Therefore with this test the differences between the
LS-means are being tested. The three variables including velocity, upstroke, and
acceleration, are tested to find the effect of each on the bead diameter and tail
presence. Again, this test is done by examining the p-value for each variable
effect. Given a p-value less than 0.05 is accepted as significant. If the p-value
is significant, the f-value is examined.
The test is done to see the effect of each variable alone as well as with
the other variables. When two of the variables have a significant effect together,
this is a 2-way interaction. When all three variables have a significant effect
together, this is a 3-way interaction. If a 3-way interaction is present, then this is
the effect that will be examined because then the rest of the effects of void. If a
3-way is not present, then the 2-way interactions are examined. If neither type
of interaction is present, then each of the three variable effects are examined.
Velocity and upstroke have a strong effect on the bead diameter based on the
p-value. But there are 2-way and 3-way interactions between all three
parameters. Since a 3-way interaction is present, this will be the effect of most
interest. Therefore, all three variables have an effect on the mean diameter.
There are also 2-way and 3-way interactions on the tail presence data. The
3-Table 6-3: ANOVA Analysis for 1.5 % LVG through 1 hole cell ejector plate
Dependent Diameter Tail
Source DF F Value P Value F Value P Value
Velocity 2 61.67 <0.0001 0.75 0.4729
Upstroke 3 142.75 <0.0001 9.82 <0.0001 Velocity*Upstroke 6 7.93 <0.0001 6.49 <0.0001
Acceleration 3 0.99 0.3959 1.83 0.1401
Velocity*Acceleration 4 10.71 <0.0001 2.03 0.0876 Upstroke*Acceleration 6 18.81 <0.0001 2.5 0.021 Velocity*Upstroke*Acceleration 11 9.1 <0.0001 2.29 0.0092
The following graphs show: the mean diameter as a function of the
acceleration with the upstroke = 2, 6 (Figure 6-14) and upstroke = 4, 8 (Figure
6-15). The second set shows: The % of beads without tails as a function of the
acceleration with the upstroke = 2, 4 (Figure 6-16) and upstroke = 6, 8 (Figure
Figure 6-14: Mean Diameter as a function of Acceleration for Upstroke = 2 and 6. (1.5% LVG)
From this graph, there is an obvious linear relationship based on the
acceleration. The slope increases as the velocity increases for an upstroke of 2.
The inverse is the case for an upstroke of 6. As the acceleration increases, the
variability of the bead diameter decreases. Therefore, at higher accelerations,
the velocity has a lower effect on the change in bead diameter. By just
examining the bead diameters, the values are within an acceptable range of 0.4
Figure 6-15: Mean Diameter as a function of Acceleration for Upstroke = 4 and 8. (1.5% LVG)
From this second graph, there is also a linear relationship between the
mean diameter and acceleration. The variability also decreases with
acceleration across the velocity range for both upstroke values. The bead
diameter increases as velocity increases for both upstroke values. The bead
diameters cover a larger range, from 0.4 to 1.1 mm, but the range does
Figure 6-16: Beads without Tails as a function of Acceleration for Upstroke =2 and 6. (1.5% LVG)
This graph shows a linear relationship between acceleration and beads
present without tails. The variability decreases with acceleration. There is an
increasing trend for:
o U = 2, V = 0.2 and 1.0
o U = 6, V = 0.6
A decreasing trend is present for the rest of the cases:
o U = 6, V = 0.2 and 1.0
Figure 6-17: Beads without Tails as a function of Acceleration for Upstroke =4 and 8. (1.5% LVG)
From this graph, a high level of variability is present across the
acceleration values. The linear relationships are present for the most part,
except for an upstroke of 8. From this graph and the previous, there are linear
trends for an upstroke of 4 and 2. Unfortunately, these results do not give a
![Figure 1-1: Islet Microencapsulated [5]](https://thumb-us.123doks.com/thumbv2/123dok_us/1570938.1193147/11.612.184.450.263.556/figure-islet-microencapsulated.webp)
![Figure 3-1: Alginate Droplet Generator [19]](https://thumb-us.123doks.com/thumbv2/123dok_us/1570938.1193147/22.612.94.526.69.382/figure-alginate-droplet-generator.webp)
![Figure 3-3: JetCutter [12]](https://thumb-us.123doks.com/thumbv2/123dok_us/1570938.1193147/24.612.95.527.343.638/figure-jetcutter.webp)
![Figure 3-4: Effects of Electrostatic Potential on the Average Bead Diameter [22]](https://thumb-us.123doks.com/thumbv2/123dok_us/1570938.1193147/27.612.110.505.181.516/figure-effects-electrostatic-potential-average-bead-diameter.webp)

![Figure 4-4: Changes in diameters of Ba++incubation at 37°C. Data represents mean+SEM of the percentage change in diameter -alginate microspheres during 14-day saline with respect to initial measurements on day 0 (n=5) [10]](https://thumb-us.123doks.com/thumbv2/123dok_us/1570938.1193147/39.612.104.526.318.606/changes-diameters-incubation-represents-percentage-alginate-microspheres-measurements.webp)