Soil Liquefaction Evaluation using Deterministic
and Probabilistic Approaches: A case study
Shashank Burman1 and A. Murali Krishna2
Undergraduate Student, Department of Civil Engineering, Indian Institute of Technology Guwahati, Assam – 7810391
Assistant Professor, Department of Civil Engineering, Indian Institute of Technology Guwahati, Assam – 7810392
Abstract-A study has been undertaken to provide a better understanding of the liquefaction potential evaluation. This paper discusses the evaluation of seismically induced Liquefaction based on semi-empirical field-based procedures using the Standard Penetration Test (SPT) profile of soil. This work has been carried out to initiate such studies in the region and to address the problem of seismically induced liquefaction based on deterministic as well as probabilistic approach. A case study for IIT Guwahati with 3 different borehole locations has been carried out for 3 different Earthquake Moment Magnitude of M=5, 6 and 7 respectively. Liquefaction would be suspected to occur upto a depth of 15-18 m. The results obtained in probabilistic approach are in good agreement with deterministic approach. This Study provides a good understanding to account for the liquefaction assessment based on two approaches.
Keywords: Earthquake, Liquefaction assessment, SPT.
I. INTRODUCTION
Guwahati is situated along the bank of river Brahmaputra in the North Eastern (NE) region of India.The Indian Standard code of practice (IS 1893) [8] identified north-east India, including Assam as a highly seismic zone by placing it in the highest seismic zonal level i.e. zone V. The northeastern part of India has an exceptionally complex tectonic and geologic setup. It has the Himalayan mountain belt in the north, Mishmi hills in the west, Naga Patkoi mountain range in the south, and the Brahmaputra plain at the middle, along with the Shillong Plateau, the Burmese arc, the Tripura folded
belt, and the Surma Valley, that makes this region among most seismically active regions of the world [14].Since 1897, this region has experienced two great earthquakes of magnitude above 8 and about 14 large earthquakes of magnitudes varying between 8 and 7. The 1869 Cachar earthquake (Mw7.6) and 1987 great Assam earthquake (Mw 8.1) caused severe damage in and around Guwahati city through liquefaction and settlement [13,14]. A massive stretch of natural water bodies have been occupied for construction of buildings, which are highly susceptible to local site effects such as soil amplification and liquefaction during earthquakes. Studies have been reported on seismicity of Guwahaticity [15].
and a standard of practice for many engineers around the world. Recently Idriss and Boulanger [4] have proposed an updated and improved method for the evaluation of liquefaction potential of soil deposits, which has been used in the present analysis.
Although Deterministic analysis is well accepted method to evaluate the soil liquefaction, there are uncertainties left with traditional deterministic approach where factors of safety are often difficult to interpret. To overcome
these uncertainties, probabilistic and statistical
approaches have been employed in the
literature[12,20,21]. There have been several notable studies done so far since last three decades. In a probabilistic analysis, the liquefaction potential is usually expressed as a function of liquefaction probability using various approaches. Christian and Swiger[1] analysed the available SPT data from field observation of soil
performance and presented the probability of
liquefaction. Toprak[20] suggested SPT based
liquefaction triggering resistance curves corresponds to a specific percentage of probability of liquefaction. Halder and Tang [3] used the SPT results and carried out a second moment statistical analysis to examine the limit state and empirical procedure introduced by Seed and Idriss [16]. Iwasaki et al. [11]proposed a procedure to evaluate liquefaction potential index, which was based on the in situ test data over the entire borehole.
Till now, there have been limited studies done so far on probabilistic approach of liquefaction for Guwahati city. An attempt has been made to address the problem of assessment of seismically induced Liquefaction based on deterministic as well as probabilistic approach. Study area is IIT Guwahati campus where new construction activities are going on. In the initial stage of this study, the analysis has been carried out at three different locations inside the IIT Guwahati campus to get the
proper understanding on seismically induced
liquefaction. The analysis has been carried out for earthquake moment magnitudes of M=5, 6 and 7 respectively.
II. METHODOLOGY
Seismically induced Liquefaction potential isevaluated using the simplified procedure based on the available SPT profile of soil (Idriss and Boulanger [4]). Based on the suggested method, the liquefaction potential can be estimated simply by using the fundamental properties of soils, i.e. SPT-N value, unit weight, mean particle diameter, and the maximum acceleration at ground surface.
2.1 Deterministic approach
Initial step in the evaluation of liquefaction assessment includes determination ofearthquake induced loading expressed in terms of cyclic stress ratio (CSR). This loading is compared with the liquefaction resistance of the soil, which is expressed in terms of cyclic resistance ratio (CRR). The Factor of safety (FOS) is evaluated using CSR and CRR as given below.Liquefaction is expected to occur when FOS is less than 1 i.e. when the loading exceeds the resistance.
(1)
2.1.1. Cyclic stress Ratio (CSR)
In the deterministic approach, Cyclic Stress Ratio(CSR) induced by earthquake ground motions, at a given depth z below the ground surface is usually calculated using Seed and Idriss [16] relation
(2)
where is the peak horizontal acceleration on the ground surface, is the total vertical stress in soil, is the effective vertical stress at depth z and is the stress reduction factor that measures the attenuation of peak shear stress with depth due to the non-elastic behaviour of soil. All the boreholes considered in the present work being less than 34 m in depth, the stress reduction coefficient ( ) is calculated [2, 5] using the following equations:
(4)
(5)
It has been customary to adjust the values of CSR that pertain to the equivalent uniform shear stress induced by an earthquake having a moment magnitude M through the magnitude scaling factor (MSF), so that the adjusted values of CSR would pertain to the equivalent uniform shear stress induced by an earthquake having a moment
magnitude M = 7.5, i.e. given by the following
equation.
(6)
Idriss [5] proposed the MSF using the given equation as
(7)
Since the liquefaction resistance increases with increasing confining stress, a correction factor is applied such that the values of CSR correspond to an
equivalent overburden pressure of 1 atmosphere.
(8)
where
(9)
(10)
is the atmospheric pressure = 101.3kpa. is the
corrected SPT-N value, limited to a maximum value of 37. value, corrected for the field test procedures and to an average energy ratio of 60% of the SPT hammer, factor to normalize N to a common reference effective over burden stress of 1 atmospheric pressure.
(11)
where (12)
2.1.2. Cyclic resistance ratio (CRR)
Idriss and Boulanger [4] recommended the following expression to be used for determining the CRR, for cohesion less soil with corrected SPT N value for clean sands( (N1) 60cs).
(13)
(14)
is the correction for fines content in percent (FC) present in the soil and is given as
(15)
2.2 Probabilistic approach
(16)
where =probability of liquefaction; CSR is not
“adjusted” for magnitude or duration effects, FC=percent fines content in integer and =standard cumulative normal distribution.
PL (in %) Liquefaction severity class
0-15 Very low
15-35 Low
35-65 Moderate
65-85 High
85-100 Very high
Table 1. Probabilistic liquefaction severity classification suggested by [19]
Probabilistic approach is used to assess the probability of initiation of liquefaction. Also, different probability values indicate different scale of severity of liquefaction initiation suggested by [19] is given in Table1.
III. STUDY AREA and TEST DATA
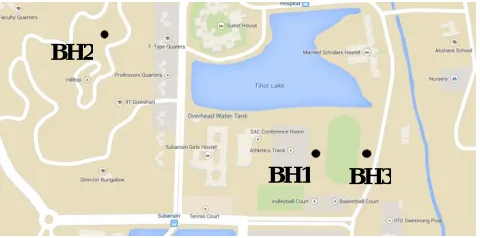
IIT Guwahati is situated along the bank of river Brahmaputra in the North Eastern (NE) region of India. The greater Guwahati region encompasses an area of about 600 km2 (latitude 26.1838° N, longitude 91.7633° E). The overall topography of the greater Guwahati region consists of several continuous hill tracts varying in altitude from 200 to 400 m above mean sea level (MSL) and isolated hill locks up to 300 m above MSL [15]. The study area and borehole locations are shown in Figure 1. Three Boreholes at three different locations marked in circle are shown in figure 1. BH1 and BH3were drilled by engineering firms during the construction of Student Activity Centre (SAC) while BH2 is located near Faculty quarters within the boundary
area of IIT Guwahati. Approximate distance between BH1 and BH3 according to engineering firm report is 40 meters.
Figure 1. Study Area
3.1.Standard Penetration Test (SPT) Data
The standard penetration test is a widely used in situ test to evaluate the geotechnical properties of soil. These soil investigations were carried out by engineering firms involved during the construction. The test was performed following Indian Standard code of practise [9]. A split spoon sampler with external and internal diameter of 50 and 35 mm, respectively, and 650 mm long is driven into the soil under the impact of a 63.5-kg hammer dropped from a height of 0.76 m. The sampler is driven to penetrate to a depth of 450 mm. The number of blows required by the sampler to penetrate the last 300 mm of depth is called the SPT-N value. For this study, boreholes BH1 and BH3 were drilled upto a depth of 25.5 m and BH2was drilled upto a depth of 21 m, in order to get the knowledge of subsurface stratum and soil type.
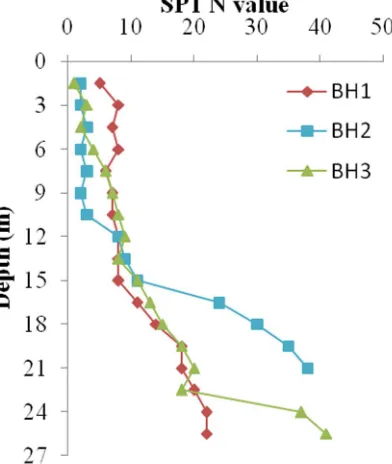
Variations of SPT N value with depth in different borehole are shown in Figure 2. It is seen that the soil deposit comprises of sand, clay and silt. The specific gravity of soil was reported as 2.64.Whenever the N-SPT value exceeds 100 for 300 mm penetration, it is treated as refusal (R) and further N-SPT values were not
measured for that depth as
BH3 BH2
Figure 2.Variation of SPT N value with depthfor location 1 with BH1, location 2 with BH 2 and location 3 with BH 3.
per IS 2131 (1981) [9].All boreholes were drilled with diameter of 150 mm as per IS: 1892 (1974) [7] and N-SPT values were measured regularly at 1.5 m intervals. The SPT-N values of the soil strata of the investigating area varies from 1 to 38 indicating the degree of consistency is very soft to hard. Disturbed and undisturbed samples were collected at possible depths as per IS: 2132 (1986) [10]. The physical properties were determined in the laboratory using disturbed soil samples as per IS: 1498 (1970) [6].
IV. RESULTS
Liquefaction potential over the study area was evaluated using the simplified procedure based on the available SPT profile of soil (Idriss and Boulanger [4]). The analysis involved two approaches, Deterministic and Probabilistic respectively. The analysis has been done for three earthquake magnitudes (Moment magnitude M=5, 6 and 7). For all the three earthquakes magnitudes, surface Peak Ground Acceleration (PGA) is chosen as 0.18g in the study.
of 100% within this depth indicating very high scale of severity of liquefaction initiation.Hence, the results obtained from deterministic as well as probabilistic approaches are in good agreement.
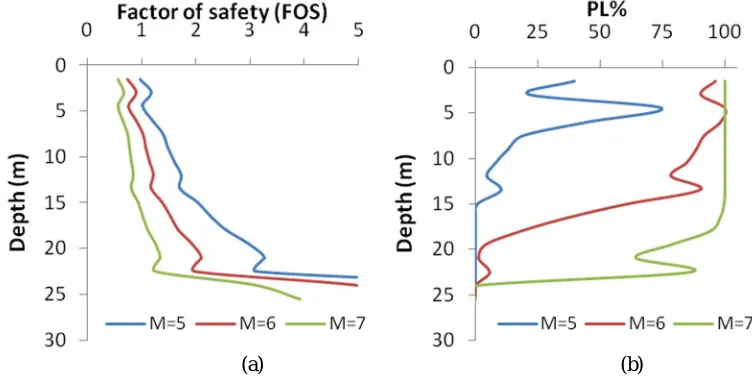
Figure 4 shows the results of liquefaction assessment at location 2 (BH2) for earthquake magnitude of M=5, 6 and 7 respectively. For M=5, FOS values are close to one upto 10.5m depth and it increases drastically beyond 10.5 m. Similarly, PL increases with depth showing moderate to high scale of severity with maximum value of 88% at 10m depth. Hence, location 2 is more vulnerable to liquefaction affects compared to location 1 for same earthquake magnitude M=5 but only upto a
depth of 10.5m beyond which FOSvalues goes on higher side as well as PL values drops down to zero. For M=6, FOS values are less than 1 upto 11m depth and increases drastically beyond 11m. Probabilistic model confirms this result with very high scale of severity i.e. 100% PL upto depth of 11m. For M=7, FOS values are less than 1 upto a depth of 12 m and increases drastically beyond 12m. Probabilistic model confirms this result with very high scale of severity i.e. 100% PLupto12 m depth and it drops to zero beyond 12m. Therefore, location 2 is more vulnerable to liquefaction affects compared tolocation 1 for same earthquake magnitudes. Although, more devastated affects can be seen at M=7.
(a) (b)
(a) (b)
Figure 4. Liquefaction assessment at location 2 for M=5,6,7 using (a) Deterministic model, (b) Probabilistic model
(a) (b)
Figure 5. Liquefaction assessment at location 3 for M=5,6,7 using (a) Deterministic model, (b) Probabilistic model
Figure 5 shows the results of liquefaction assessment at location 3 for earthquake magnitude of 5, 6 and 7 respectively. For M=5, FOS values are close to one upto depth of 4.5m and beyond 4.5 m, it increases with depth. PL value indicates moderate scale of severity of liquefaction initiation. Hence, it is more vulnerable to liquefaction affects compared to location 1 but only upto
liquefaction affects compared to location 1 and 3 for earthquake magnitude moment M= 5 and M=6. For M=7. FOS values are less than 1 upto a depth of 16.5m and hence vulnerable to liquefaction. Probabilistic model confirms this result, having maximum PL value of 100% upto16.5m depth, indication very high scale of severity of liquefaction initiation. Therefore, it can be concluded that location 3 is more vulnerable to liquefaction affects compared to location 1 and 2 for M=7.
V. CONCLUSION
This paper discusses the evaluation of seismically induced Liquefaction based on semi-empirical field-based procedure for 3 different earthquake moment magnitudes(M=5, 6 and 7). The results obtained in probabilistic approach are in good agreement with deterministic approach.IIT Guwahati lies in most seismic severe hazard zone and is highly susceptible to local site effects like liquefaction due to earthquakes in future. Location 2 is highly susceptible for liquefaction effects compared to location 1 and location 3 at lower earthquake moment magnitude of M=5 and 6. At higher earthquake magnitude of M=7, location 3 is more vulnerable to liquefaction affects compared to location 1 and 2. Damage would likely to occur within the layers up to depths of 15-18 m.
The present analysis highlights the advantage of probabilistic analysis for liquefaction evaluation and also the need to consider various soil profiles in same area.
REFERENCES
[1] Christian J. T. and Swiger W. F., (1975), Statistics of liquefaction and SPT results, J.Geotech. Eng. ASCE 101(11) 1135–1150.
[2] Golesorkhi R., (1989), Factors influencing the computational determination of earthquake induced shear stresses in sandy soils, PhD thesis, University of California, Berkeley, p 395. [3] Haldar, A., and Tang W. H.,(1979), Probabilistic evaluation of
liquefaction potential,Journal of Geotechnical Engineering Division, ASCE, Vol. 105, No. GT2, pp. 145-162, 1979. [4] Idriss IM., Boulanger RW., (2006), Semi-empirical procedures
for evaluating liquefaction potential during earthquakes, Soil DynEarthqEng 26:115–130
[5] Idriss IM., (1999), An update to the Seed-Idriss simplified procedure for evaluating liquefaction potential, In: Proceedings
TRB workshop on new approaches to liquefaction, January, Publ No. FHWA-RD-99-165, Federal HighwayAdministration. [6] IS 1498, (1970), Indian Standard Classification and
identification of soils for generalengineering purposes, First revision, Bureau ofIndian Standards, New Delhi.
[7] IS 1892, (1974), Indian Standard code of Practice for subsurface investigation for foundations, Bureau of Indian Standards, NewDelhi.
[8] IS: 1893-Part I, (2002), Indian standard criteria for earthquake resistant design of structures, fifth revision, part-1, Bureau of Indian Standards, New Delhi.
[9] IS 2131, (1981), Indian Standard, Method for standard penetration test for soils, First revision, Bureau of Indian Standards, New Delhi.
[10] IS 2132, (1986), Indian Standard code of Practice for thin walled tube sampling of soils, Second revision, Bureau of Indian Standards, New Delhi.
[11] Iwasaki, T., Arakawa, T., and Tokida, K., (1982), Simplified procedures for assessing soil liquefaction during earthquakes, Soil Dynamics and Earthquake Engineering Conference Southampton, pp.925-939, 1982.
[12] Juang C H, Jiang T. and Andrus R D., (2002), Assessing probability methods for liquefaction potential evaluation, J. Geotech. Geoenviron. Eng. 128(7) 580–589.
[13] Oldham, T., (1882), The Cachar earthquake of 10th January, 1869, Geological Survey of India Memoirs, 19, 1-88.
[14] Oldham, R. D., (1899), Report on the great earthquake of the 12th June 1897, Geological Survey of India Memoirs, 29, Reprinted, 1981, Geological Survey of India, Calcutta, 379. [15] Raghukanth STG, Sreelatha S, Dash SK, (2008), Ground motion
estimation at Guwahati city for a Mw 8.1 earthquake in the Shillong plateau, Tectonophysics 448:98–114.
[16] Seed, H. B., and Idriss I. M., (1971), Simplified procedure for evaluating soil liquefaction potential, Journal of Geotechnical Engineering, ASCE, Vol. 97, pp.1249-1273, 1971.
[17] Seed H B and Idriss I M., (1982), Ground motions and soil liquefaction during earthquakes, Berkeley, CA: Earthquake Engineering Research Institute; p. 134.
[18] Seed H B, Tokimatsu K, Harder L F and Chung R, (1985), Influence of SPT procedures in soil liquefaction resistance evaluations,J. Geotech. Eng. ASCE 111(12)1425–1445. [19] Sonmez H. and Gokceoglu C., (2005), A liquefaction severity
index suggested for engineering practice, Environ Geol (2005) 48: 81–91 DOI 10.1007/s00254-005-1263-9.
[20] Toprak S, Holzer T. L., Bennett M. J. and Tinsley J. C.,(1999), CPT- and SPT-based probabilistic assessment of liquefaction, Proceedings of 7th US–Japan Workshop on Earthquake resistant design of lifeline facilities Buffalo, N.Y., pp. 69–86.
[21] Youd T. L. and Idriss I M.,(1997), Evaluation of liquefaction resistance of soils, Proceedings of NCEER Workshop on Evaluation of Liquefaction Resistance of Soils, Tech. Rep., NCEER-97–0022, State University of New York, Buffalo. [22] Youd T. L., et al.,(2001), Liquefaction Resistance of Soils: